Technical analysis by Louigi_24 about Symbol PAXG: Buy recommendation (5/6/2025)

Louigi_24
GOLD - Bullish Structure with Potential Continuation Play
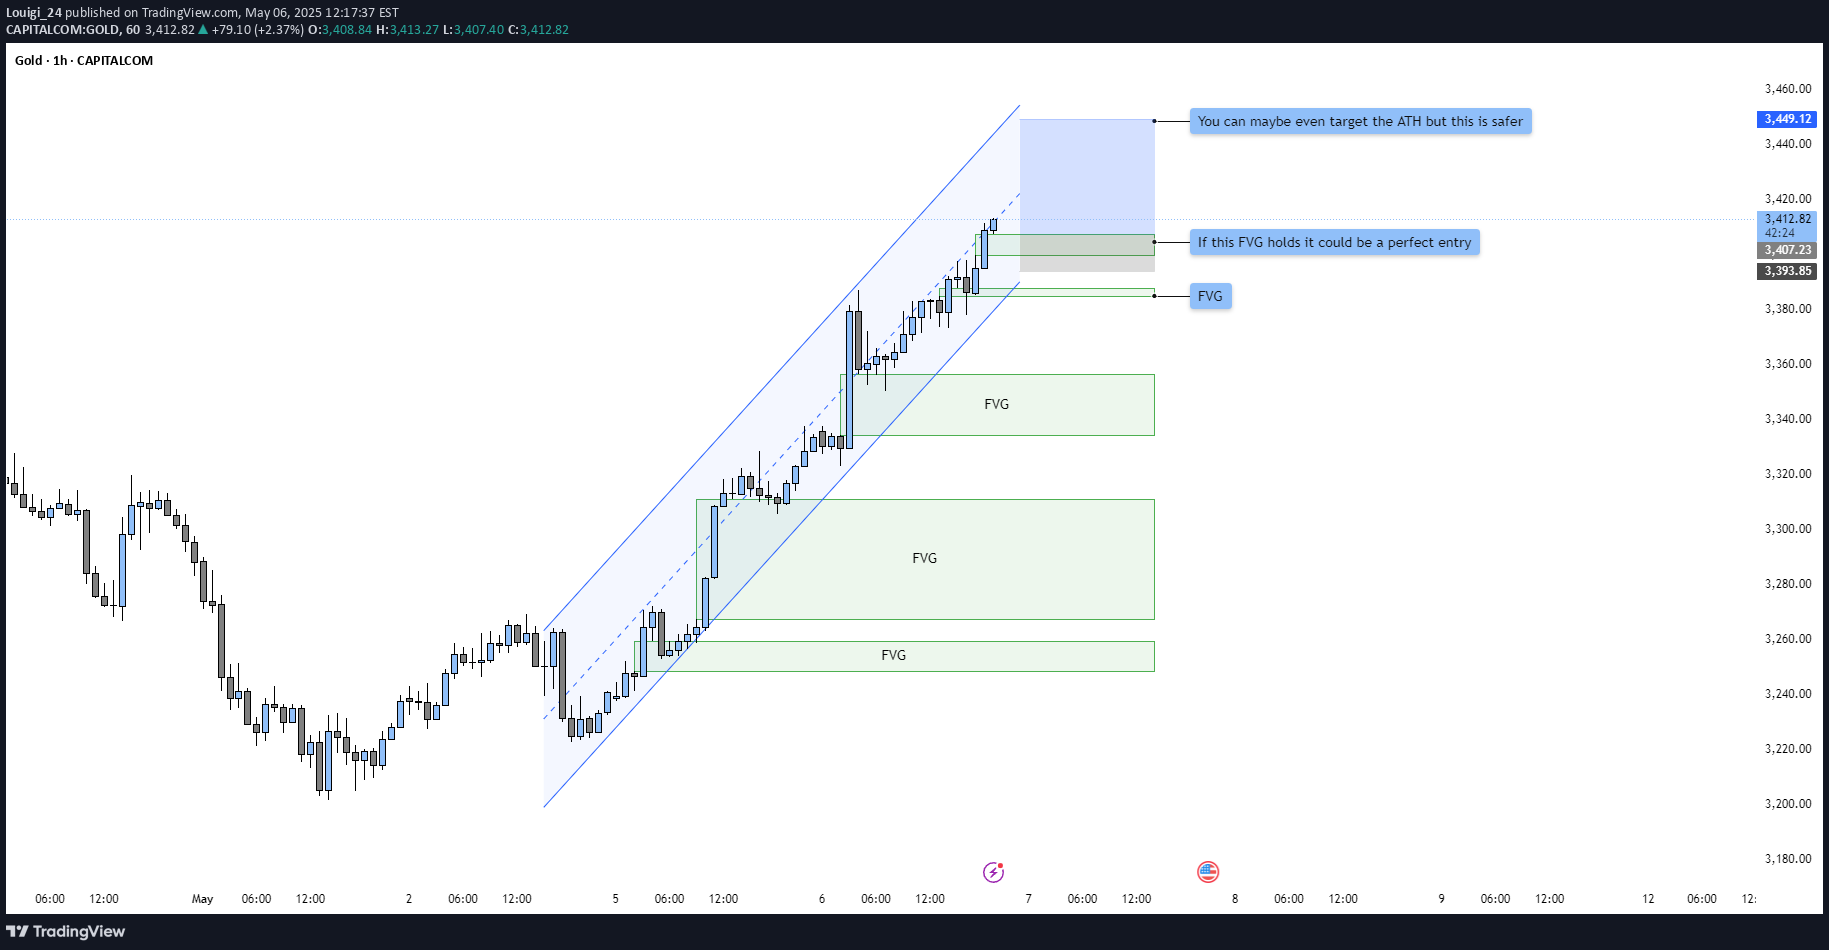
The current 1-hour chart of Gold (XAU/USD) demonstrates a clean bullish structure supported by an ascending channel and multiple unmitigated Fair Value Gaps (FVGs) acting as potential demand zones. This setup highlights the strength of the ongoing uptrend and offers insights into a high-probability continuation entry should price retrace.Market Context and Trend Structure:Following a prolonged downtrend visible in the earlier part of the chart, Gold reversed decisively with a bullish break of structure. Since then, price has been consistently printing higher highs and higher lows while respecting an ascending parallel channel. This channel, marked by two trendlines, encapsulates the short-term bullish momentum.The current move is strong and impulsive, suggesting that institutional order flow is behind this leg. Candles are elongated with minimal wicks on the upside, reinforcing the idea of aggressive buying pressure.Key Demand Zones and FVG Analysis:Three major Fair Value Gaps (FVGs) have formed along the recent bullish leg, each potentially acting as a zone of reaccumulation. These FVGs are marked in green and correspond to areas where price left inefficiency after strong upward moves without immediate retracements.* The most recent FVG, located just beneath current price, aligns with a minor structure support zone and overlaps partially with the lower boundary of the ascending channel. This area stands out as a prime candidate for a bullish continuation entry, particularly if price retraces and shows signs of holding.* The middle FVG, slightly lower in the structure, represents a deeper mitigation level and could serve as a secondary entry in case the initial zone fails to hold.* The lowest FVG is a broader inefficiency zone that formed near the base of the bullish reversal. If price returns this far, it would likely signify a temporary shift in momentum or deeper liquidity hunt before another leg upward.Channel Structure and Momentum:The ascending channel has been respected throughout the rally, offering visual confirmation of trend strength and the rhythm of pullbacks. The current price is near the upper boundary of the channel, and a short-term retracement is a logical expectation before continuation.A pullback into the FVG + lower channel region would represent a convergence of structure, imbalance, and trendline support. These overlapping technical elements enhance the probability of a bounce from this zone.Projected Path:The chart also suggests a conservative bullish continuation projection, aiming toward the zone marked around 3449.12. This level appears to be a measured move extension and a safer target in relation to the overall structure. However, the note on the chart implies that the all-time high (ATH) could also be in play if momentum continues and market conditions remain supportive.The key here is the behavior around the nearest FVG. If price retraces and holds this area—potentially forming a bullish engulfing or confirmation on lower timeframes—it may offer an ideal continuation entry with minimal drawdown.Conclusion:This Gold 1-hour chart reflects a strong bullish structure with clear institutional footprints left in the form of unmitigated FVGs. The alignment of ascending channel support and bullish imbalances creates a favorable setup for continuation traders. Watching the immediate FVG zone will be critical, as it may define the next impulsive leg toward higher targets. If that zone fails, deeper FVGs below offer secondary opportunities while maintaining the bullish bias as long as structural higher lows remain intact.Let me know what you think about this!Didnt play out sadly, big red candle!