
Kap_Waves
@t_Kap_Waves

What symbols does the trader recommend buying?
Purchase History
پیام های تریدر
Filter
Kap_Waves
نزدیک پروتکل در نقطه عطف: آیا حمایت چندساله NEAR، سرنوشت بلندمدت آن را رقم میزند؟
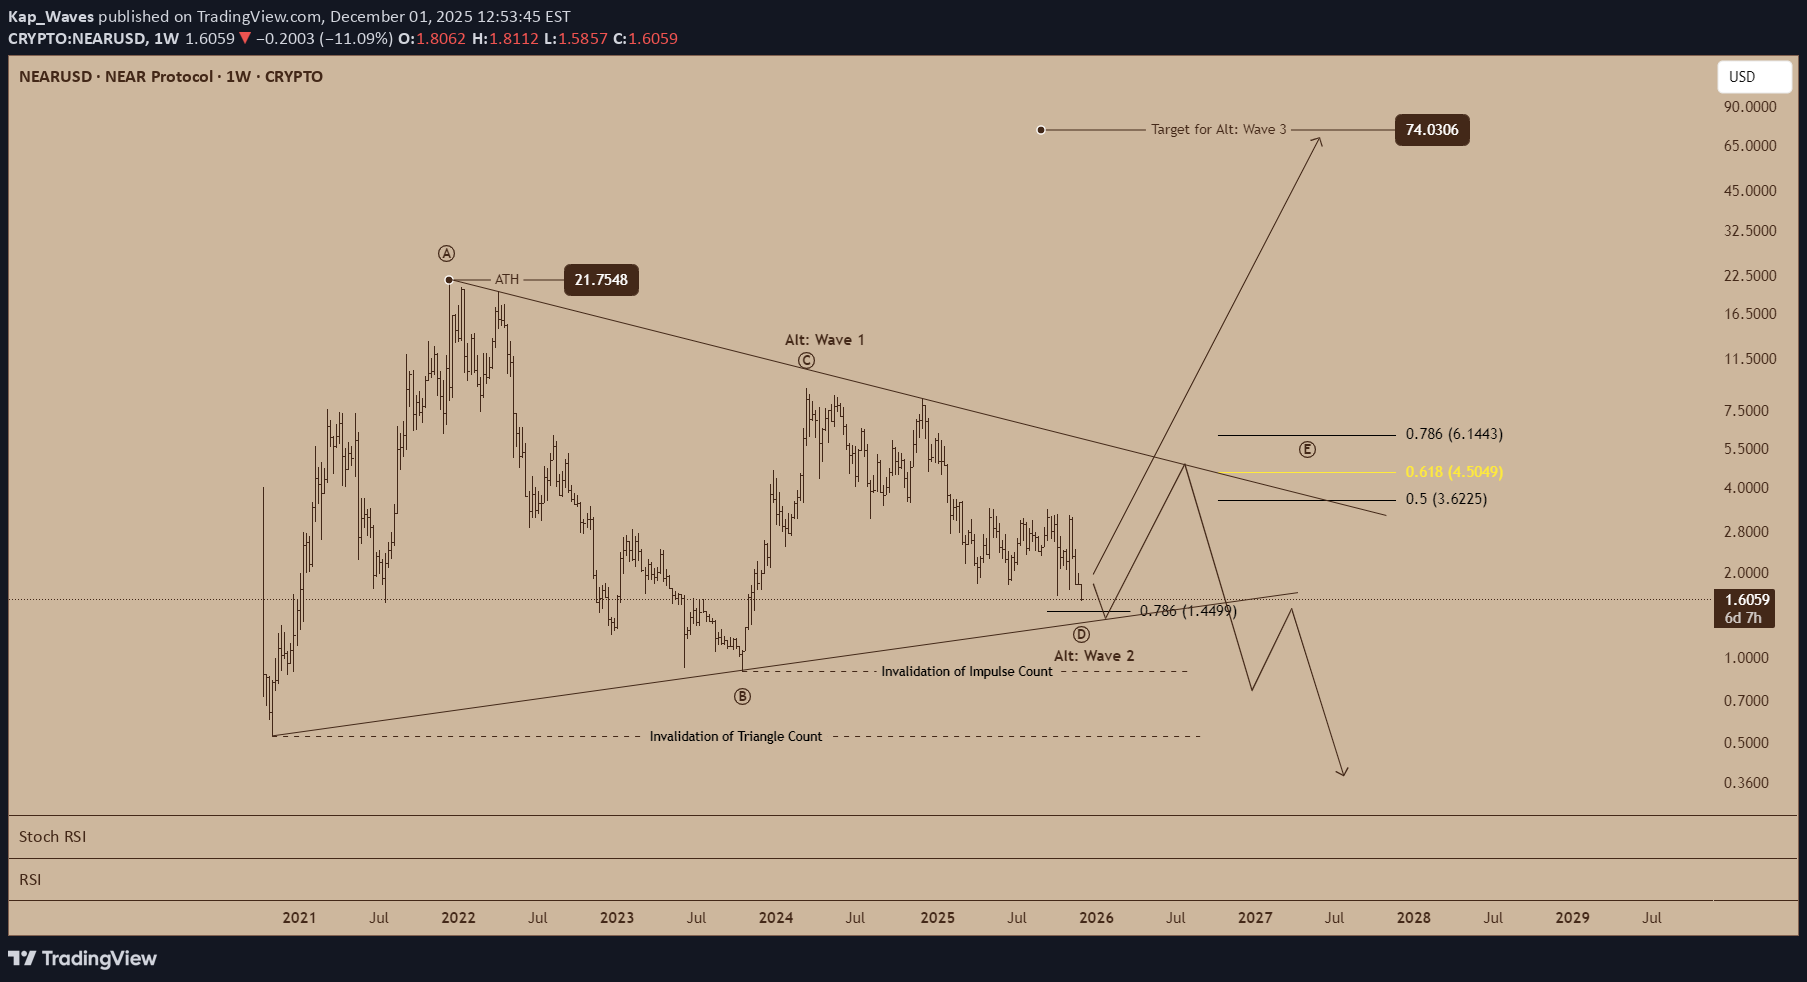
NEAR Protocol is approaching a critical juncture, with its multiyear structure tightening toward a decision point that could determine the token’s long-term trajectory. The current pattern resembles a maturing contracting triangle, a formation that typically concludes with a sharp directional break. The price has continued to drift toward the lower boundary of the structure, which has been respected since early 2021. This trendline now sits near the 0.786 retracement level at $1.449, a key support region that has emerged as the focal point for Wave D. If buyers defend this area, the broader triangle count remains intact and would set the stage for a final Wave E rebound into the $3.62 to $6.14 retracement cluster. Within that region, the 0.618 level at $4.5049 stands out as the midpoint target for a corrective lift before the pattern compresses fully. The larger bullish alternative suggests that NEAR may already be completing an extended Wave 2. A sustained hold above the lower support line would allow for the possibility of a substantial Wave 3 advance. The projected target for this alternative scenario lies far above current levels, near $74.03, which corresponds to a major Fibonacci extension and would imply a powerful long-term trend reversal. However, the stakes are high. A breakdown beneath the triangle’s lower boundary would invalidate the structure entirely and signal that the market is shifting into a deeper corrective phase. The chart marks an invalidation level beneath the broader support zone, and a decisive breach could accelerate losses toward sub-dollar territory, potentially revisiting levels not seen since the earliest stages of the token’s history. For now, NEAR trades at the midpoint between risk and opportunity. The structure is tightening, momentum indicators show oversold conditions, and the price is resting on a multi-year support line. Whether this zone marks the foundation for a major turnaround or the start of a prolonged decline will depend on how price behaves around the crucial $1.449 region as the triangle nears its conclusion.
Kap_Waves
نقشه راه ویچویش VIRTUALS تا 2026: راز موج الیوت برای جهش بزرگ بعدی
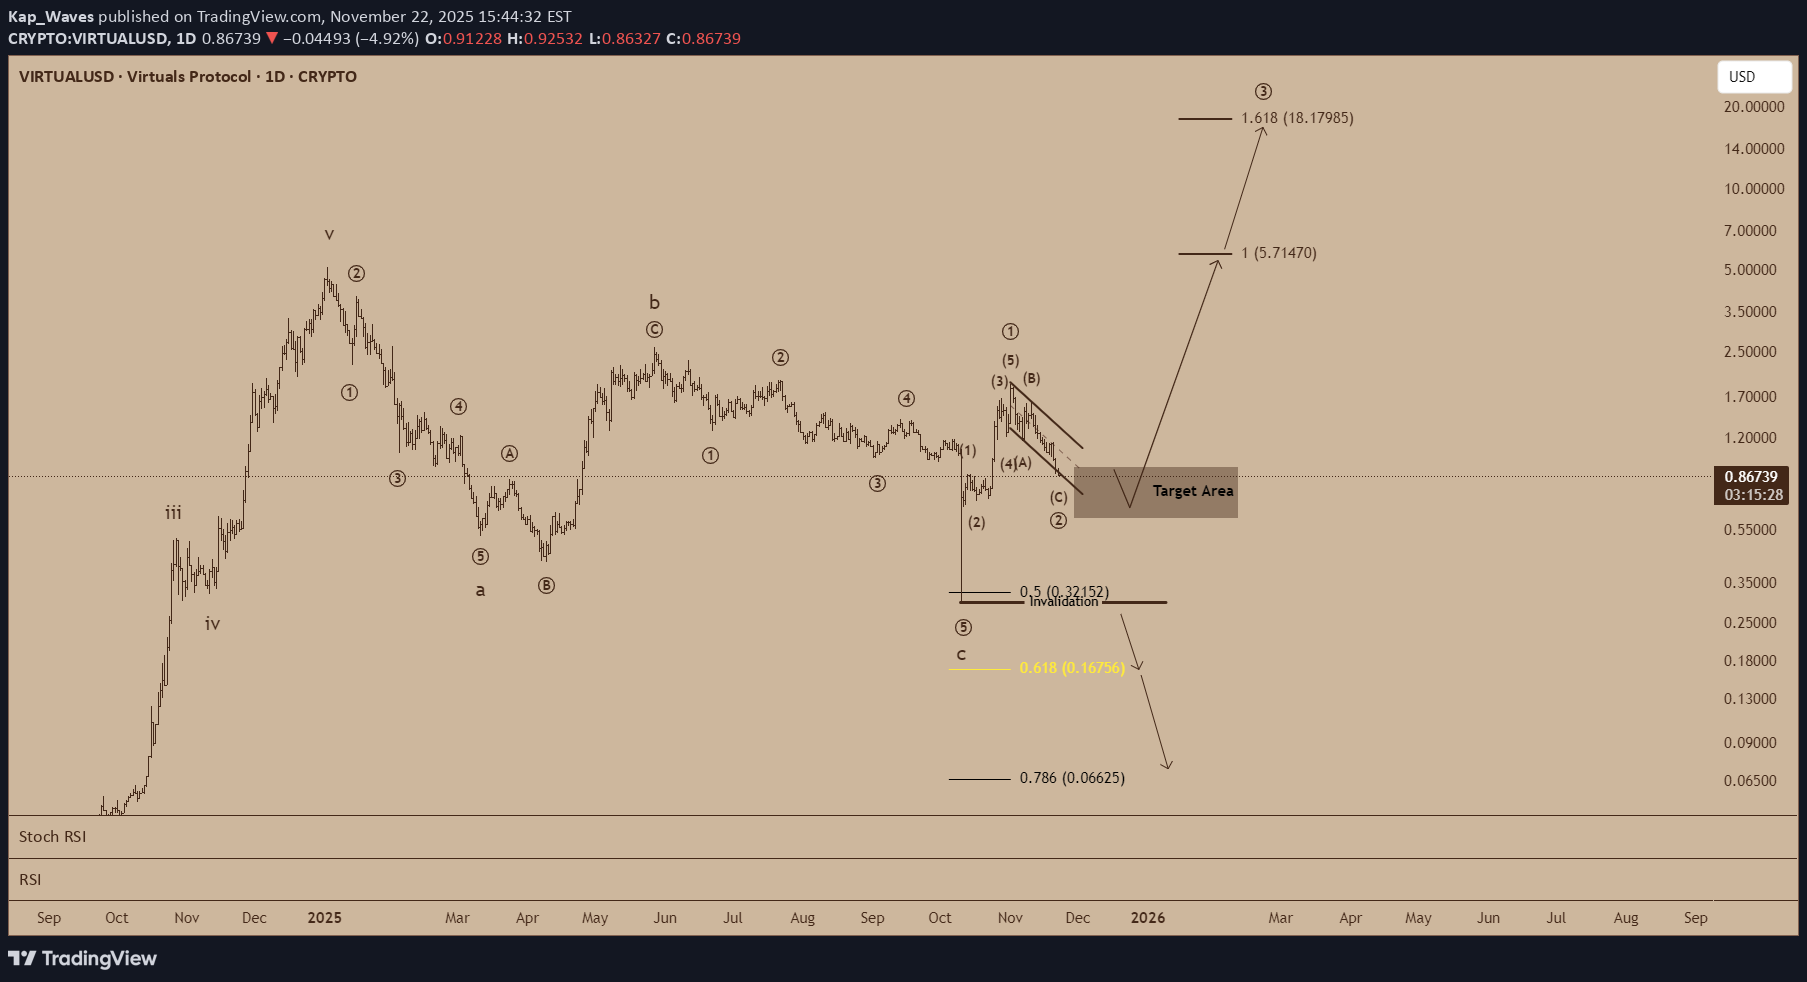
The broader structure on VIRTUALS continues to follow a clean Elliott Wave progression, with price currently moving through what appears to be the final stages of a larger degree wave ② correction. This phase is typically designed to reset sentiment, clear excess leverage, and prepare the market for the next impulsive cycle. The chart highlights a critical Target Area, supported by: 0.5 retracement at 0.3215 (also acting as invalidation) 0.618 retracement at 0.1675 (ideal C-wave termination) 0.786 retracement at 0.0662 (extreme scenario) This confluence creates a structurally important demand zone. As long as price holds above the 0.3215 invalidation, the bullish macro structure remains intact. Bullish Continuation Path If wave ② completes inside the target zone, the next multi-month impulsive cycle would naturally project: Wave 3 (1.618 extension): ~$18.17 These levels reflect proportional Fibonacci relationships often observed in early-cycle expansions. Bearish Alternative Losing the invalidation at 0.3215 opens the door for: A deeper C-wave Sweeps of 0.1675 and potentially 0.0662 Completion of a higher-degree corrective reset before a true bottom is found While still structurally valid, this would delay the next impulsive cycle. Final Thoughts Momentum indicators are nearing oversold conditions, and the wedge structure hints that the market is approaching completion of its corrective phase. Whether price bottoms at the 0.5 or 0.618 retracement, the broader Elliott Wave count suggests that VIRTUALS is preparing for its next major expansion phase—one that could carry significantly beyond the 2024 highs.
Kap_Waves
تحلیل موج الیوت بیت کوین: نقطه تصمیم حیاتی در آستانه حمایت بلندمدت!
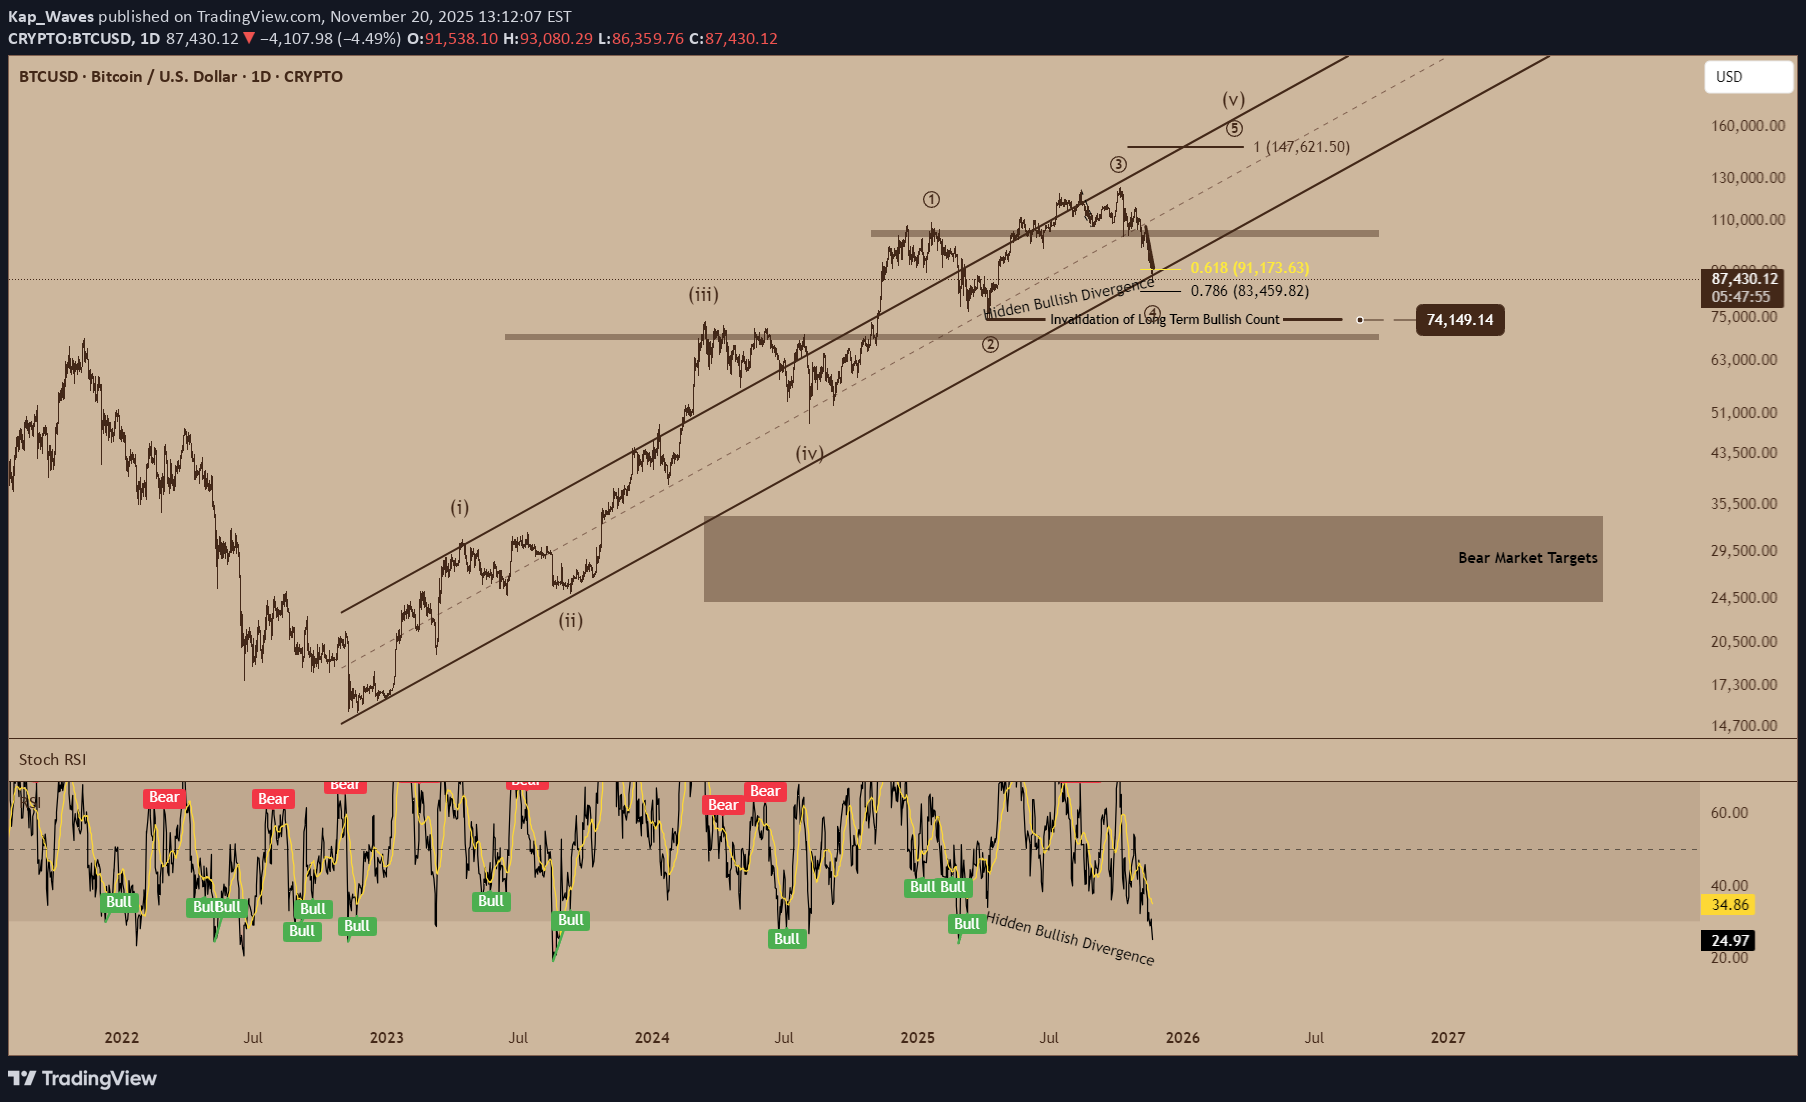
Bitcoin Elliott Wave Analysis: Critical Decision Zone as BTC Tests Long-Term Support Bitcoin is approaching one of the most important support levels in its current Elliott Wave cycle. The broader technical picture still supports a long-term bullish count, but the market is now testing the boundaries of that view. How BTC reacts at this level may define the entire trajectory of 2026. Wave Count Overview: Completing a Major (4) or Something Deeper? Your chart suggests BTC is likely in a Wave (4) corrective phase following a strong impulsive advance from 2022–2024. Price has now retraced deeply into the 0.618–0.786 Fibonacci zone, which often serves as the final stopping point for a Wave (4) low. Key features in the structure: Strong impulsive Waves (i), (ii), (iii), and (iv) are clearly marked within a long-term ascending channel. BTC is retesting the lower boundary of this channel — a historically high-probability support area. A significant Hidden Bullish Divergence is forming on the RSI, reinforcing the idea that momentum to the downside is weakening. These elements together suggest that BTC may be bottoming out, but the market needs to confirm. Critical Support Levels There are two major zones to watch: 1. 0.618–0.786 Retracement Zone (current level) BTC is currently inside this cluster: 0.618 ≈ $91,173 0.786 ≈ $83,459 This area is where Wave (4) corrections often complete. A bounce here could launch the final Wave (5) toward the $140,000–$160,000 region. 2. Long-Term Invalidation Level (~$74,149) You highlighted this line on your chart. If BTC breaks and closes decisively below this level, the long-term bullish Elliott Wave count is invalidated. That would imply the market has entered a larger corrective structure — potentially the start of a multi-month bear phase. Bullish Scenario: Preparing for Wave (5) If BTC holds the bottom of this support cluster and rebounds: Wave (5) could begin from this area Price targets for Wave (5) extend toward $147,000 and higher Hidden bullish divergences strengthen the case for upward reversal RSI is oversold, historically a strong buy signal during corrections This aligns with the idea that BTC is months away from the next major rally. Bearish Scenario: Deeper Correction if Support Breaks If support fails — especially if BTC falls below the $74,149 invalidation line — then: The long-term bullish count is broken BTC may begin a larger ABC or W-X-Y correction Price could revisit the broad bear market box you highlighted near $26,000–$32,000 Macro sentiment across crypto would likely deteriorate sharply This would shift the narrative from “Wave (4) ending” to “Cycle correction in progress”. Conclusion: BTC at a Major Decision Point Bitcoin is entering a highly sensitive region technically: Hold support → Begin Wave (5) toward new all-time highs Lose support → Revisit lower macro levels before the next cycle begins Right now, the evidence leans bullish — RSI divergence, channel support, and Fibonacci alignment — but the invalidation level cannot be ignored. BTC is likely close to a major bottom, but one final sweep lower remains possible before the next major uptrend begins.Additional Note on the Invalidation Level If price moves below the invalidation area, this would confirm that Bitcoin has entered a bear market structure rather than a Wave (4) correction. In that scenario, the next probable targets would be the large demand box highlighted on the chart, representing the deeper retracement zone where BTC may eventually find macro support.
Kap_Waves
CRYPTO: ETHERIUM (H1)
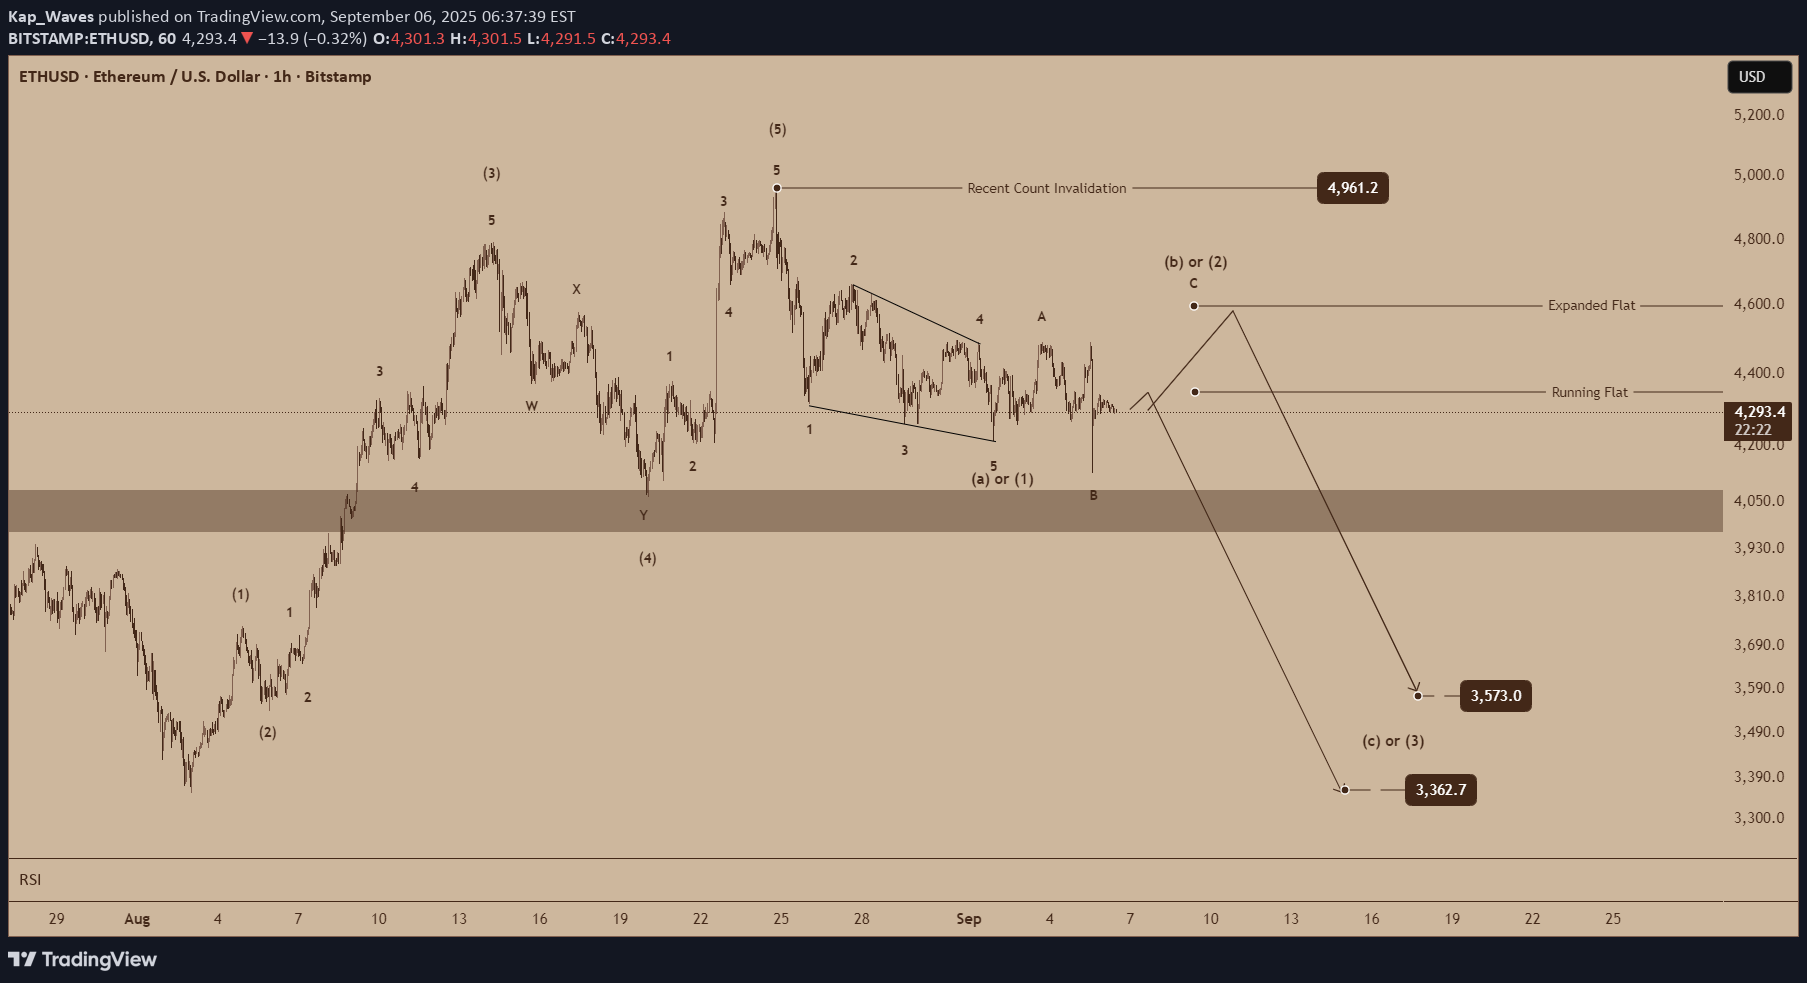
ETHUSD Wave Count: - The larger impulse (labeled (1) → (5)) appears complete, with the top marked at wave (5). - Current structure is unfolding as a corrective pattern following the top. - Subwaves labeled (a) or (1), B, and C suggest that the market is now in a decisive corrective phase. There are two potential corrective scenarios being tracked: 1. Expanded Flat / Running Flat correction. 2. Impulse move down unfolding as wave (3). Targets: Upside (retracement / correction before continuation): - 4,400 – 4,600 USD (Expanded Flat target zone). - 4,961.2 USD is marked as the Recent Count Invalidation level – any move above here would invalidate the current bearish count. Downside (continuation of correction / start of larger wave (3)): - 3,573.0 USD – first bearish target (wave (c) or (3)). - 3,362.7 USD – extended bearish target if downside momentum accelerates.
Kap_Waves
CRYPTO: LUMIA (1D)
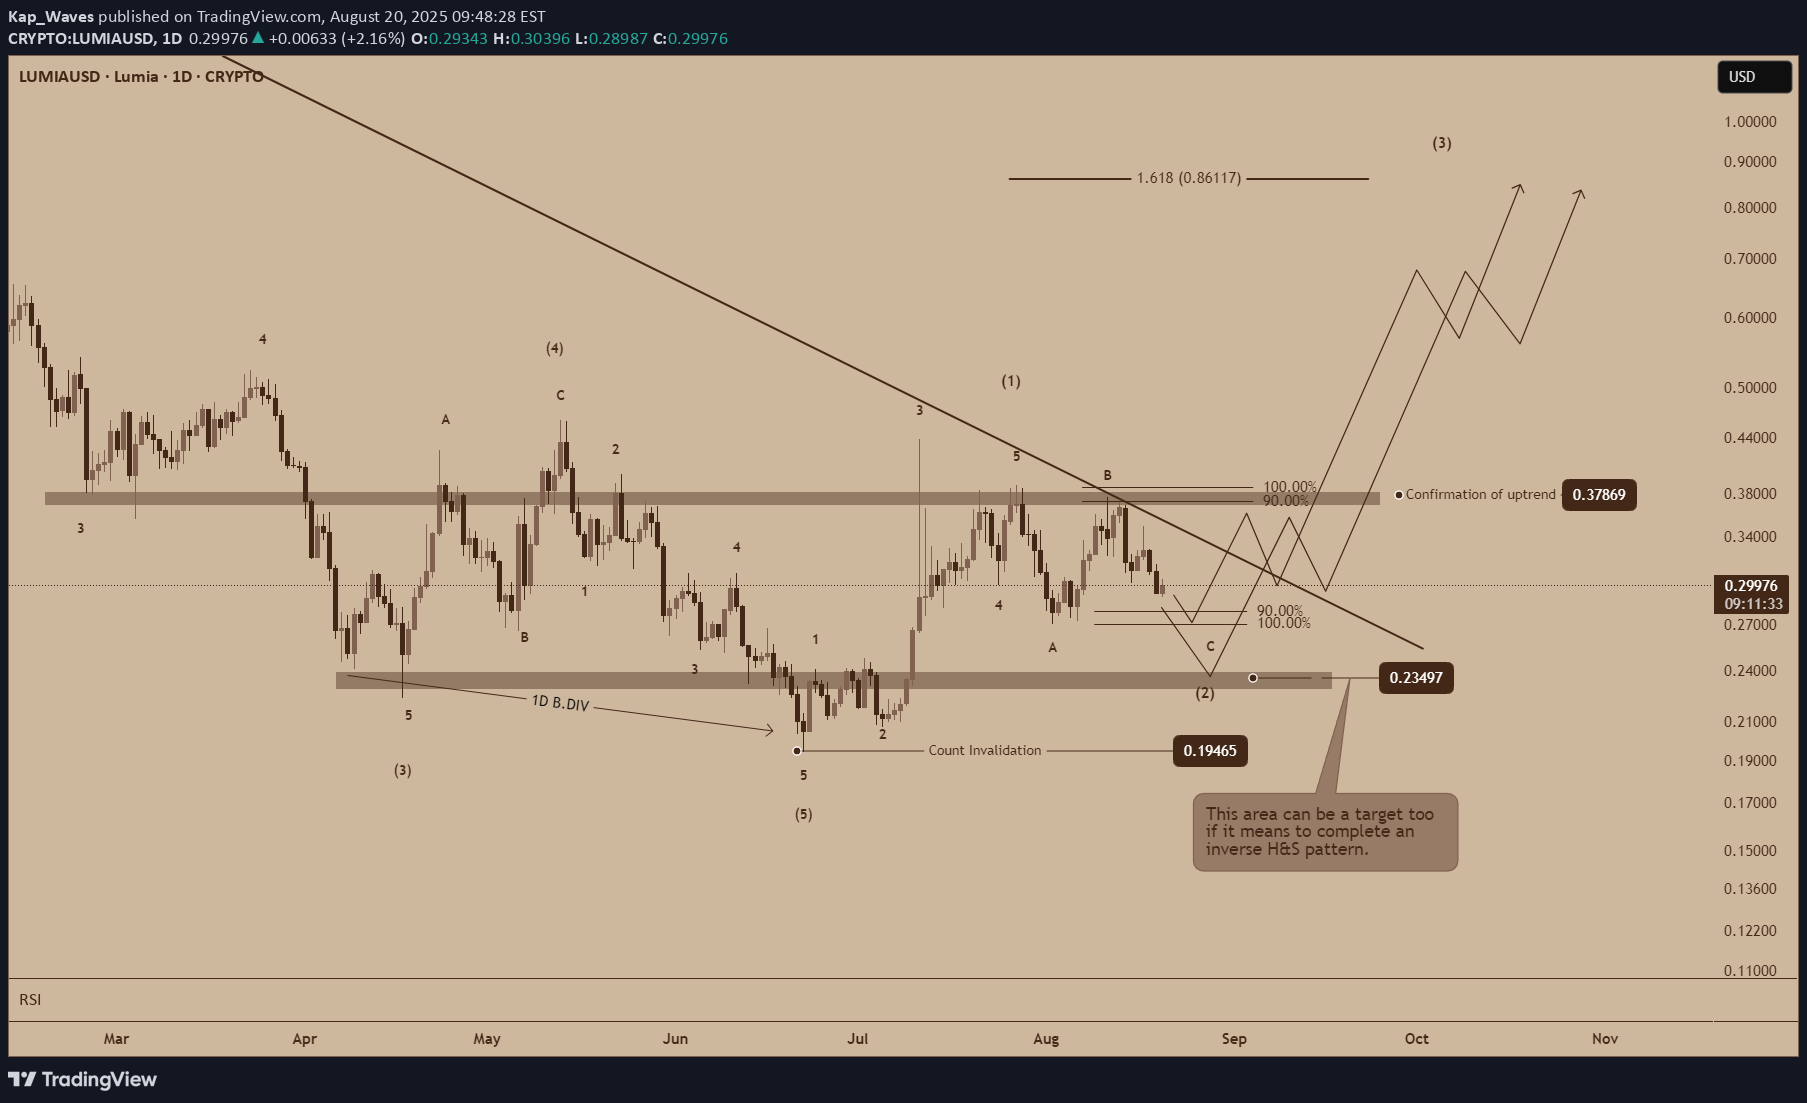
Following a request to do an analysis of LUMIAUSD , here are my thoughts: This chart is looking good for now. It is currently completing wave C of (2), a regular flat corrective variation. To confirm this idea, there should be a break a major trendline. To strengthen it more, a break of resistance will mean an uptrend with potential targets reaching 0.86. If it doesn't turn out to be a regular flat variation, there is a target below to hit the resistance at around 0.234. This case would mean a potential completion of an inverse H&S pattern potentially hitting targets slightly lower than the plotted target (0.86). Once this count gets invalidated (break the low of 0.194), there would be a need to reassess this outlook. For now, these are the cases for me.Note: For proper plotting of waves, in the line chart, my wave 3 of (1) should be at high where wave 4 of (1) begins. :))
Kap_Waves
CRYPTO: SOLANA (1D)
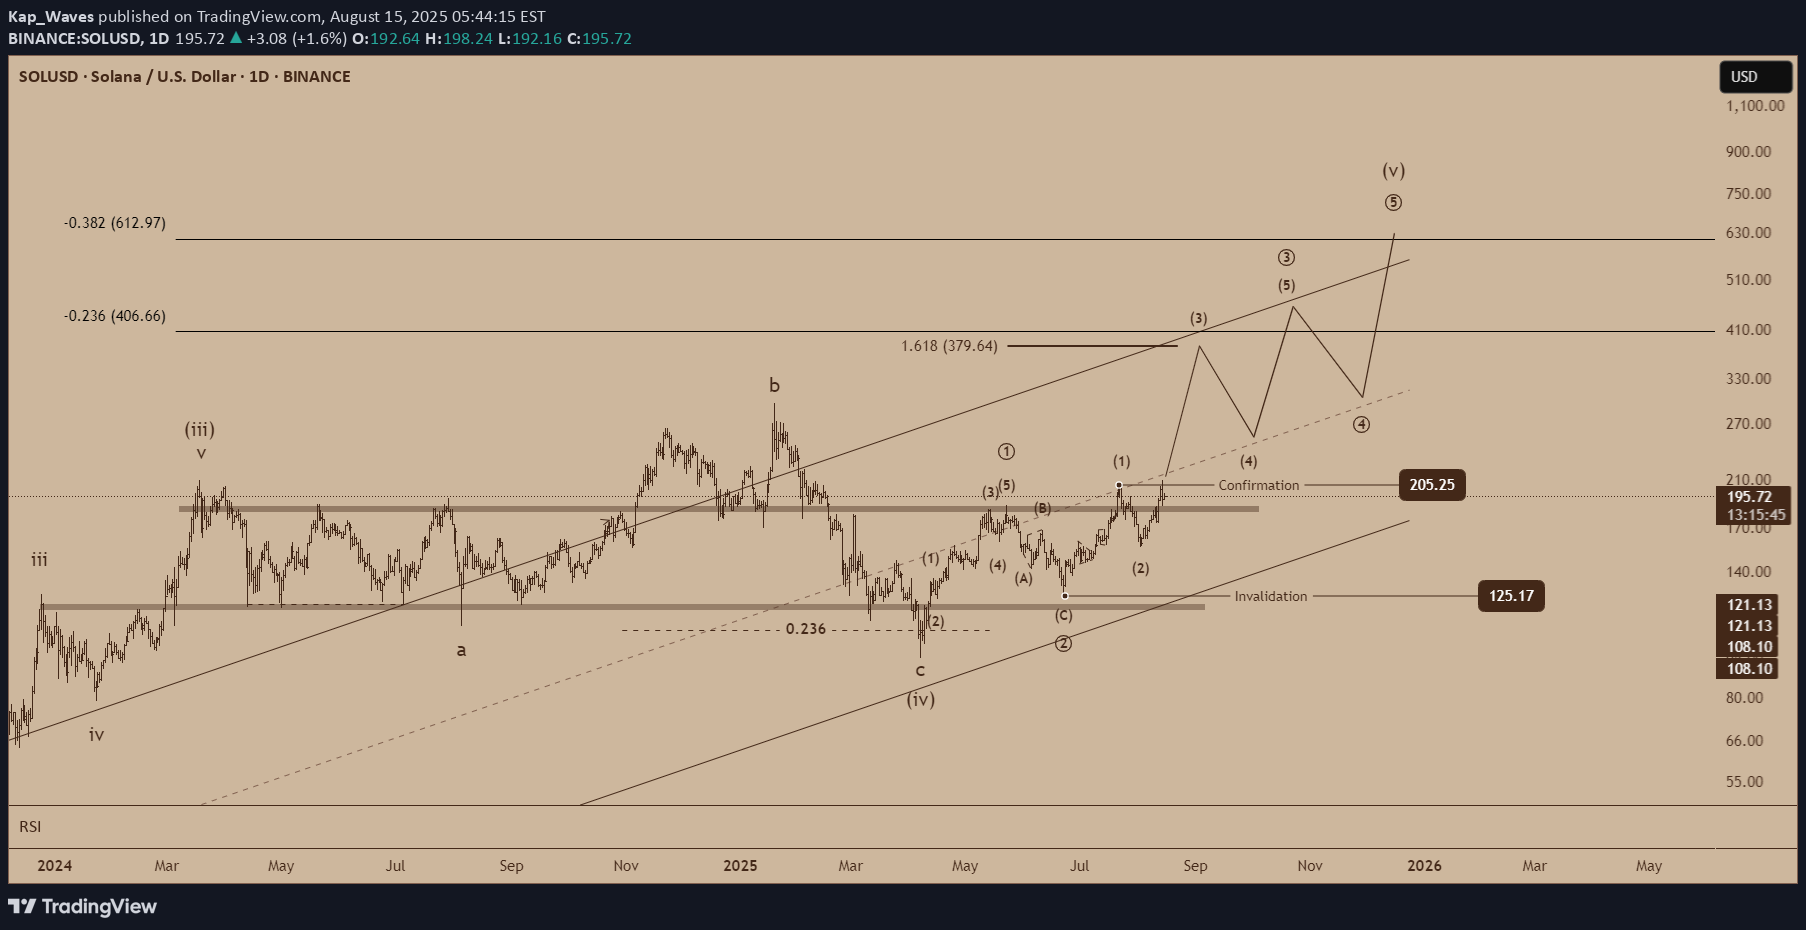
Looking at Solana, I am still seeing a massive upside potential. According to my analysis, Solana is looking to complete wave (3) of wave 3 (circled). Once a clear wave 1 and 2 structure is formed within wave (3), then I can safely say that Solana will still push upwards. Potential target for end of wave (3) of wave 3 (circled) = $379 Cycle target = $406 to $612 Invalidation = $125
Disclaimer
Any content and materials included in Sahmeto's website and official communication channels are a compilation of personal opinions and analyses and are not binding. They do not constitute any recommendation for buying, selling, entering or exiting the stock market and cryptocurrency market. Also, all news and analyses included in the website and channels are merely republished information from official and unofficial domestic and foreign sources, and it is obvious that users of the said content are responsible for following up and ensuring the authenticity and accuracy of the materials. Therefore, while disclaiming responsibility, it is declared that the responsibility for any decision-making, action, and potential profit and loss in the capital market and cryptocurrency market lies with the trader.