Technical analysis by Kap_Waves about Symbol LUMIA on 8/20/2025

Kap_Waves
CRYPTO: LUMIA (1D)
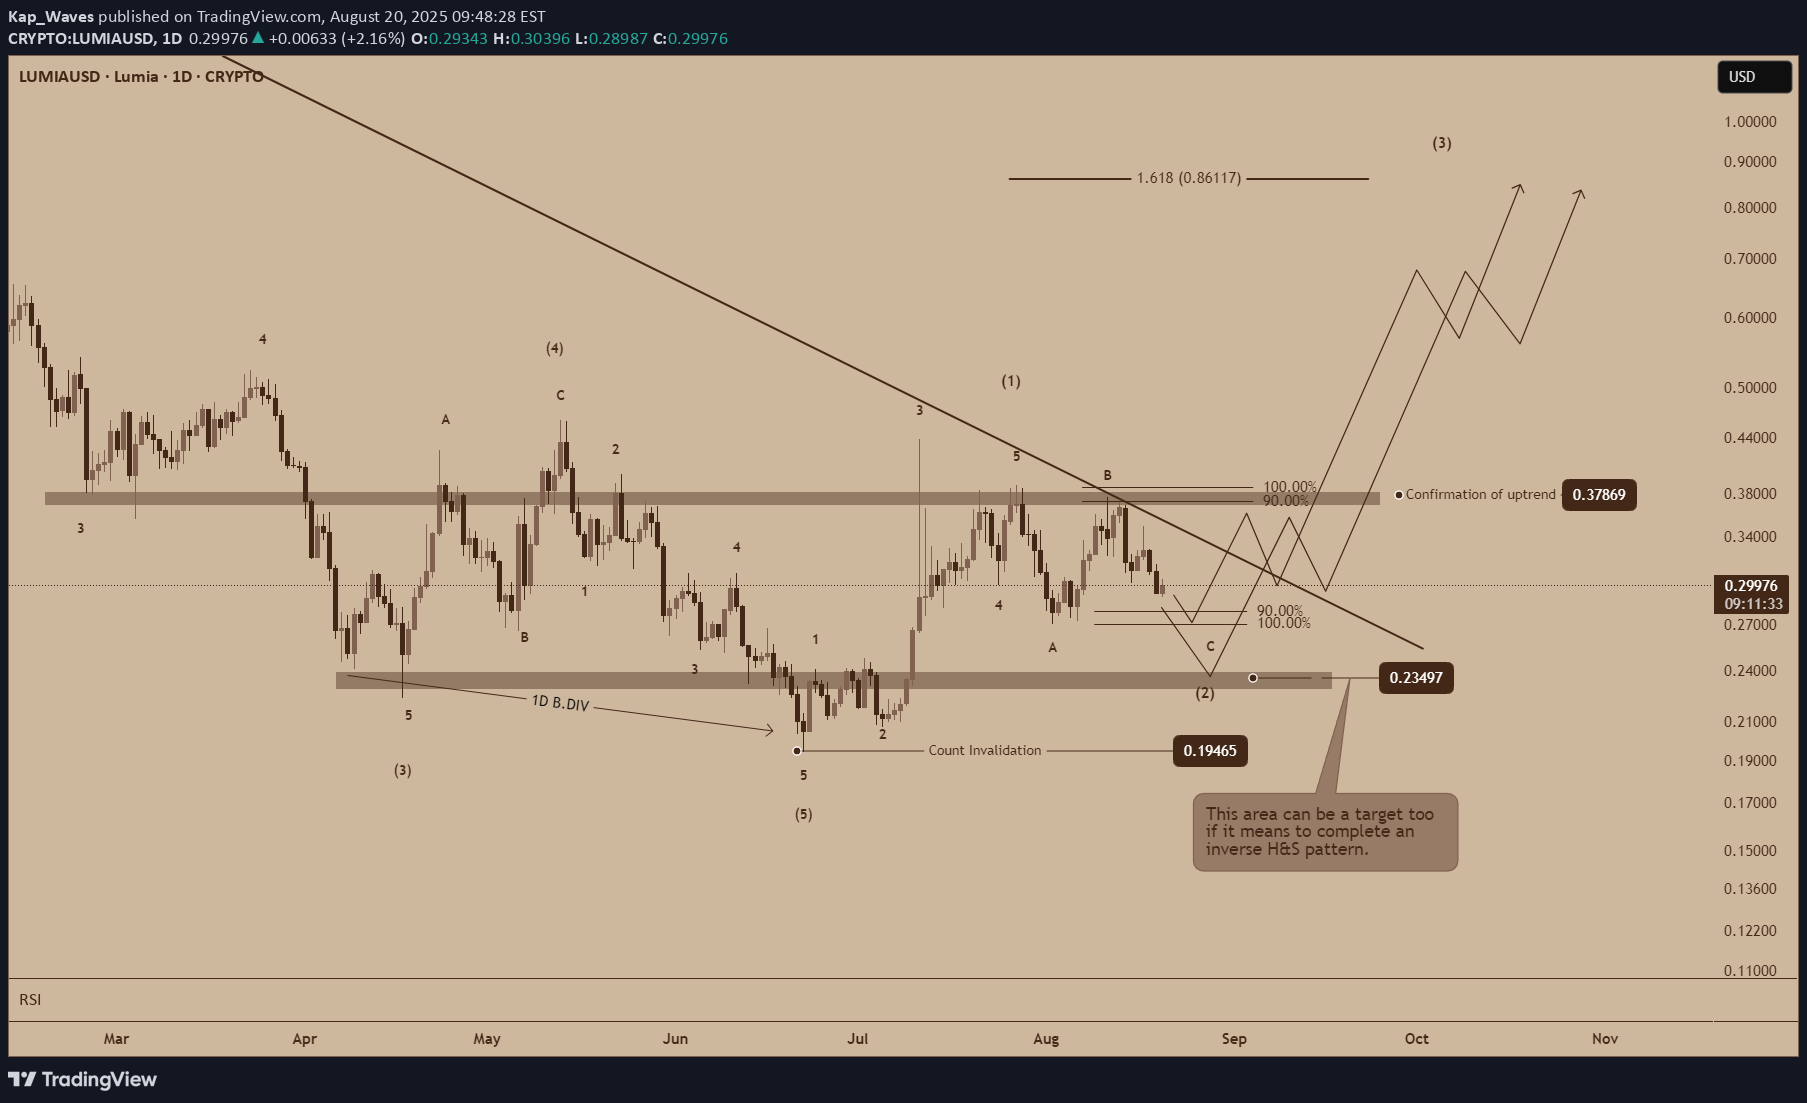
Following a request to do an analysis of LUMIAUSD , here are my thoughts: This chart is looking good for now. It is currently completing wave C of (2), a regular flat corrective variation. To confirm this idea, there should be a break a major trendline. To strengthen it more, a break of resistance will mean an uptrend with potential targets reaching 0.86. If it doesn't turn out to be a regular flat variation, there is a target below to hit the resistance at around 0.234. This case would mean a potential completion of an inverse H&S pattern potentially hitting targets slightly lower than the plotted target (0.86). Once this count gets invalidated (break the low of 0.194), there would be a need to reassess this outlook. For now, these are the cases for me.Note: For proper plotting of waves, in the line chart, my wave 3 of (1) should be at high where wave 4 of (1) begins. :))