Technical analysis by Kap_Waves about Symbol BTC on 11/20/2025

Kap_Waves
تحلیل موج الیوت بیت کوین: نقطه تصمیم حیاتی در آستانه حمایت بلندمدت!
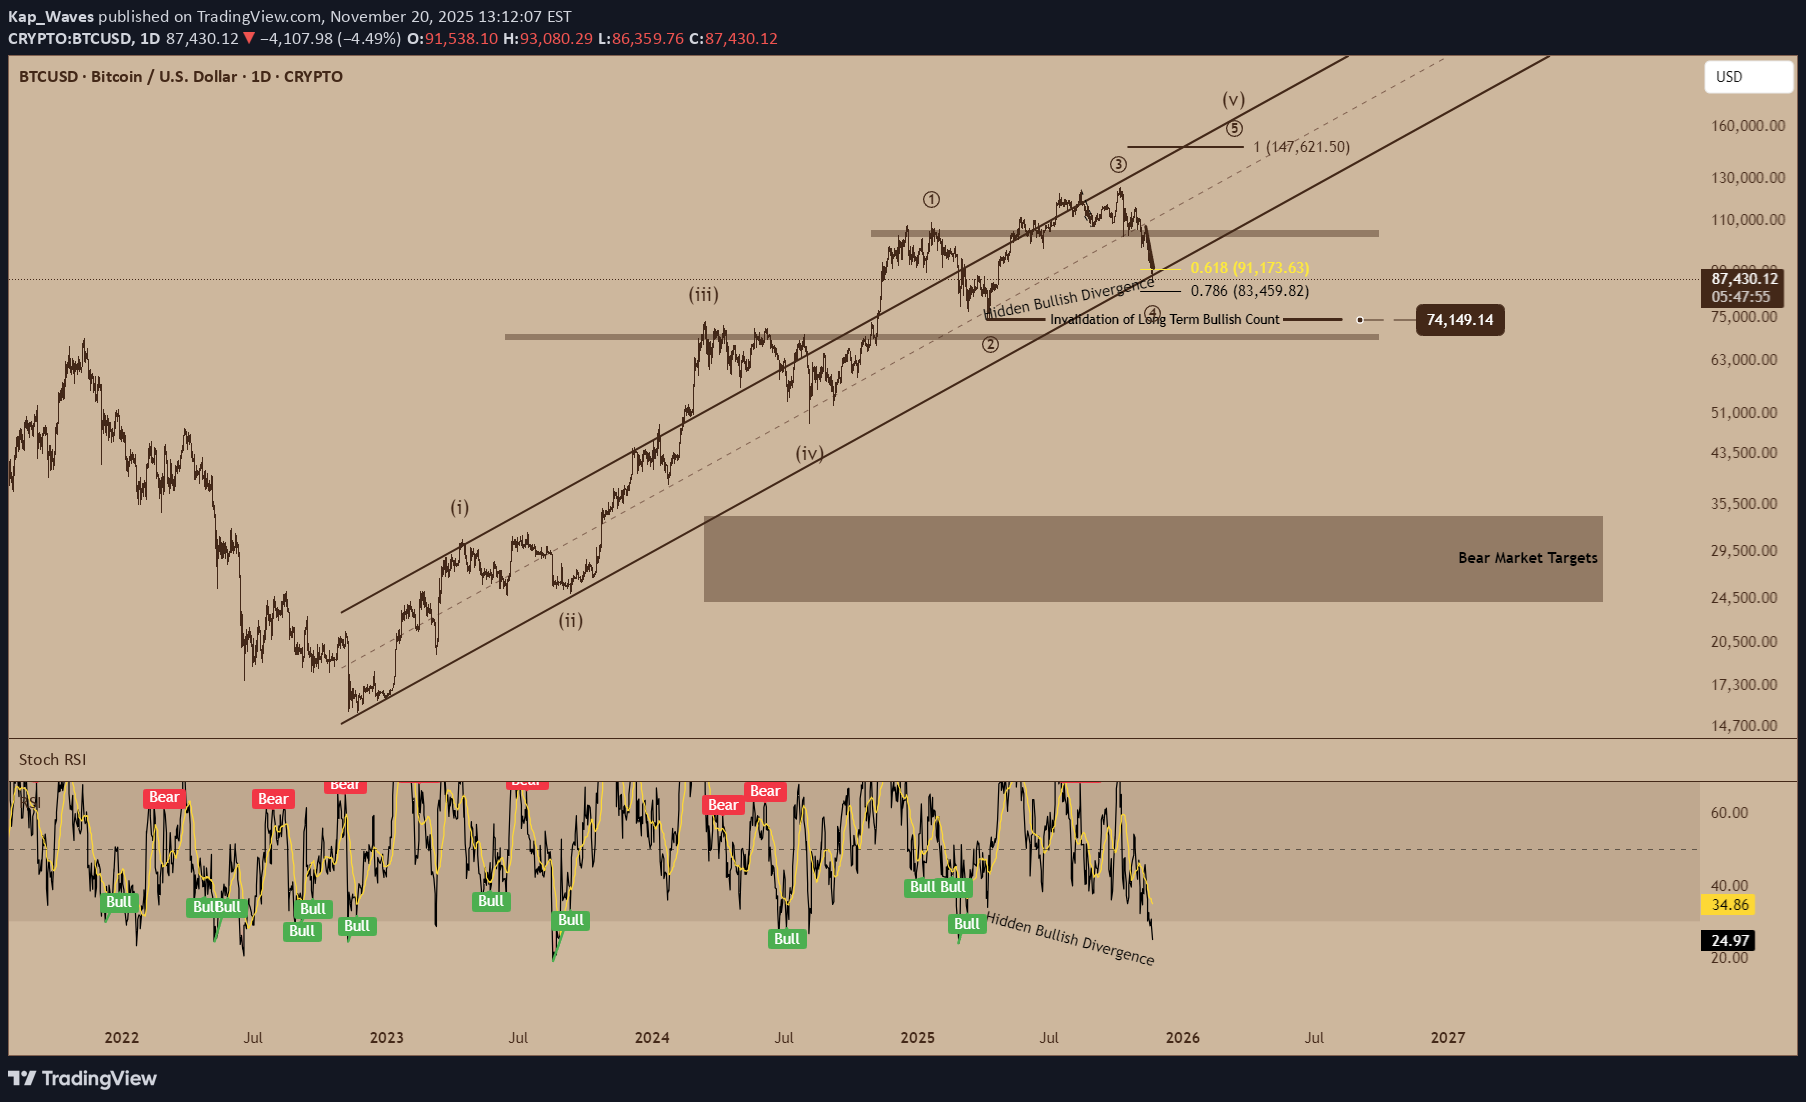
Bitcoin Elliott Wave Analysis: Critical Decision Zone as BTC Tests Long-Term Support Bitcoin is approaching one of the most important support levels in its current Elliott Wave cycle. The broader technical picture still supports a long-term bullish count, but the market is now testing the boundaries of that view. How BTC reacts at this level may define the entire trajectory of 2026. Wave Count Overview: Completing a Major (4) or Something Deeper? Your chart suggests BTC is likely in a Wave (4) corrective phase following a strong impulsive advance from 2022–2024. Price has now retraced deeply into the 0.618–0.786 Fibonacci zone, which often serves as the final stopping point for a Wave (4) low. Key features in the structure: Strong impulsive Waves (i), (ii), (iii), and (iv) are clearly marked within a long-term ascending channel. BTC is retesting the lower boundary of this channel — a historically high-probability support area. A significant Hidden Bullish Divergence is forming on the RSI, reinforcing the idea that momentum to the downside is weakening. These elements together suggest that BTC may be bottoming out, but the market needs to confirm. Critical Support Levels There are two major zones to watch: 1. 0.618–0.786 Retracement Zone (current level) BTC is currently inside this cluster: 0.618 ≈ $91,173 0.786 ≈ $83,459 This area is where Wave (4) corrections often complete. A bounce here could launch the final Wave (5) toward the $140,000–$160,000 region. 2. Long-Term Invalidation Level (~$74,149) You highlighted this line on your chart. If BTC breaks and closes decisively below this level, the long-term bullish Elliott Wave count is invalidated. That would imply the market has entered a larger corrective structure — potentially the start of a multi-month bear phase. Bullish Scenario: Preparing for Wave (5) If BTC holds the bottom of this support cluster and rebounds: Wave (5) could begin from this area Price targets for Wave (5) extend toward $147,000 and higher Hidden bullish divergences strengthen the case for upward reversal RSI is oversold, historically a strong buy signal during corrections This aligns with the idea that BTC is months away from the next major rally. Bearish Scenario: Deeper Correction if Support Breaks If support fails — especially if BTC falls below the $74,149 invalidation line — then: The long-term bullish count is broken BTC may begin a larger ABC or W-X-Y correction Price could revisit the broad bear market box you highlighted near $26,000–$32,000 Macro sentiment across crypto would likely deteriorate sharply This would shift the narrative from “Wave (4) ending” to “Cycle correction in progress”. Conclusion: BTC at a Major Decision Point Bitcoin is entering a highly sensitive region technically: Hold support → Begin Wave (5) toward new all-time highs Lose support → Revisit lower macro levels before the next cycle begins Right now, the evidence leans bullish — RSI divergence, channel support, and Fibonacci alignment — but the invalidation level cannot be ignored. BTC is likely close to a major bottom, but one final sweep lower remains possible before the next major uptrend begins.Additional Note on the Invalidation Level If price moves below the invalidation area, this would confirm that Bitcoin has entered a bear market structure rather than a Wave (4) correction. In that scenario, the next probable targets would be the large demand box highlighted on the chart, representing the deeper retracement zone where BTC may eventually find macro support.