
JustaTechGuy
@t_JustaTechGuy

What symbols does the trader recommend buying?
Purchase History
پیام های تریدر
Filter
JustaTechGuy
Possible Double bullish flag for #SOL
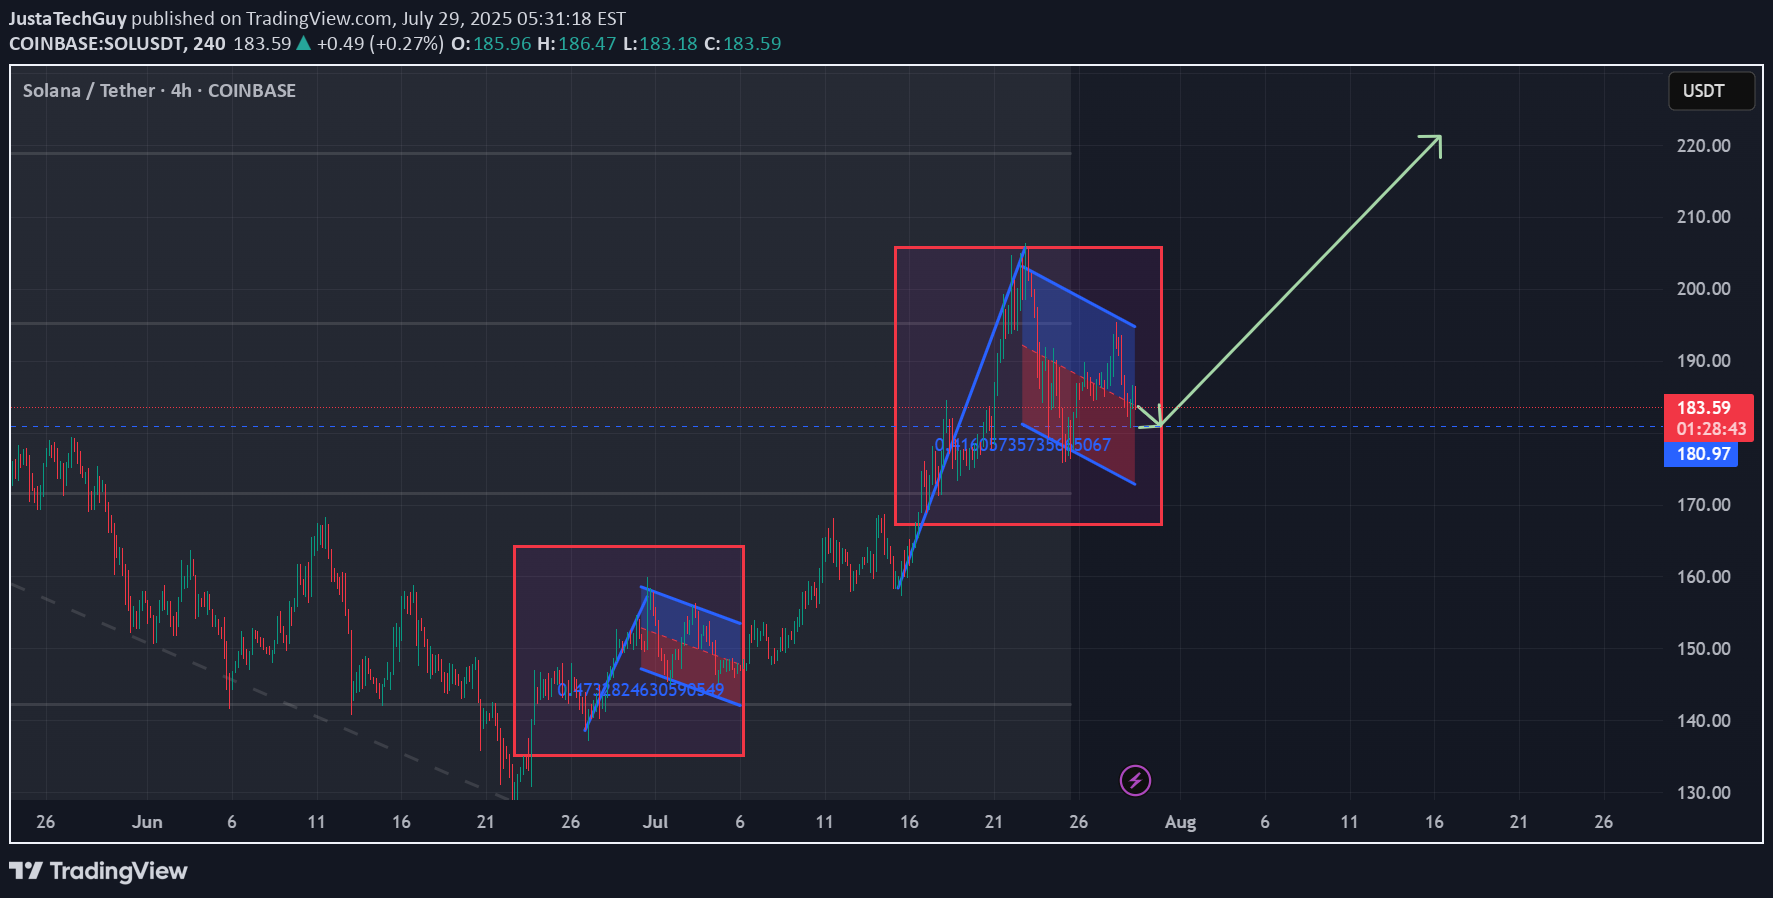
There is a world where SOL is confirming this double bullish flag setup for New Higher Highs...Let's wait and see. It needs to hold the 179 -178 line and keep and eye on Volume for a healthy push until the next Fibo level around 220. The only pb is August has always been a bad month for crypto in gnl. Trade carrefully ! Educational content onlyAlso we need to consider the token release of this week and see how the price does reactSeveral billions of leverage positions liquidated a few minutes ago
JustaTechGuy
H&S Expected for Sol And Pyth until HHs
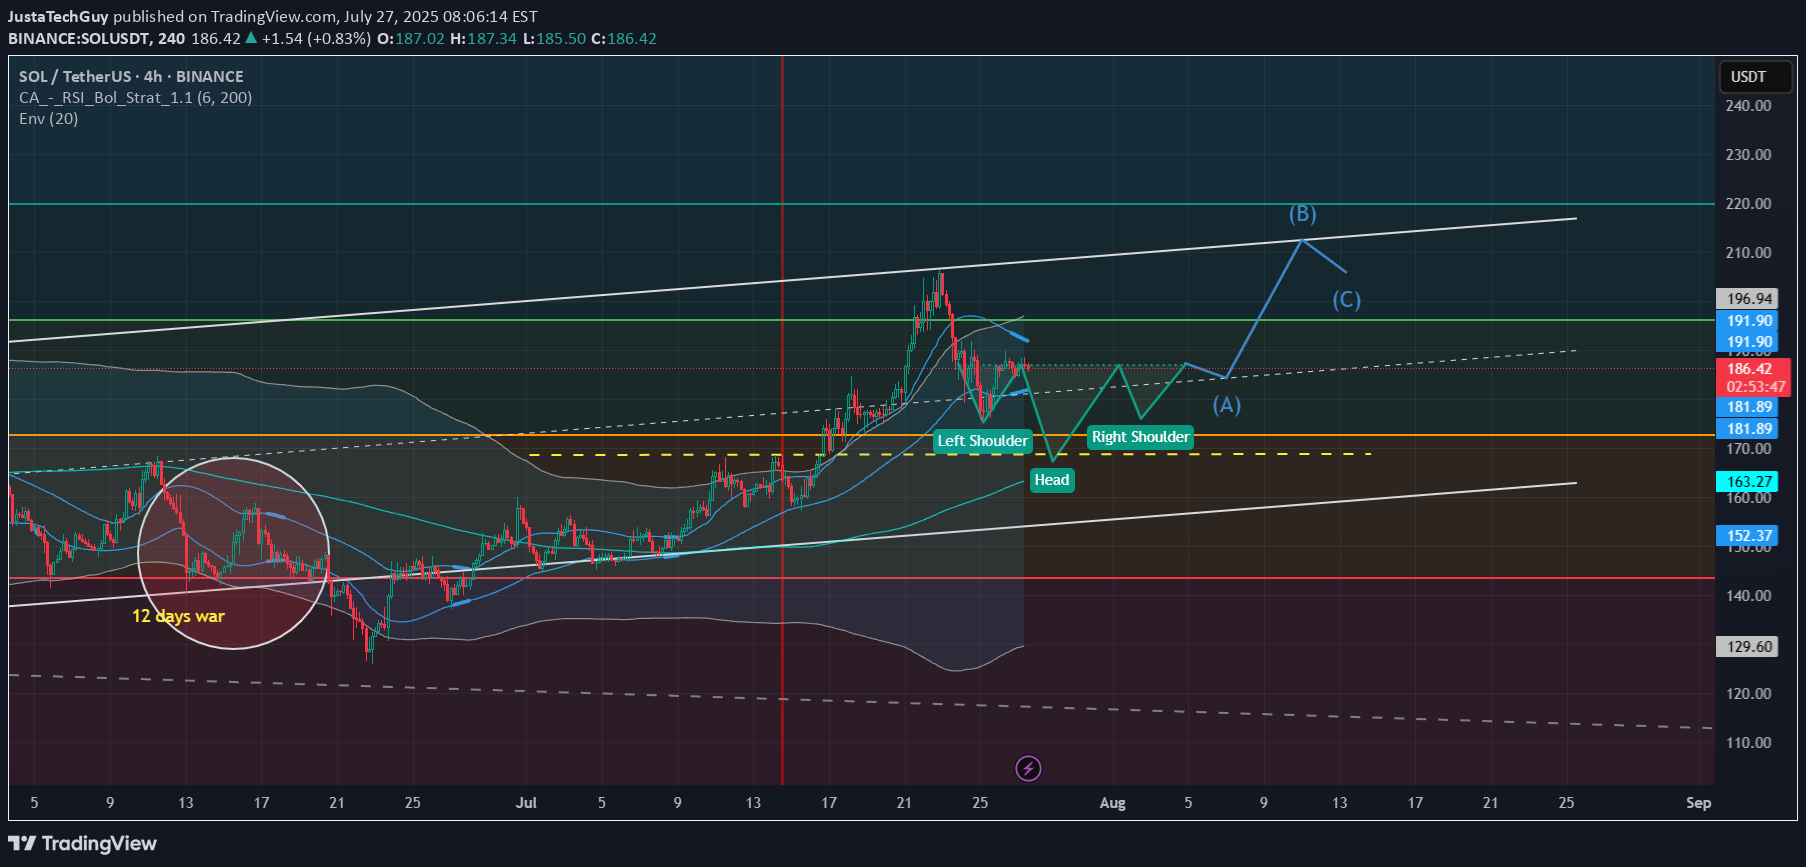
Pyth is following SOL and I expect a bit of a pullback for a better impusle to reach Higher Highs. Technicals (RSI, Bollinger band) are showing overbought conditions and we can expect the usual End of months pullback. The pullback could reach the 168 - 170 Area before coming back to the current levels and after a potential light pullback to grab liquity and to create a new contraction before a new push toward 210 - 212 is expected. This idea is only for educational content, please Do your own research before investing.
JustaTechGuy
HARMONIC PATTERN on Daily for SOL ?
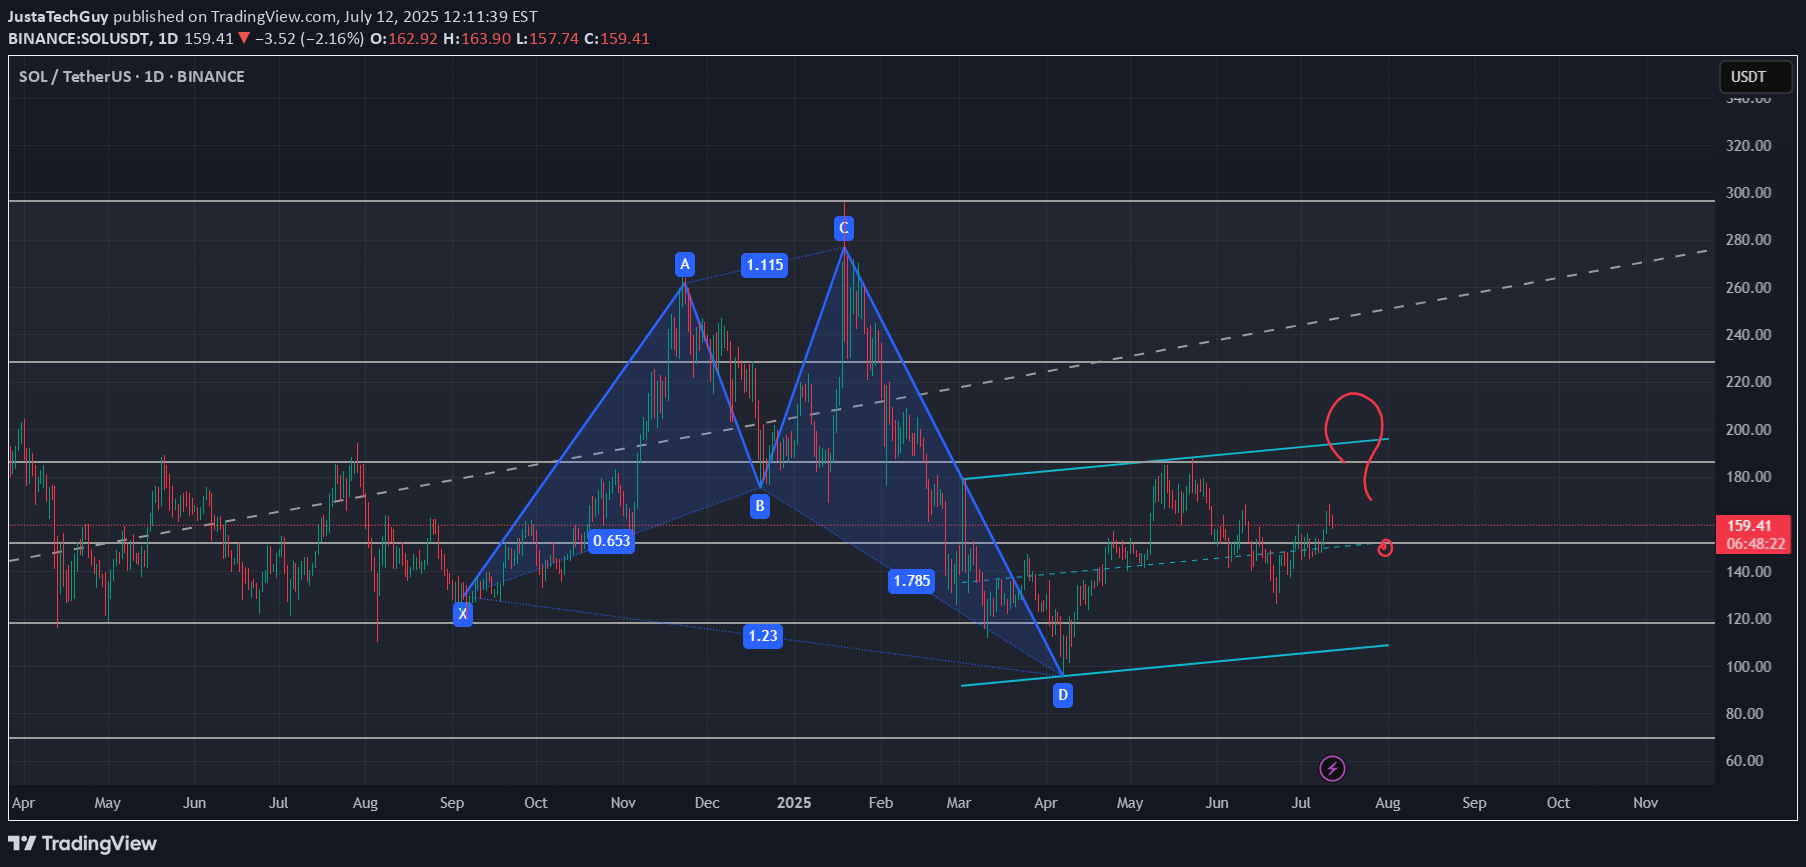
I wonder if this pattern is the one which is highlighted by our friend and chart analyst The_Alchemist_Trader_ Let's see if it need to test one last time the support of this channel or if it will break out for the long waited rally. Level to keep an eye : 0.5 Fib support need to hold and clean breakout of the 0.382 Fib Indicators : RSI, volume and volatility (liquidations)If it's a bullish one, it should continue until the upper wing around 275 usd before a sharp pull back to cool down
JustaTechGuy
Inverted head and shoulder suspected ..keep an eye on neckline
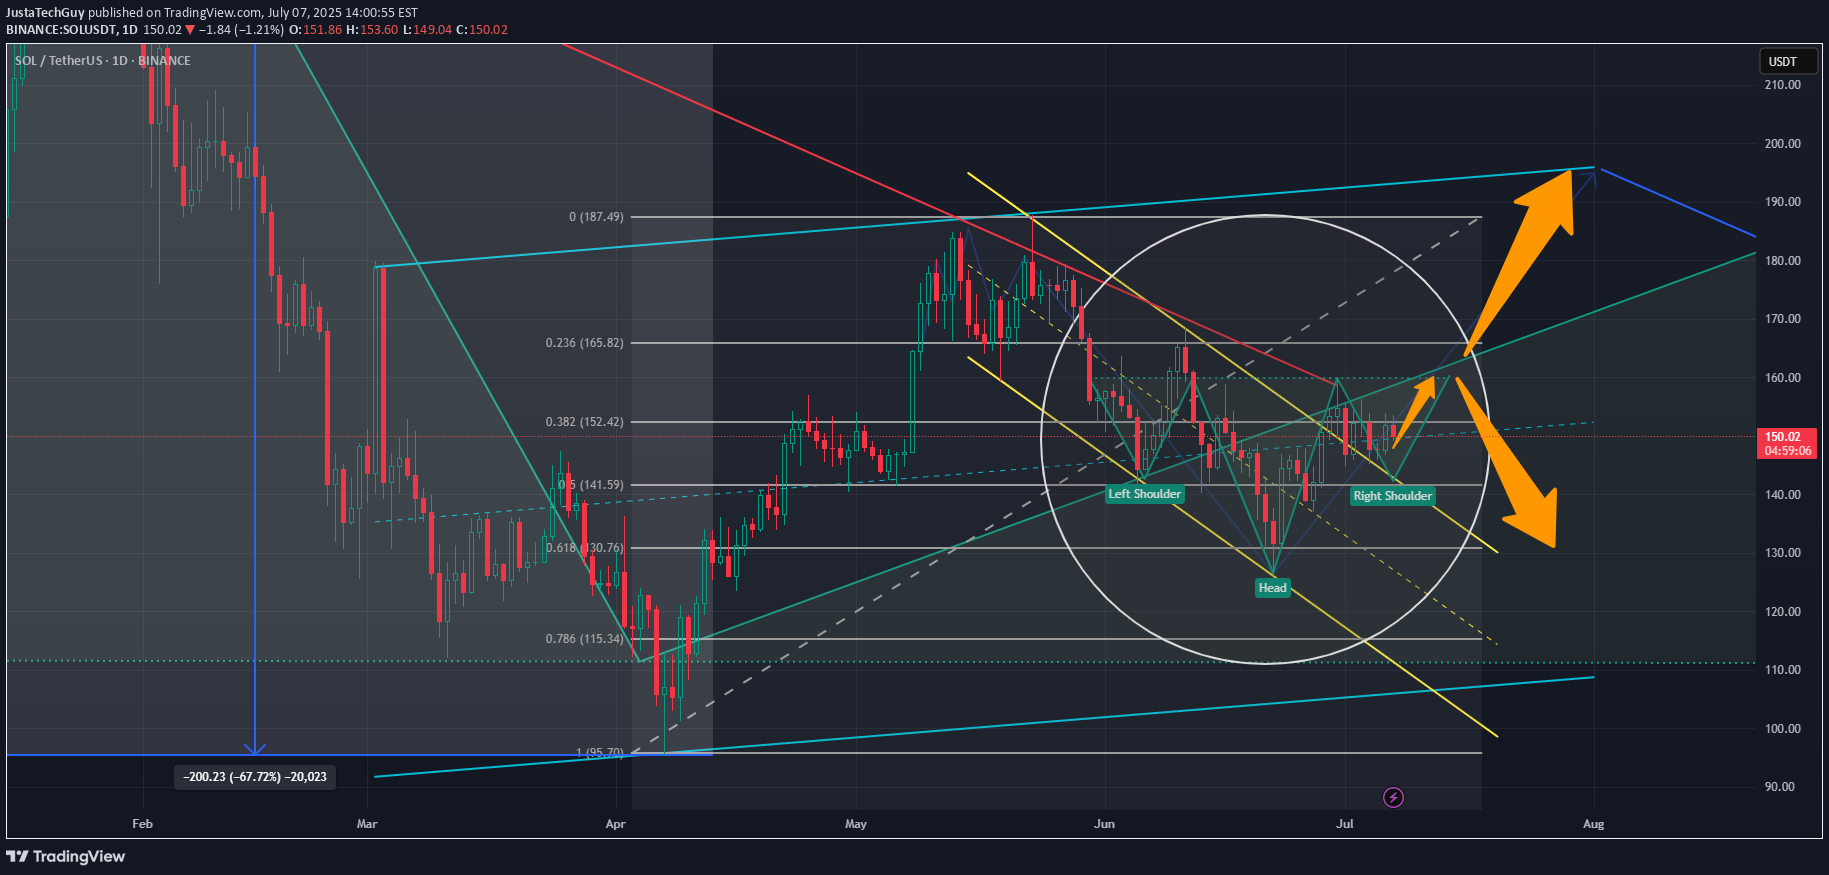
Hi dear friends and followers, I suspect this inverted head and shoulders pattern with a neckline around 160 usd. If it breaks in, it can go down toward the inferior support level around 130 usd and the 0.618 Fibo. If it breaks out it can go up until the next resistance and psychological level of 200 usd. As you can see, this 200usd resistance level does match with a large ascending channel. You all need to DYOR and keep an eye on RSI and volume to confirm the movement and take a trade. Wishing you the best and success on your decision.Neckline reached, resistance is about to be tested, let's see...Trade closed, target reached arount 184 usd which approximatively the lenght of the pattern
JustaTechGuy
Wedge broken > Short expected until support zone around 152usd

Hello Folks.As you can see, the descending channel has been broken, There is world where we can expect a short until the next support zone around 150 - 153 USD and a possibl recoveryTrade with cautionRegards
JustaTechGuy
Quick Short expected until reaching the support area

Hi Family. Here is a quick Short expectation from my perspective, until reaching the support area arount 165-164.Please trade carefully using stop lossBig up, no financial advice ! Make your own decision and risk managementTarget reached successfully Trade closed !
JustaTechGuy
XRP correction incoming ? Neckline will not hodl

the neckline will not hold and will probably make XRP return to it's previous support around 1.60usd. Feel free to comment <<
JustaTechGuy
Solana head and Shoulders ?

This pattern need to be confirmed by the second shoulder, then keep an eye on the volume, the RSI and the pattern neck line to take a trade and aim for position to TP
JustaTechGuy
#Pyth near of a decision moment

According to the fibo retracement from the last higher level to the recent lowest, it seems that we are reaching a crucial moment to know if it breaks out or if it continue to follow the descending channel. Stay focused and do your own researches. Not A Financial Advice !We are still following the descending channel. Stay tuned !As we can consider a clear Break of the descending wedge occured.
JustaTechGuy
short term / upcoming breakout 4H

Hey guys ! As you can see, we are still above the EMA20 and a converging triangle is about give a precious information about the incoming trend! Furthermore we can see that this coin is strongly correlated with BTC ! Can't wait to see how it will break !
Disclaimer
Any content and materials included in Sahmeto's website and official communication channels are a compilation of personal opinions and analyses and are not binding. They do not constitute any recommendation for buying, selling, entering or exiting the stock market and cryptocurrency market. Also, all news and analyses included in the website and channels are merely republished information from official and unofficial domestic and foreign sources, and it is obvious that users of the said content are responsible for following up and ensuring the authenticity and accuracy of the materials. Therefore, while disclaiming responsibility, it is declared that the responsibility for any decision-making, action, and potential profit and loss in the capital market and cryptocurrency market lies with the trader.