
Ikeyhan
@t_Ikeyhan

What symbols does the trader recommend buying?
Purchase History
پیام های تریدر
Filter
Signal Type
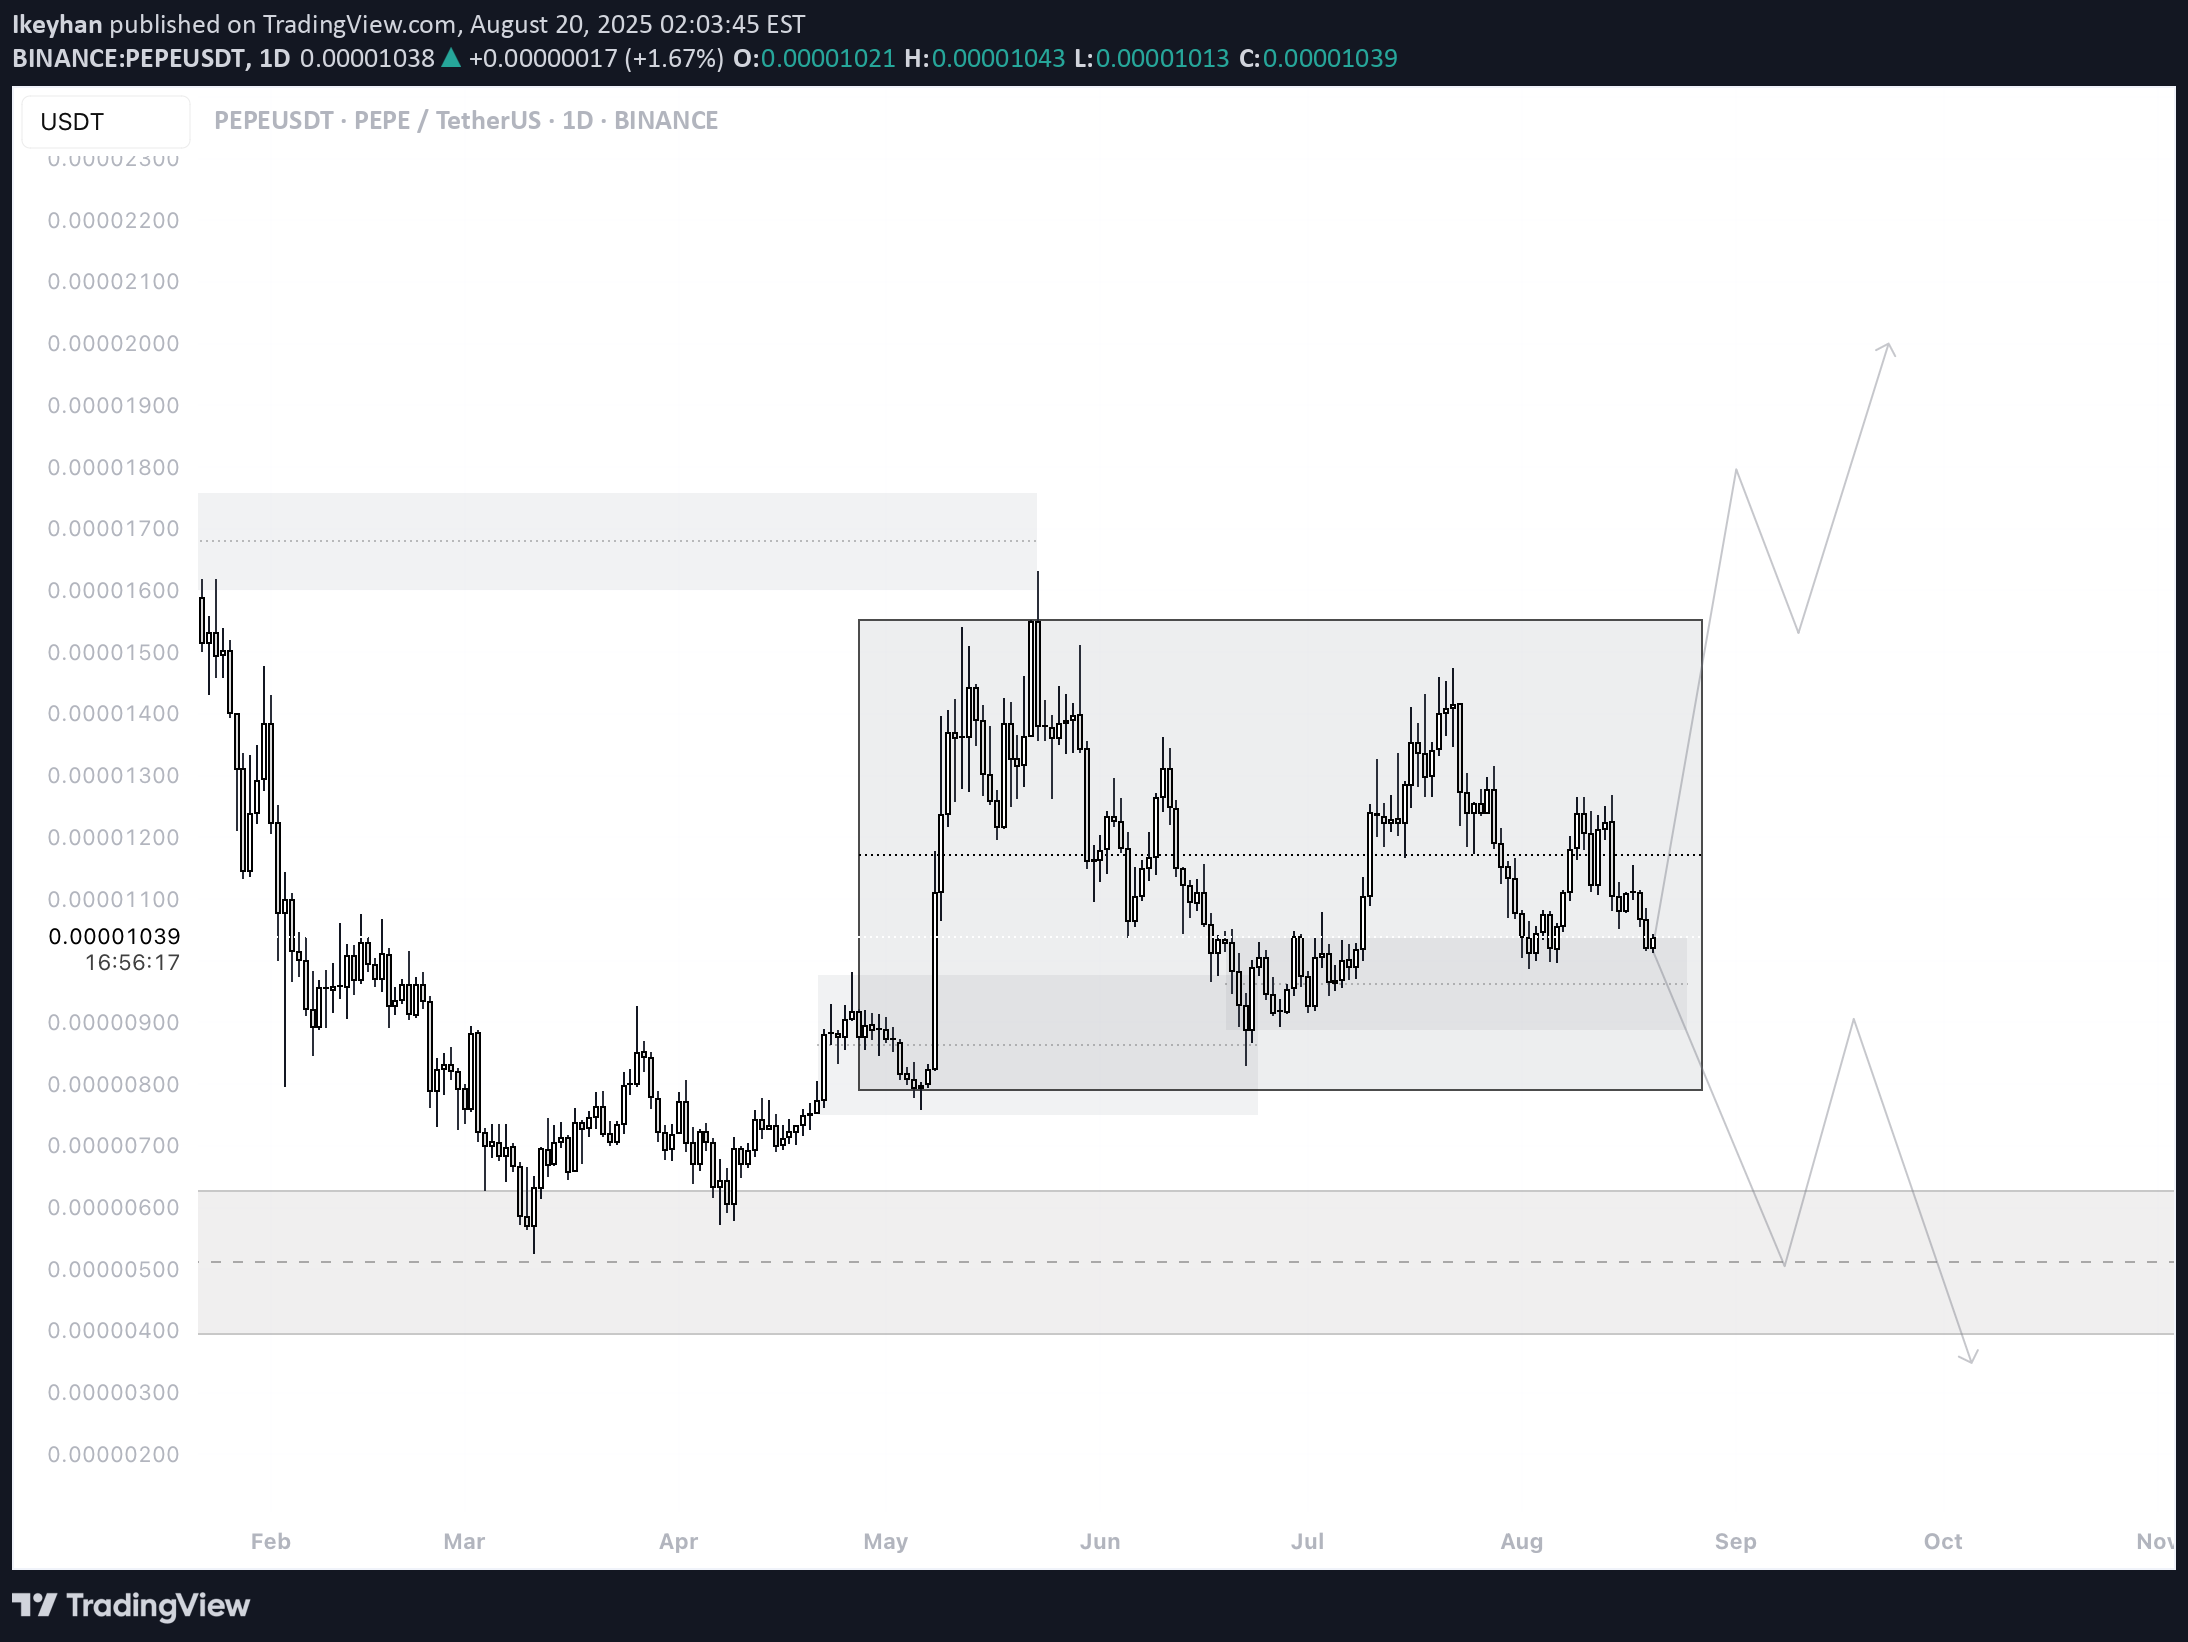
🔎 Chart Context •Pair: PEPE/USDT •Exchange: Binance •Timeframe: 1D (Daily) •Date: 21 August 2025 This chart shows PEPE consolidating inside a wide range after a strong rally earlier in 2025. 📊 Key Observations 1.Macro Structure •After bottoming near 0.000000571 – 0.000000796, PEPE launched a major rally. •Peak reached 0.00001632 in May, followed by distribution and sideways movement. •Since then, price is locked in a consolidation box between ~0.00000830 (support) and ~0.00001475 (resistance). •Current price: 0.00001103, trading mid-lower range. 2.Support & Demand Zones •0.00000986 – 0.00000830 zone: Strong demand within the consolidation box. •0.00000758 – 0.00000571 zone: Deep liquidity & long-term accumulation zone (likely institutional demand). 3.Resistance & Supply Zones •0.00001362 – 0.00001475 zone: Key supply cap inside consolidation. •0.00001632: Major liquidity sweep level, where last distribution happened. •Any breakout above this opens continuation toward 0.000018–0.000020. 4.Liquidity Behavior •Below: liquidity clusters at 0.00000986, 0.00000830, and deeper 0.00000758–0.00000571. •Above: liquidity trapped near 0.00001475 and 0.00001632 highs. •The chart projection shows two scenarios: •Bullish breakout above the box targeting higher liquidity. •Bearish breakdown below 0.00000830, filling lower demand zones. 📈 Bullish Scenario (Preferred if 0.00000986 holds) •Price holds above 0.00000986–0.00000830 support zone. •Reclaims 0.00001200–0.00001300 midrange. •Targets: •TP1: 0.00001362 •TP2: 0.00001475 (range high) •TP3: 0.00001632 liquidity sweep •A daily close above 0.00001632 confirms a fresh bullish leg. 📉 Bearish Scenario (Lower Probability but Risk) •Price fails to hold 0.00000986–0.00000830 support. •Bearish continuation into: •0.00000758 liquidity level •0.00000571 long-term accumulation zone •Breakdown here resets the bullish thesis and could extend toward 0.00000525–0.00000450. ⚡ Trading Plan •Long Setup (Preferred): •Entry: Accumulation around 0.00000986–0.00000830. •TP1: 0.00001362 •TP2: 0.00001475 •TP3: 0.00001632 •Stop: Below 0.00000758 •Short Setup (Risky, only if breakdown confirmed): •Entry: Failed retest of 0.00000986–0.00001000. •TP: 0.00000758 → 0.00000571 •Stop: Above 0.00001160 ✅ Conclusion PEPE/USDT Daily is consolidating between 0.00000830 and 0.00001475 after a strong rally. The bullish scenario is dominant if the 0.00000986–0.00000830 zone holds, targeting 0.00001475 → 0.00001632. A breakdown below 0.00000830 would invalidate the bullish structure and send price to 0.00000758–0.00000571 demand zone.
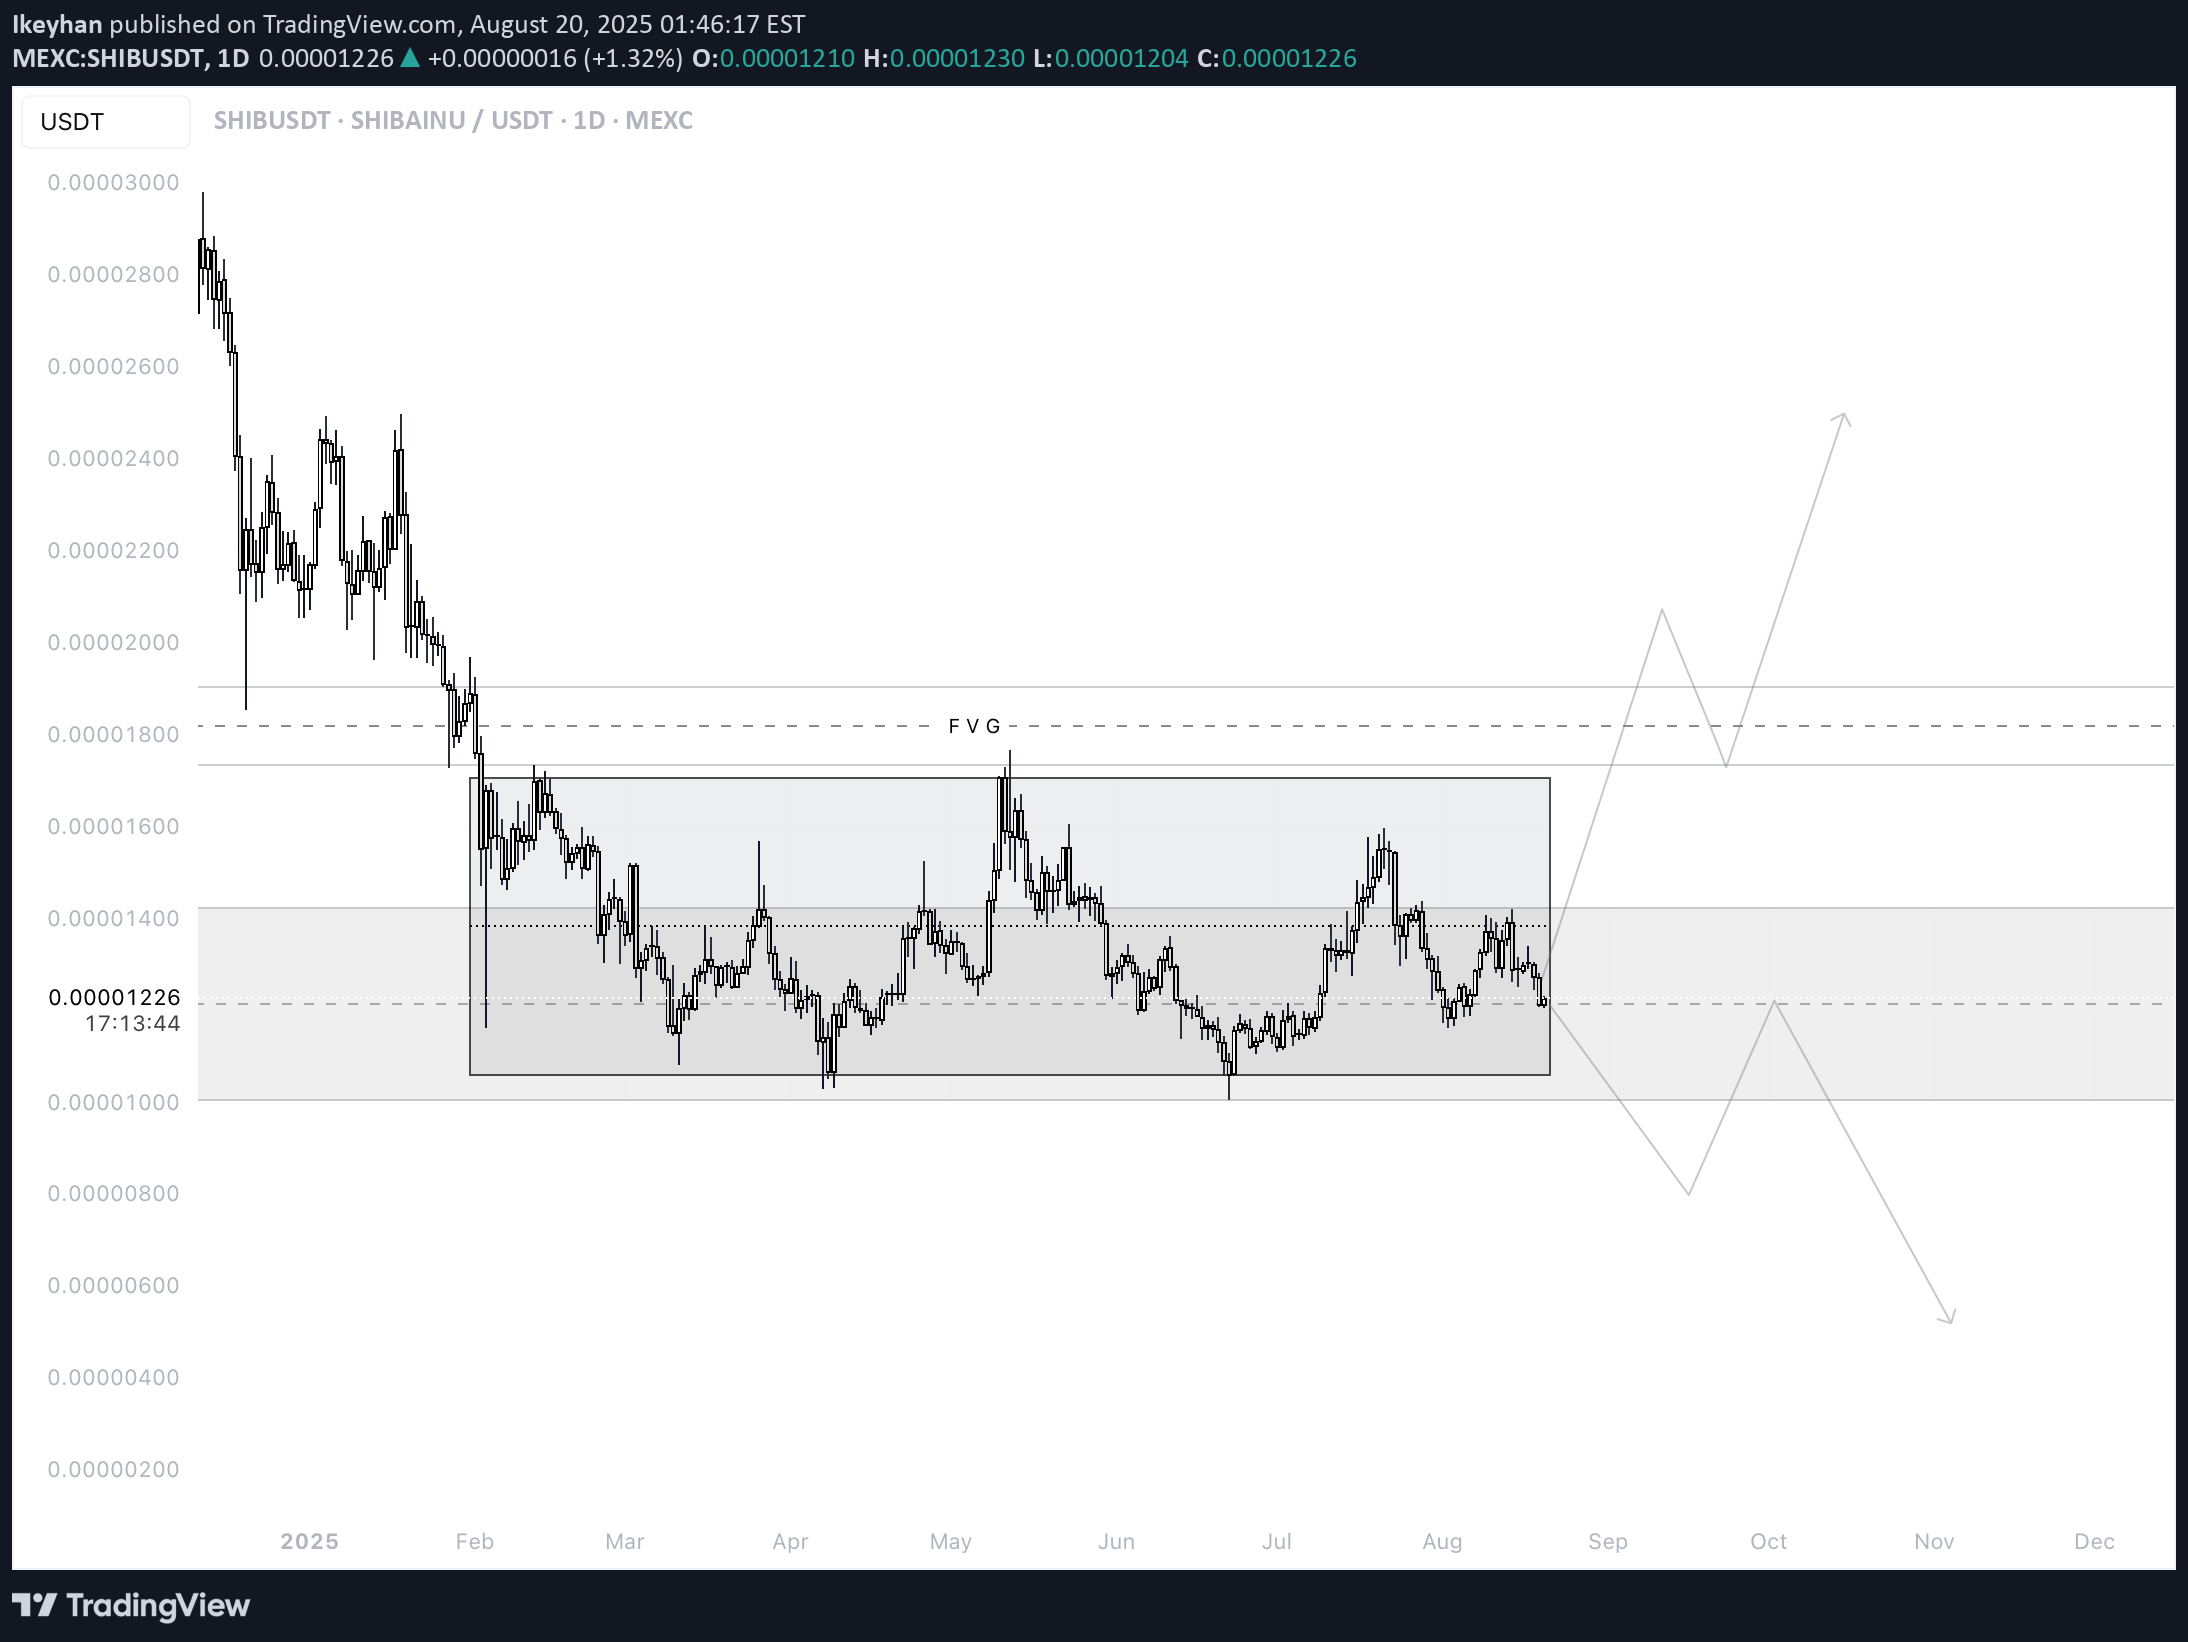
🔎 Chart Context •Pair: SHIB/USDT •Exchange: MEXC •Timeframe: 1D (Daily) •Date: 21 August 2025 This chart shows SHIB trading within a large consolidation range after a significant bearish move earlier in 2025. 📊 Key Observations 1.Macro Structure •SHIB has been in a sideways range between 0.00001000 (support) and 0.00001597 (resistance) since March 2025. •The chart highlights this rectangular range, showing repeated liquidity sweeps on both sides. •Current price: ~0.00001283, sitting in the lower half of the range. 2.Support Zones •0.00001160 – 0.00001080 zone: Main demand block, tested multiple times (April, July). •0.00001004 – 0.00001028: Deeper liquidity sweep levels; losing this zone risks breakdown. •These zones are critical for SHIB’s bullish survival. 3.Resistance Zones •0.00001362 – 0.00001597 zone: Upper supply boundary of the consolidation. •0.00001765 (FVG): Marked upside liquidity gap; a breakout from range would likely target this. •Beyond that, 0.00001853 – 0.00002000 is the next strong supply zone. 4.Liquidity Behavior •Below: resting liquidity around 0.00001160 and 0.00001004. •Above: liquidity pools at 0.00001597 and 0.00001765, making these the primary bullish targets. •The chart projects both scenarios: •Bullish breakout above the range toward 0.00001765. •Bearish breakdown below 0.00001160 toward 0.00001004 or lower. 📈 Bullish Scenario (Higher Probability if 0.00001160 holds) •SHIB defends 0.00001160 demand and reclaims 0.00001362 mid-range resistance. •Momentum carries price to: •TP1: 0.00001597 (range high) •TP2: 0.00001765 (FVG fill / liquidity sweep) •TP3 (extension): 0.00001850 – 0.00002000 major supply zone. •This requires holding above 0.00001160 and rejecting downside liquidity sweeps. 📉 Bearish Scenario (Lower Probability but Risk) •Price loses 0.00001160 demand with strong volume. •Next targets: •0.00001080 → 0.00001028 (short-term supports) •0.00001004 liquidity sweep (major downside magnet) •A daily close below 0.00001000 confirms a macro bearish breakdown, exposing 0.00000900 and below. ⚡ Trading Plan •Long Setup (Preferred if support holds): •Entry: 0.00001160 – 0.00001230 demand zone. •TP1: 0.00001362 •TP2: 0.00001597 •TP3: 0.00001765 •Stop: Below 0.00001080 or conservative below 0.00001000. •Short Setup (Only if breakdown confirmed): •Entry: Retest of 0.00001160 from below. •TP: 0.00001004 liquidity sweep. •Stop: Above 0.00001260. ✅ Conclusion SHIB/USDT Daily is in a consolidation phase between 0.00001000 – 0.00001597. The most probable scenario is a range-bound accumulation, with bias turning bullish if 0.00001160 holds and price reclaims 0.00001362, targeting 0.00001597 → 0.00001765. A breakdown below 0.00001160 shifts focus to 0.00001004 liquidity sweep, which would threaten the bullish structure.
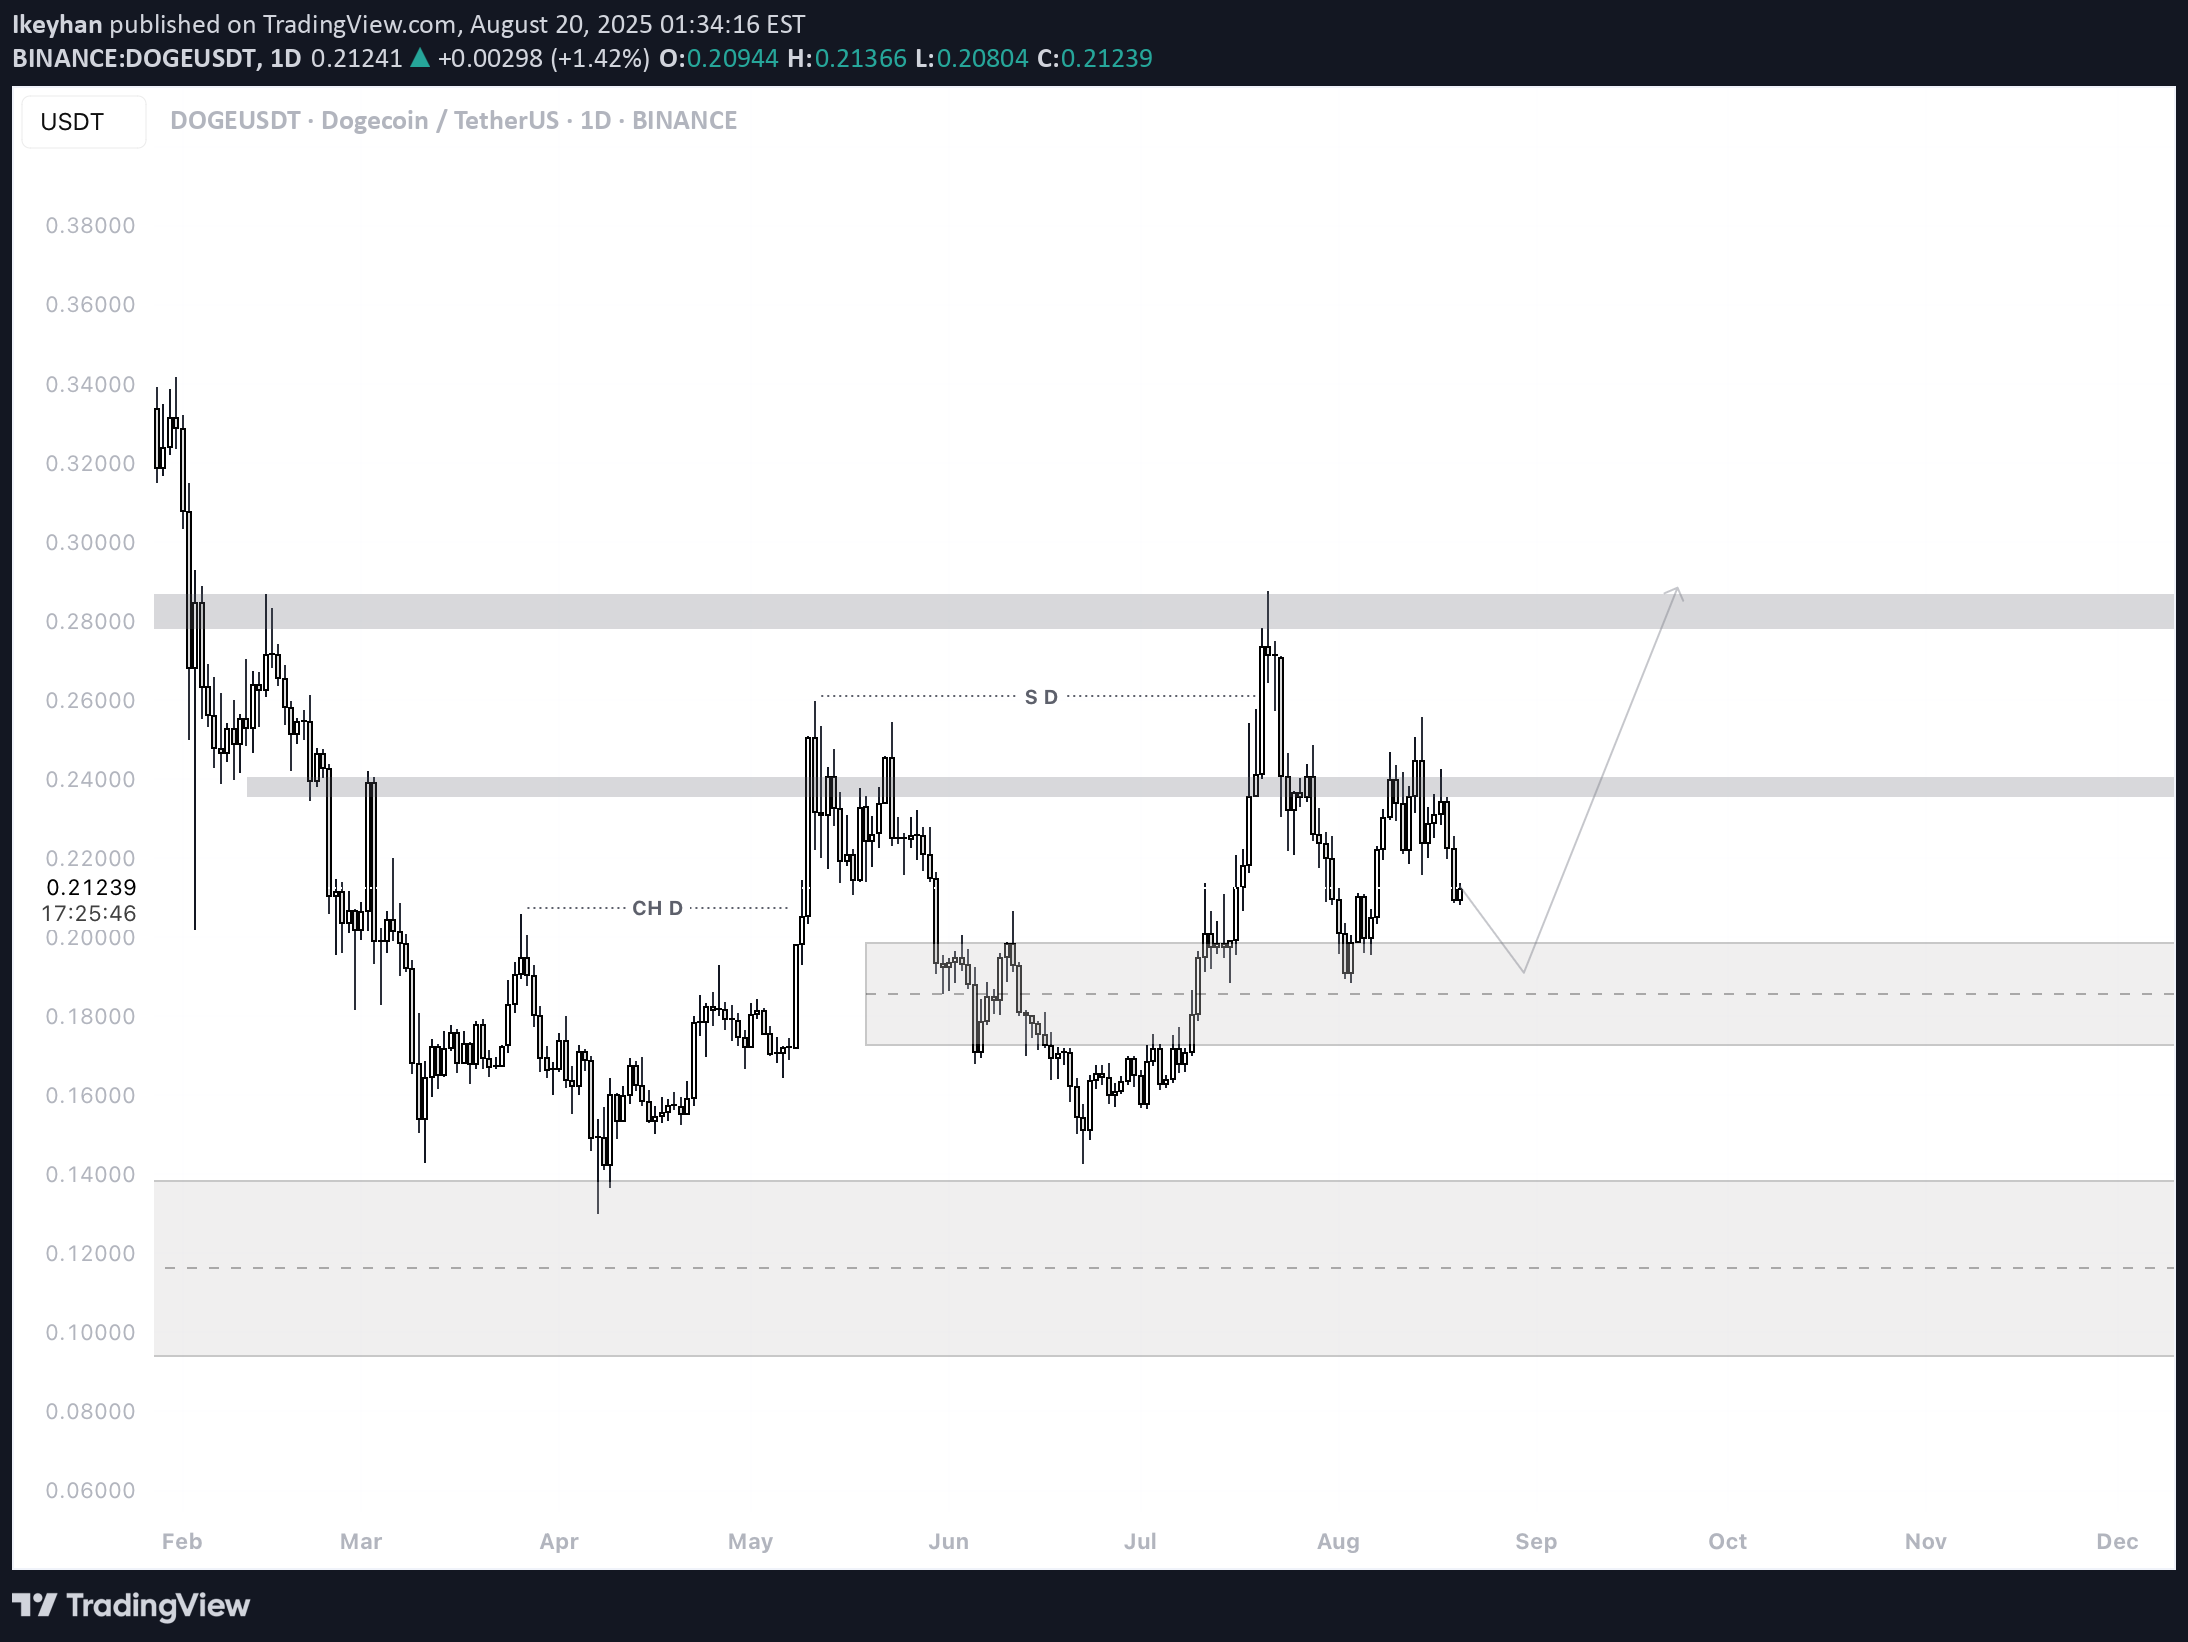
🔎 Chart Context •Pair: DOGE/USDT •Exchange: Binance •Timeframe: 1D (Daily) •Date: 21 August 2025 This chart applies price action, supply & demand zones, and liquidity sweeps to map DOGE’s likely paths. 📊 Key Observations 1.Market Structure •DOGE bottomed at 0.129 – 0.142 zone earlier in the year. •A bullish change of character (CH D) occurred around 0.193, shifting bias upward. •Since then, price has established higher lows (0.164, 0.168, 0.188) and higher highs (0.259, 0.2875) → confirming an uptrend on the daily timeframe. 2.Support & Demand Zones •0.188 – 0.206 zone: Strong demand, aligned with previous accumulation and mitigation. •0.164 – 0.168 zone: Secondary demand if the higher zone fails. •0.142 – 0.129 zone: Long-term base and ultimate defense for the bullish structure. 3.Resistance & Supply Zones •0.259 – 0.2875 zone: Heavy supply, marked as the upside target. •Price has rejected this zone twice, indicating strong liquidity resting above. •A breakout above 0.2875 would expose the next major resistance at 0.320 – 0.340. 4.Liquidity Behavior •Below: liquidity pools around 0.188 (recent HL) and 0.168 (old base). •Above: liquidity above 0.259 and especially 0.2875, where many stop orders cluster. •The projection suggests a sweep lower into 0.188, then a bullish continuation toward 0.2875. 📈 Bullish Scenario (Higher Probability) •Price retraces into 0.188 – 0.206 demand zone. •Buyers defend the zone, leading to a reversal. •Path: bounce → reclaim 0.23 → push into 0.259 → liquidity grab at 0.2875. •A successful break of 0.2875 confirms continuation toward 0.320 – 0.340. 📉 Bearish Scenario (Lower Probability) •Failure to hold 0.188 demand zone leads to a deeper correction. •Next downside targets: •0.168 (secondary demand) •0.142 – 0.129 (long-term accumulation zone) •This would still keep DOGE inside a macro bullish accumulation, unless 0.129 breaks. ⚡ Trading Plan •Long Setup (Preferred Play): •Entry: 0.188 – 0.206 zone •TP1: 0.259 •TP2: 0.2875 •TP3: 0.320 – 0.340 extension •Stop-loss: Below 0.188 or conservative below 0.168 •Short Setup (Countertrend, Risky): •Entry: 0.259 – 0.2875 supply zone rejection •TP: 0.206 – 0.188 demand zone •Stop-loss: Above 0.29
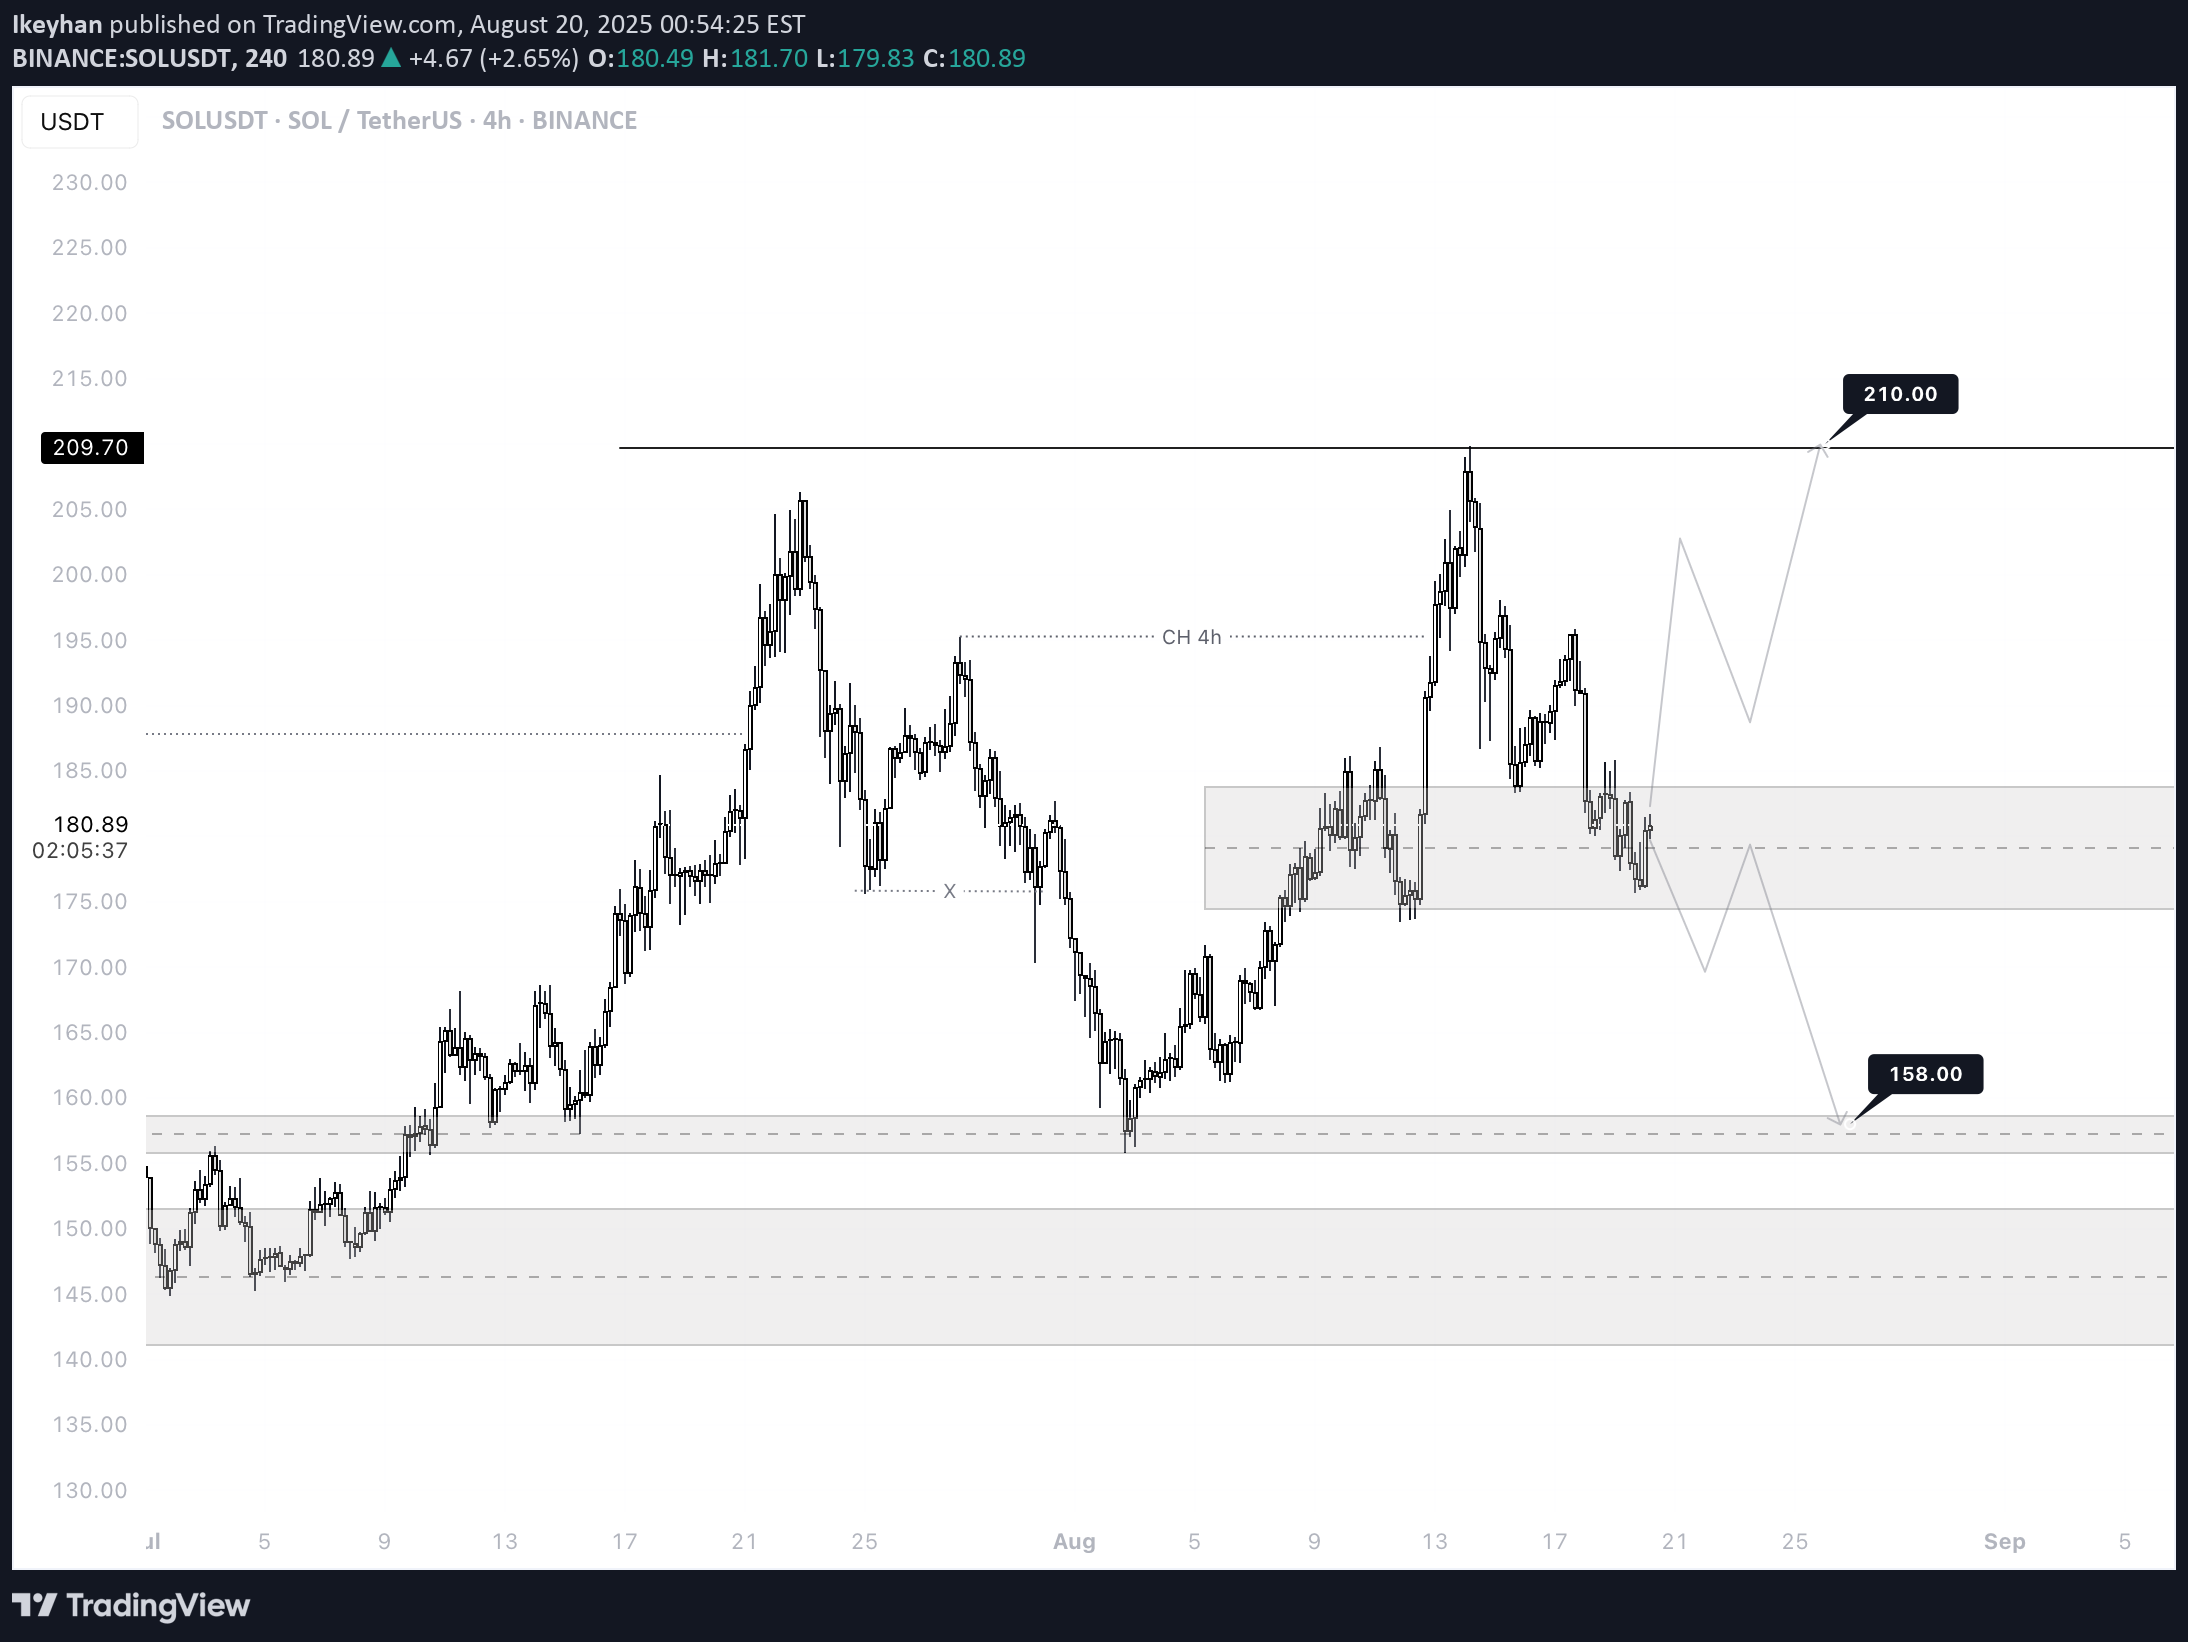
✅ SOL/USDT — 4H (Binance) | Aug 20, 2025 — Professional Technical Read 🔎 Chart context •Structure is broadly bullish since early Aug, but the last leg printed a lower high → pullback into a 4H demand/FVG block. •Price now ~180.7 inside that block. Two paths are drawn on your chart: a reaccumulation → breakout to 210 or a loss of demand → sweep 158. 📍 Key levels (approx.) •Supply / liquidity above: 200–210 (major liquidity line marked 210.00). •Decision block (current): ~175–183 (4H demand/FVG; prior breakout origin). •Pivot / CH reference: ~194–196 (CH 4H label — reclaim turns momentum cleanly bullish again). •Support below: ~158 (tagged on chart), then 150–145 (deeper old base). 🧭 Market structure & liquidity map •After the CH 4H and rally to the recent peak, price created a higher low around ~165–168, then a spike to ~205, and is now mitigating the 175–183 block. •Wicks show responsive buyers at the upper edge of the block, but the midline is soft; a clean close below ~175 likely exposes the resting liquidity at 158. •Above, buy‑side liquidity sits over 200 with a cluster around 209–210 (equal‑highs feel). 📈 Bullish continuation (probable if 175–183 holds) Conditions: •Hold 175–183 with a 4H HL and impulsive reclaim of ~188–190, then CH area ~195. Path & targets: 1.Trigger reclaim: 188–190 → momentum confirmation above 195 (CH 4H). 2.TP1: 198–200 (partial). 3.TP2: 205–206 (prior swing). 4.TP3: 209–210 (liquidity sweep). Invalidation: a 4H close below 175. 📉 Bearish continuation (activated on loss of demand) Conditions: •4H close below 175 or failed bounce capped under 188–190. Path & targets: 1.Pullback/failed retest into 182–186 (sell zone). 2.TP1: 168–166 (intermediate shelf). 3.TP2 (main): 158 sweep (your downside tag). 4.Extension (if momentum persists): 150–145 mitigation. Invalidation: sustained reclaim >195. 🎯 Trade plans (system‑agnostic
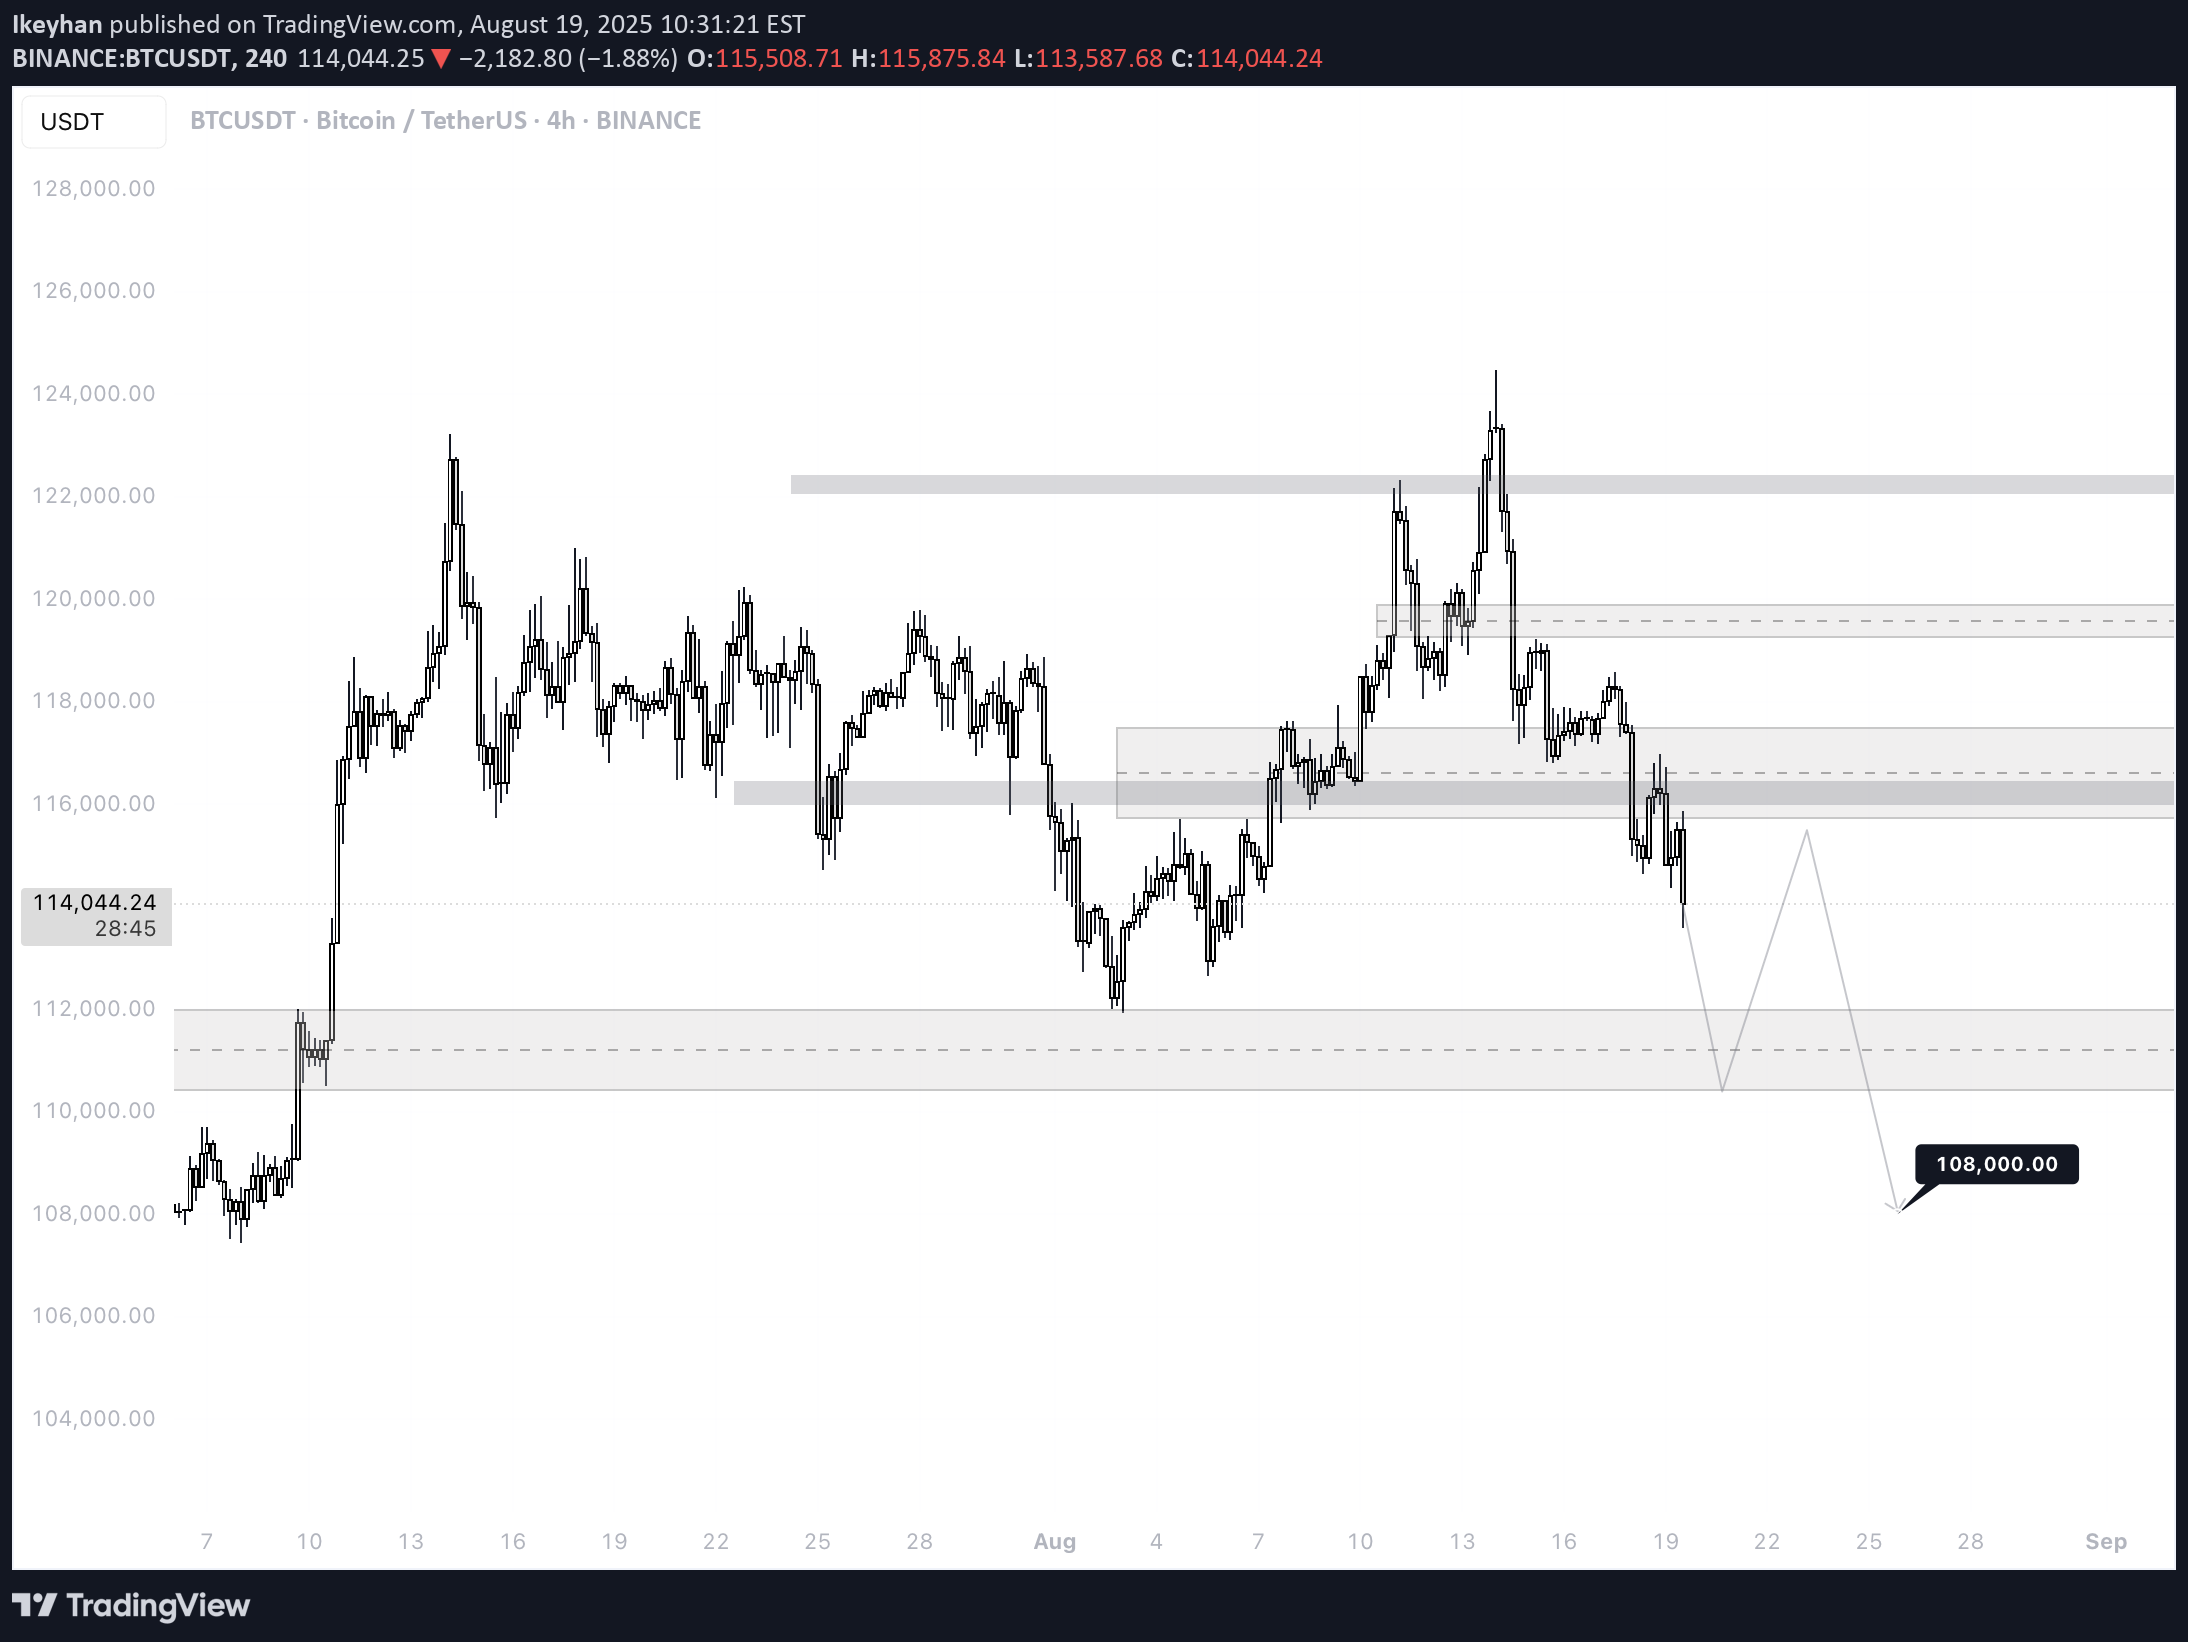
🔎 Chart Context •Pair: BTC/USDT •Exchange: Binance •Timeframe: 4H (240M) •Date: 19 August 2025 This chart is mapped using liquidity zones, supply/demand levels, and structural market shifts to project BTC’s likely next move. 📊 Key Observations 1.Current Price Action •BTC is trading around 114,050, following a sharp decline from the 124,000–125,000 resistance zone. •The structure shifted bearish after rejection from the upper supply block. •Current momentum is pushing toward deeper demand levels. 2.Support & Demand Zones •112,000–111,000: Nearest significant demand zone; previously acted as strong support after July accumulation. •108,000: Major liquidity target marked on the chart — a strong confluence area where large stop orders and institutional bids are likely to be placed. 3.Resistance Zones •118,000–119,000: Nearest overhead supply zone; likely to act as resistance on any short-term bounce. •124,000–125,000: Major resistance block that caused the latest rejection. 4.Liquidity Behavior •BTC has already swept liquidity at 116,000–115,000 zone, triggering further downside. •Liquidity magnets now sit lower, especially at 108,000, which is the projection target. •Expect volatility as price interacts with the 111,000–112,000 demand block. 5.Projected Path •Base case scenario (drawn on chart): •Drop into 111,000–112,000 demand zone. •Relief bounce toward 116,000–118,000 (supply retest). •Continuation lower into 108,000 liquidity sweep. 📈 Bullish Case (Lower Probability, Countertrend) •If BTC holds 112,000–111,000 demand zone strongly and invalidates supply at 118,000–119,000: •First target: 120,000. •Second target: 124,000–125,000 retest. •Requires strong volume and supportive macro flows (e.g., USD weakness, strong equities). 📉 Bearish Case (Higher Probability) •Structure favors downside continuation. •Path: •Retest of 116,000–118,000 supply zone (failed rally). •Breakdown continuation to 108,000 liquidity target. •This scenario aligns with broader DXY/EURUSD outlook where USD remains weak short-term but BTC could still flush liquidity before next bullish cycle. ⚡ Trading Plan •Short Bias (Preferred Play): •Entry: Relief rallies into 116,000–118,000. •TP1: 112,000 •TP2: 108,000 •Stop: Above 120,000 •Long Setup (Risky, Countertrend): •Entry: 111,000–112,000 demand zone. •TP: 118,000 •Stop: Below 108,000
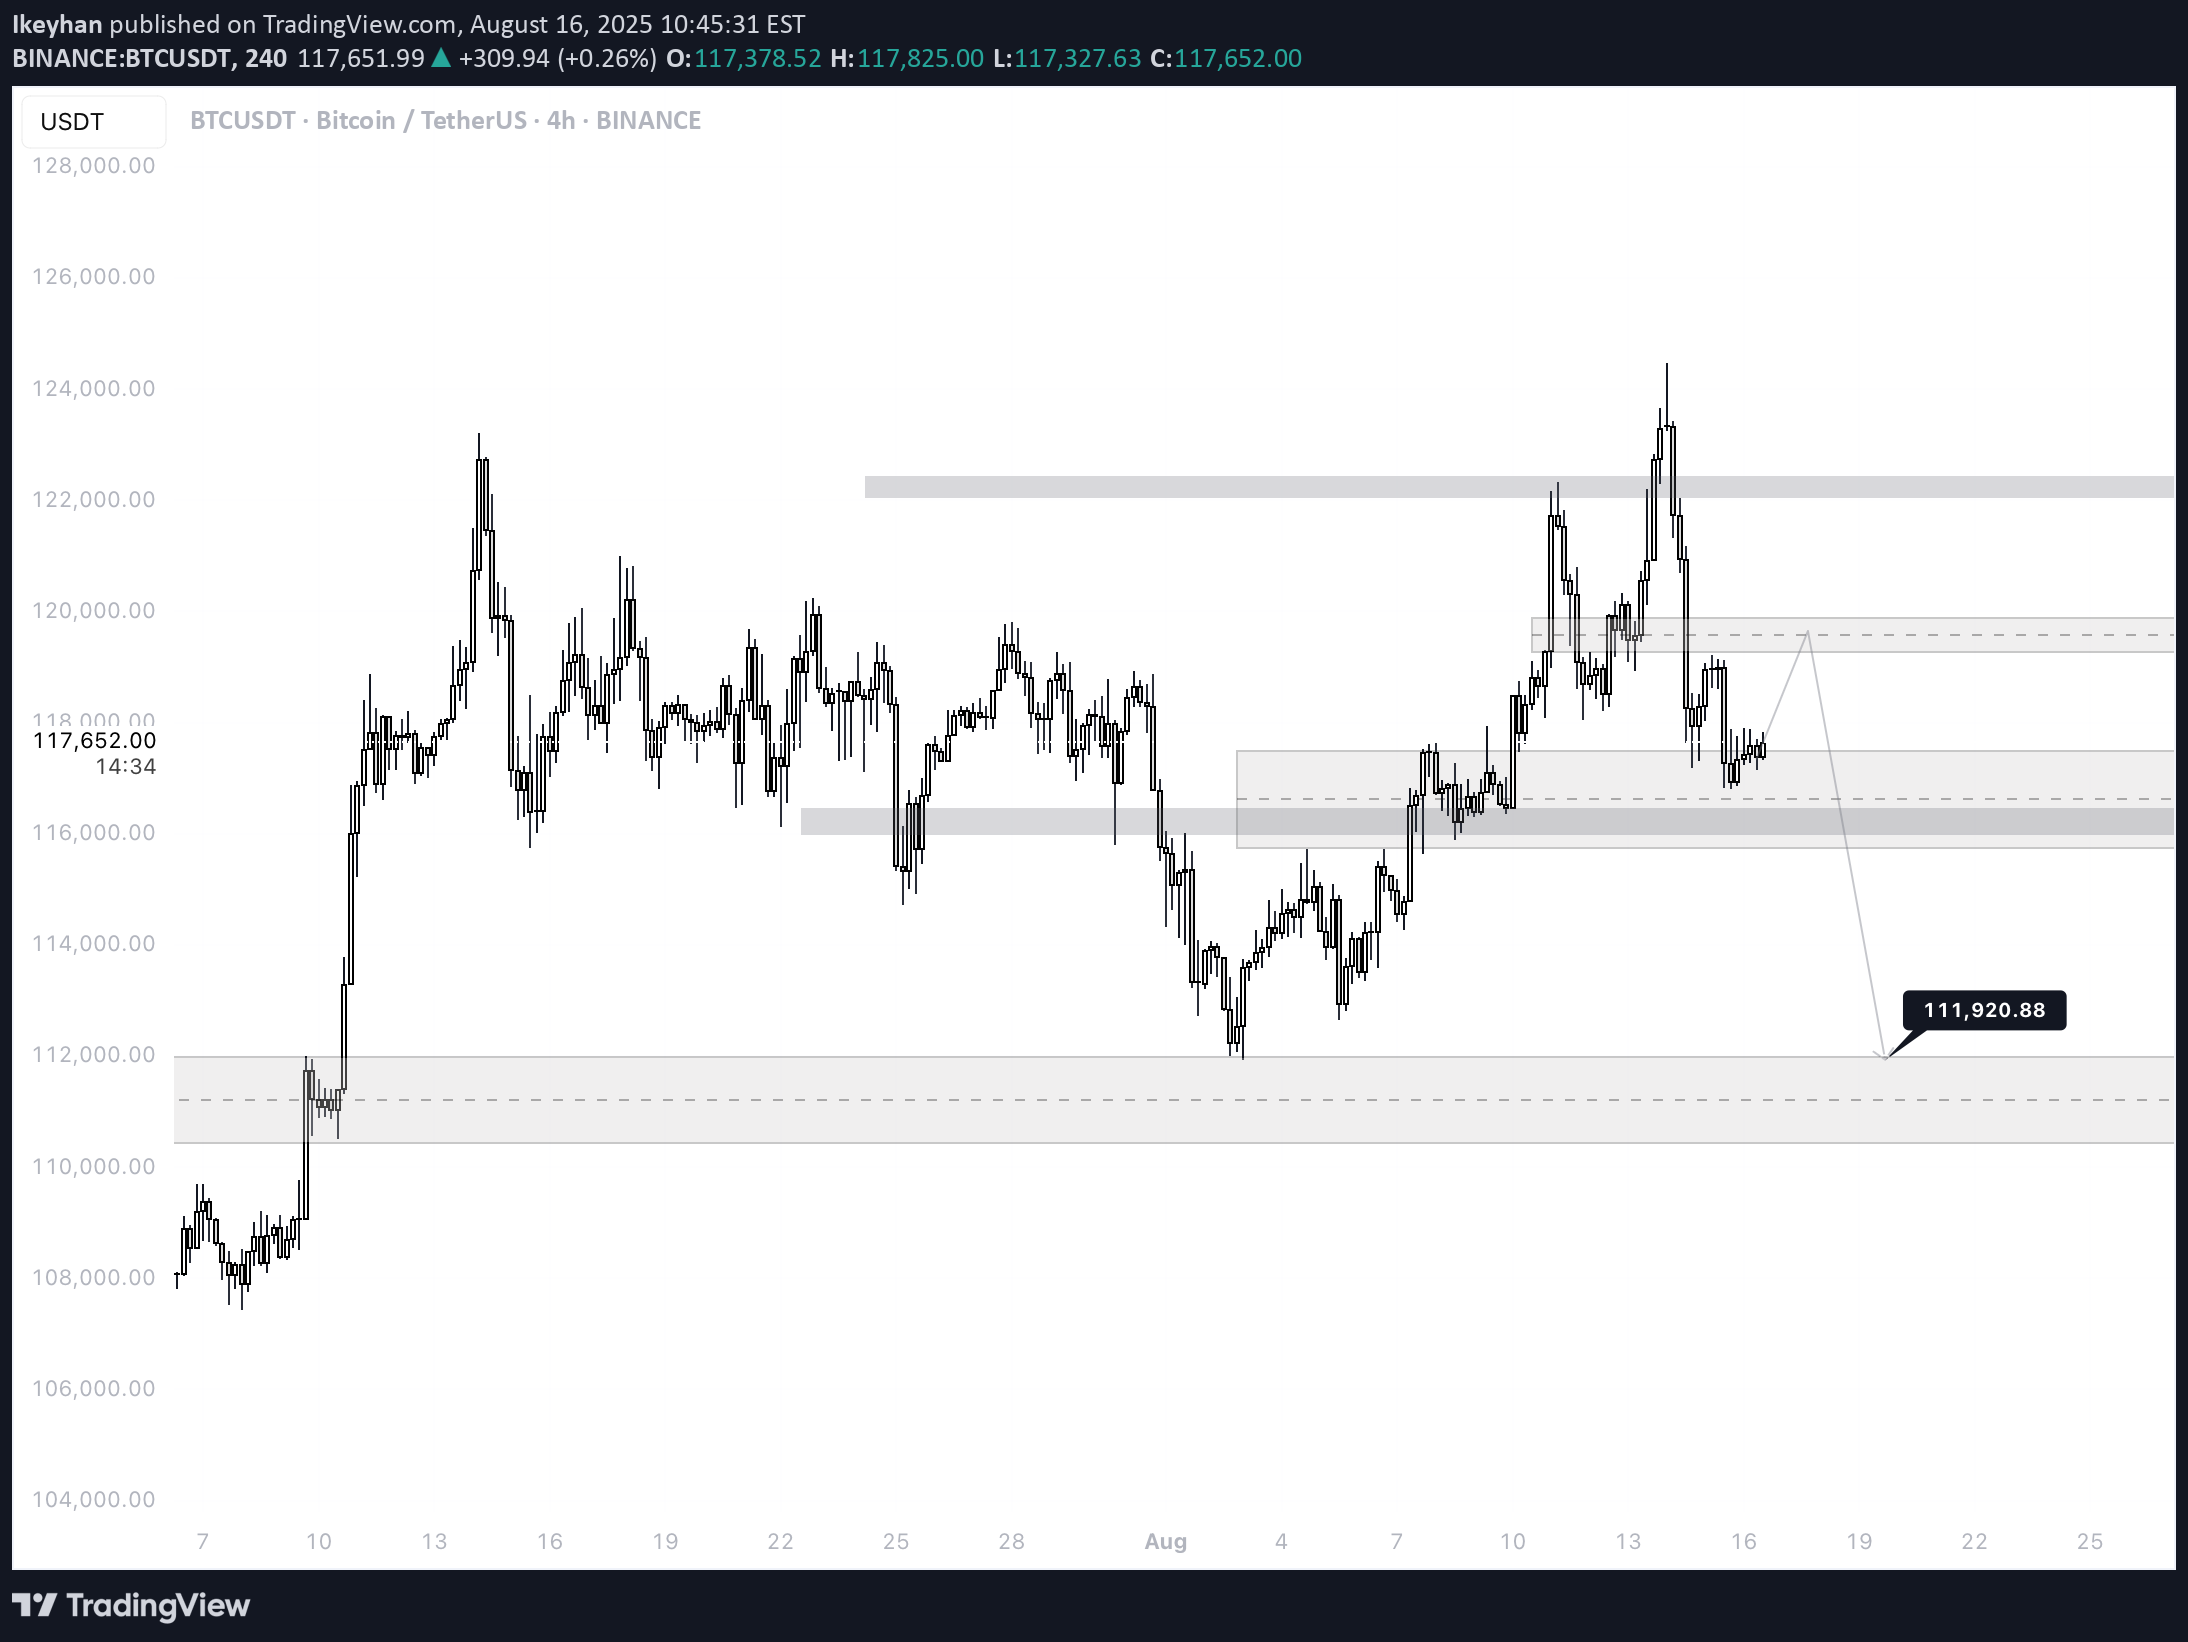
🔎 Chart Context •Pair: BTC/USDT •Exchange: Binance •Timeframe: 4H (240M) •Date: 16 August 2025 The chart applies price action, liquidity sweep, demand/supply zones, and FVG (Fair Value Gaps) to forecast market behavior. 📊 Key Observations 1.Major Highs & Lows •Recent Highs: 124,474 and 123,218 •Key Resistance: 122,335.16 zone •Significant Lows: 112,650.00 and 111,920.00 (highlighted as potential liquidity target) These represent liquidity pools where institutional activity often occurs. 2.Current Price •Trading around 117,621 – 118,235 zone at the time of charting. •Price is consolidating after rejection from 124,474 top. 3.Liquidity Structure •Market swept liquidity above 124,474 and quickly rejected, signaling a potential distribution phase. •Below, untested liquidity exists near 111,920, which is marked as a probable downside target. 4.FVG & Demand Zones •A Fair Value Gap (FVG) remains open around 115,200–116,500, which price could retest before further downside. •Stronger demand lies around 111,920–112,650, likely to act as a magnet if the retracement deepens. 5.Resistance Zones •122,335–124,474 is a strong supply block / distribution zone, which caused the sharp rejection. •Any bullish recovery will need to reclaim 120,247 and 119,800 to sustain upside momentum. 📈 Bullish Case (Less Likely, Countertrend Scenario) •If BTC holds above 115,200–116,500 FVG zone and forms higher lows: •First target: 119,800 (minor supply). •Second target: 122,335 (major resistance). •Reclaiming this zone could trigger a retest of 124,474. •However, this requires strong demand and volume, which currently looks weak. 📉 Bearish Case (Higher Probability Scenario) •After liquidity grab at 124,474, rejection suggests continuation lower. •Likely retracement path: •Retest 116,500–115,200 (FVG zone) •Break below to sweep 112,650 •Final downside liquidity target: 111,920 This scenario aligns with the chart projection arrow pointing toward 111,920.88. ⚡ Trading Plan •Short Entries (Preferred Play): •At 119,800–120,247 (supply retest) •At 122,335 zone (distribution block) •Target 1: 116,500–115,200 (partial close). •Target 2: 112,650. •Target 3: 111,920 (main liquidity sweep). •Stop-loss: Above 124,474 high. •Long Setup (Countertrend, Risky): •Entry at 115,200–116,500 (FVG) •TP1: 119,800 •TP2: 122,335 •Stop: Below 114,700
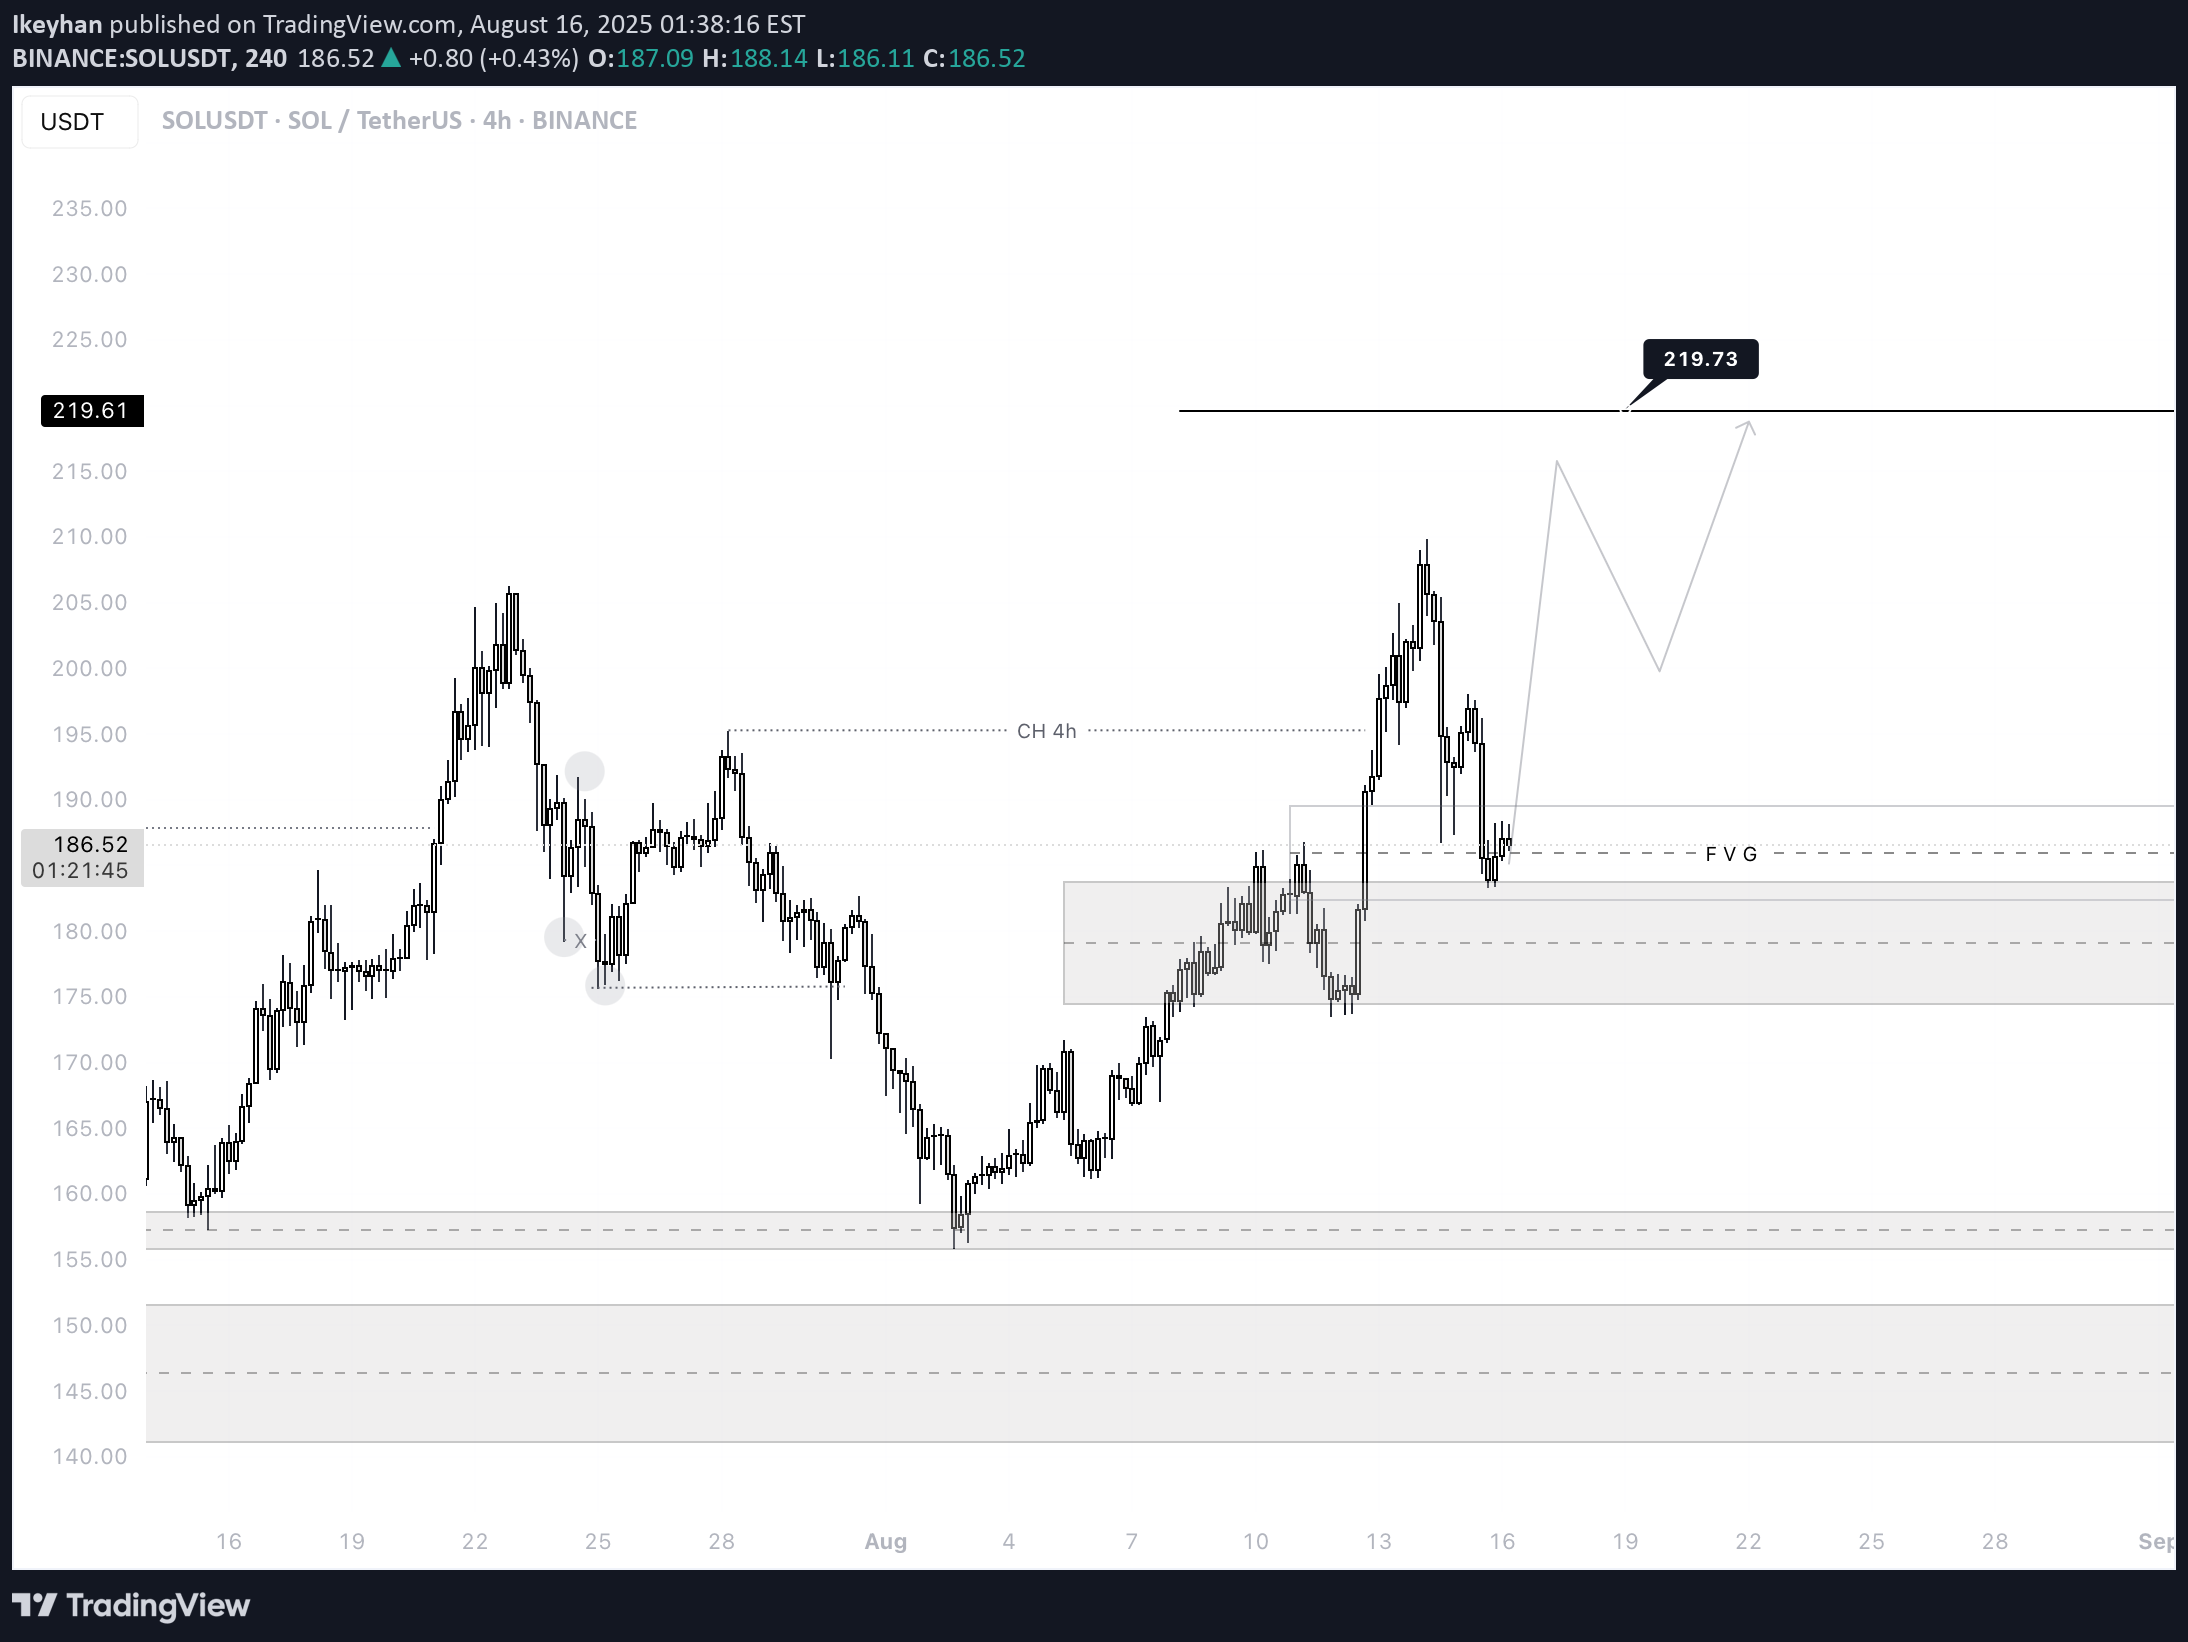
🔎 Chart Context •Pair: SOL/USDT •Exchange: Binance •Timeframe: 4H (240M) •Date: 16 August 2025 This chart uses price action + liquidity concepts (CH, FVG, liquidity grabs, demand zones) for projection. 📊 Key Observations 1.Recent Highs & Lows •Swing High: 209.86 •Previous High: 206.30 •Previous Lows: 173.43, 175.63, and 161.13 These levels represent liquidity points where orders are clustered. 2.Change of Character (CH 4H) •Around 195.26, a CH (Change of Character) has been marked. •This suggests that the bearish trend shifted into bullish momentum after reclaiming higher highs. 3.FVG (Fair Value Gap) •The current price is retesting the FVG zone after rejecting from 209.86. •FVG zones typically act as rebalancing levels where price either consolidates or launches into the next move. 4.Demand Zones •173.43 – 177.73: Strong demand area with previous accumulation. •155.83 – 157.23: Deeper demand zone that may act as a long-term support if the market drops sharply. •Current reaction shows bulls protecting 173–177 zone. 5.Upside Target •Next projected liquidity pool is at 219.73. •This is above the 209.86 high, indicating liquidity sweep potential and continuation of bullish trend. 📈 Bullish Case (High Probability) •Price held the FVG + demand block around 173–177. •Higher High (209.86) confirmed a bullish structure. •If momentum sustains, target = 219.73, where liquidity above old highs is likely to be taken. •Expect potential retracement back to 195–197 before pushing up. 📉 Bearish Case (Low Probability but Possible) •If SOL fails to hold 173–177 demand zone, we may see a deeper retracement toward 161–157 support zone. •Losing that level would invalidate the bullish structure and turn the chart back into distribution mode. ⚡ Trading Plan •Entry (Long): Accumulation around 173–177 (FVG/Demand zone). •Target 1: 195–197 (partial take-profit). •Target 2: 209.86 (previous high). •Target 3 (final): 219.73 (liquidity sweep zone). •Stop-loss: Below 173 (safe stop), or aggressive stop below 182.70 minor structure
Disclaimer
Any content and materials included in Sahmeto's website and official communication channels are a compilation of personal opinions and analyses and are not binding. They do not constitute any recommendation for buying, selling, entering or exiting the stock market and cryptocurrency market. Also, all news and analyses included in the website and channels are merely republished information from official and unofficial domestic and foreign sources, and it is obvious that users of the said content are responsible for following up and ensuring the authenticity and accuracy of the materials. Therefore, while disclaiming responsibility, it is declared that the responsibility for any decision-making, action, and potential profit and loss in the capital market and cryptocurrency market lies with the trader.