Technical analysis by Ikeyhan about Symbol SHIB on 7 hour ago

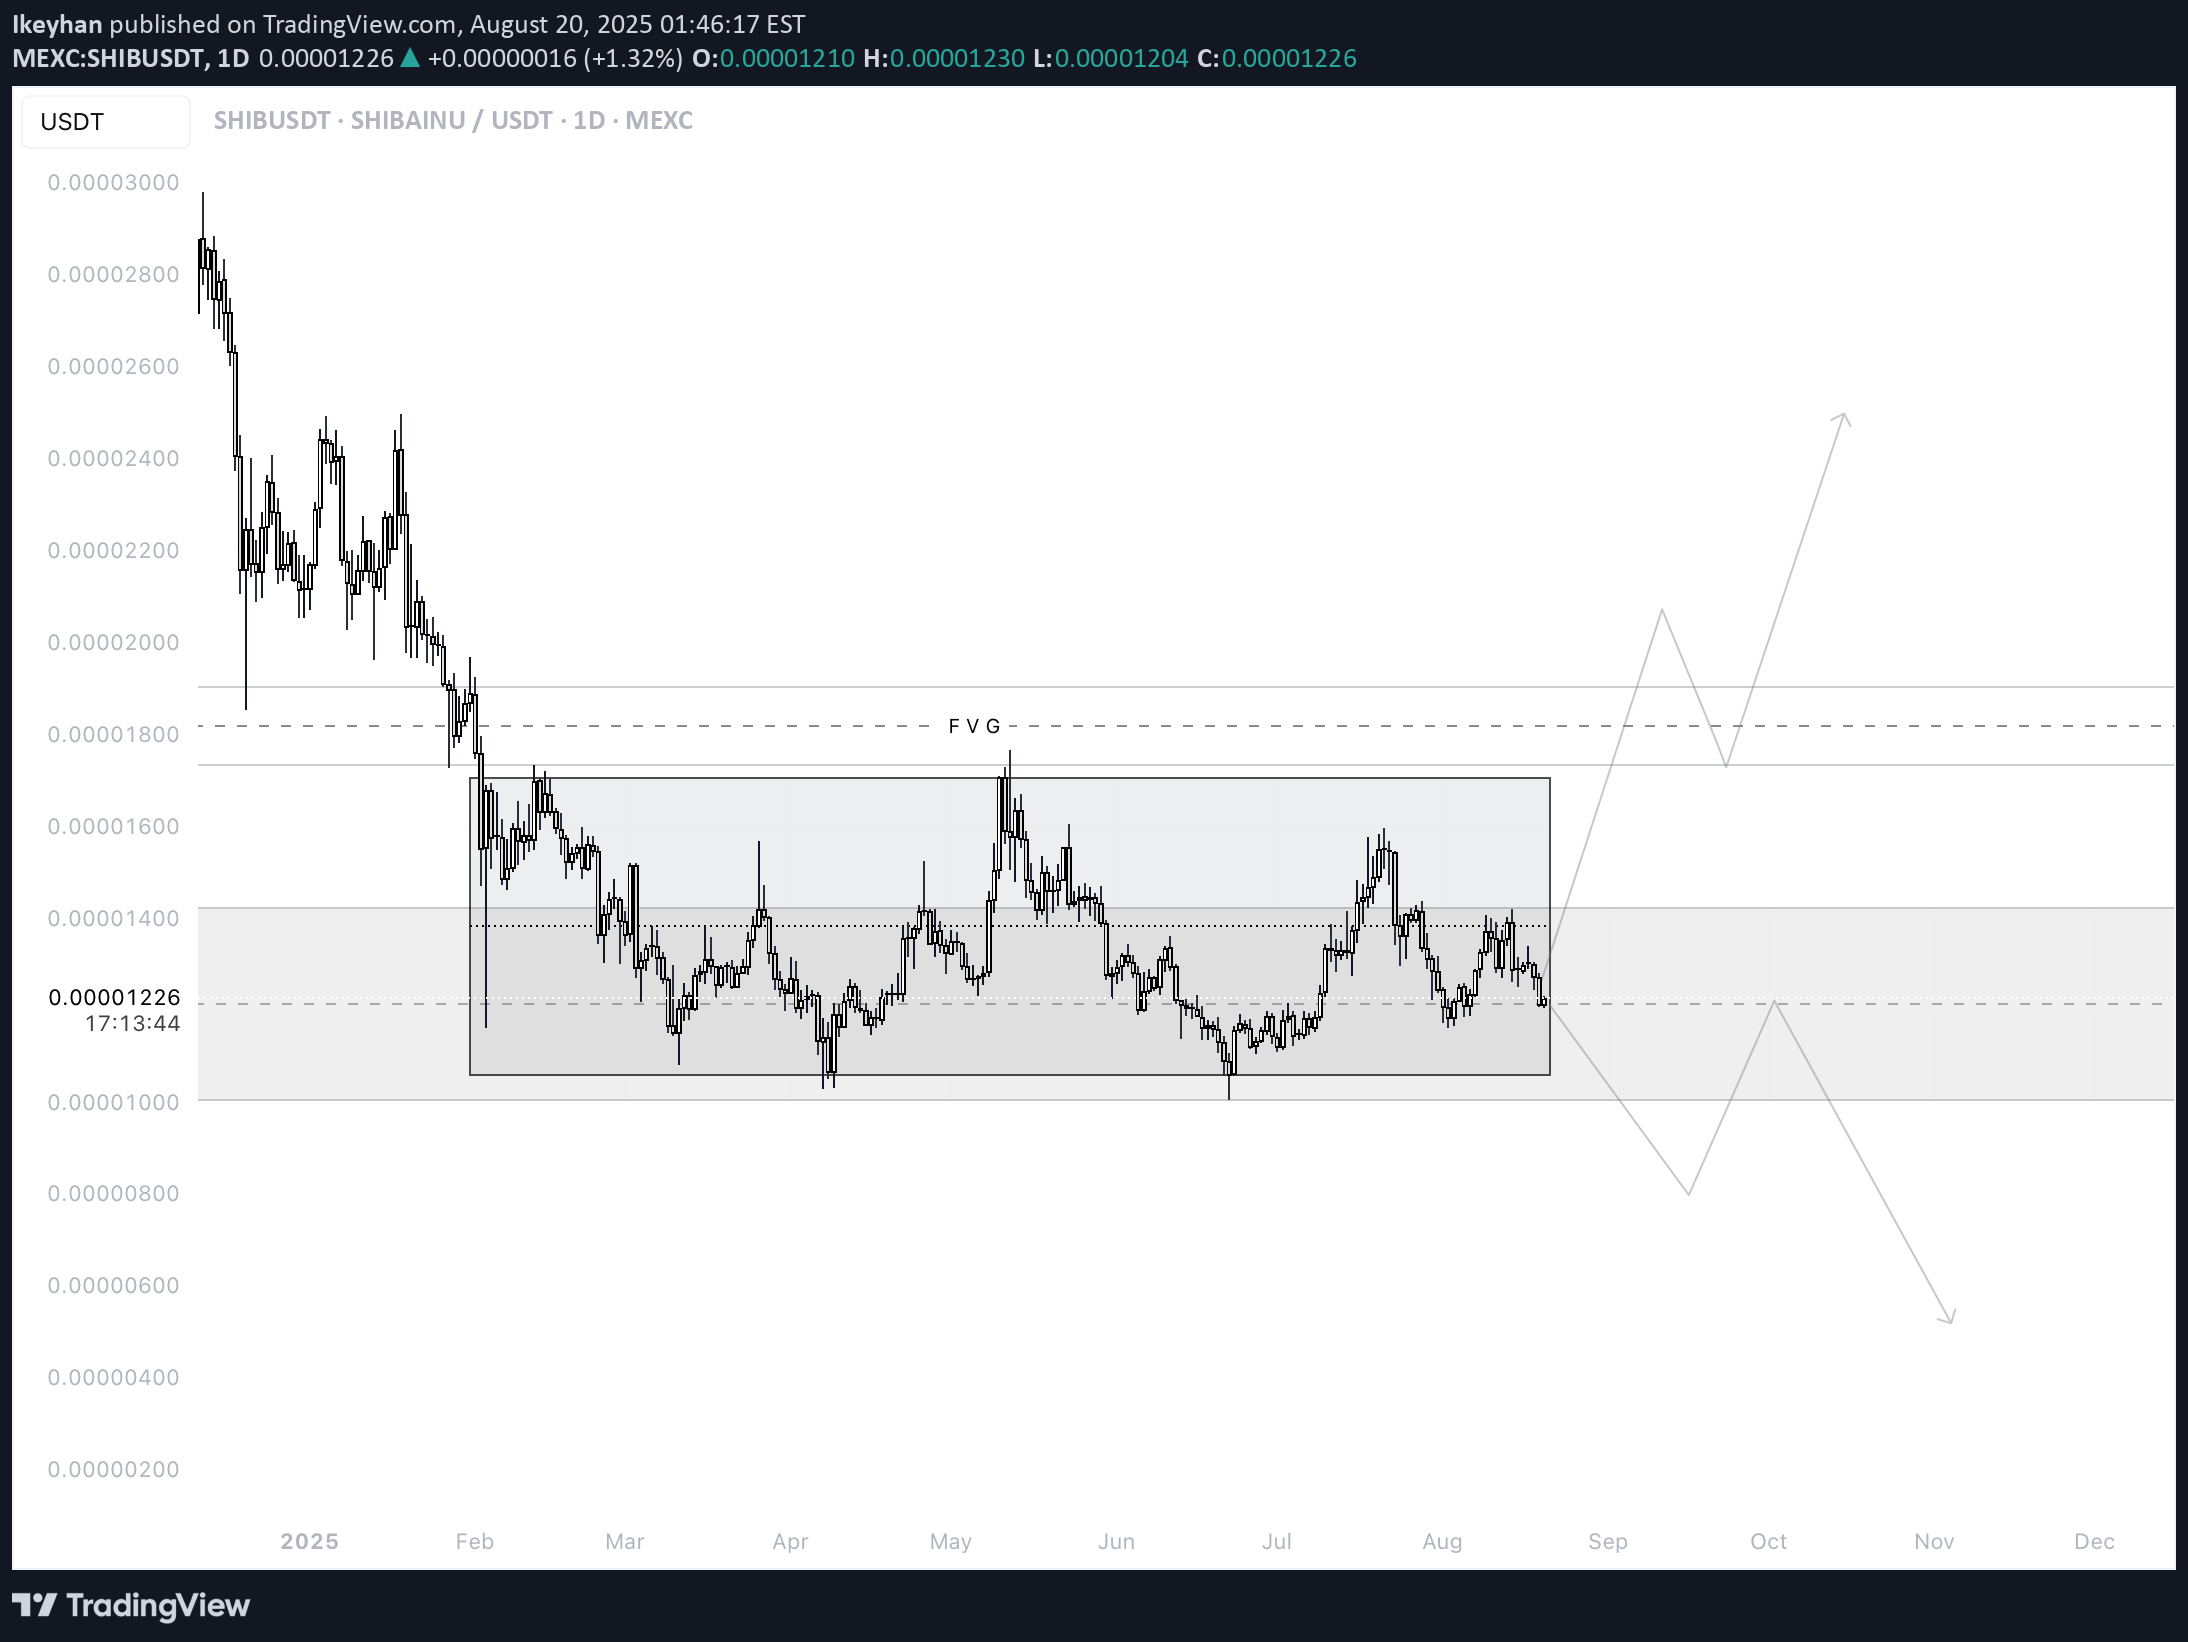
🔎 Chart Context •Pair: SHIB/USDT •Exchange: MEXC •Timeframe: 1D (Daily) •Date: 21 August 2025 This chart shows SHIB trading within a large consolidation range after a significant bearish move earlier in 2025. 📊 Key Observations 1.Macro Structure •SHIB has been in a sideways range between 0.00001000 (support) and 0.00001597 (resistance) since March 2025. •The chart highlights this rectangular range, showing repeated liquidity sweeps on both sides. •Current price: ~0.00001283, sitting in the lower half of the range. 2.Support Zones •0.00001160 – 0.00001080 zone: Main demand block, tested multiple times (April, July). •0.00001004 – 0.00001028: Deeper liquidity sweep levels; losing this zone risks breakdown. •These zones are critical for SHIB’s bullish survival. 3.Resistance Zones •0.00001362 – 0.00001597 zone: Upper supply boundary of the consolidation. •0.00001765 (FVG): Marked upside liquidity gap; a breakout from range would likely target this. •Beyond that, 0.00001853 – 0.00002000 is the next strong supply zone. 4.Liquidity Behavior •Below: resting liquidity around 0.00001160 and 0.00001004. •Above: liquidity pools at 0.00001597 and 0.00001765, making these the primary bullish targets. •The chart projects both scenarios: •Bullish breakout above the range toward 0.00001765. •Bearish breakdown below 0.00001160 toward 0.00001004 or lower. 📈 Bullish Scenario (Higher Probability if 0.00001160 holds) •SHIB defends 0.00001160 demand and reclaims 0.00001362 mid-range resistance. •Momentum carries price to: •TP1: 0.00001597 (range high) •TP2: 0.00001765 (FVG fill / liquidity sweep) •TP3 (extension): 0.00001850 – 0.00002000 major supply zone. •This requires holding above 0.00001160 and rejecting downside liquidity sweeps. 📉 Bearish Scenario (Lower Probability but Risk) •Price loses 0.00001160 demand with strong volume. •Next targets: •0.00001080 → 0.00001028 (short-term supports) •0.00001004 liquidity sweep (major downside magnet) •A daily close below 0.00001000 confirms a macro bearish breakdown, exposing 0.00000900 and below. ⚡ Trading Plan •Long Setup (Preferred if support holds): •Entry: 0.00001160 – 0.00001230 demand zone. •TP1: 0.00001362 •TP2: 0.00001597 •TP3: 0.00001765 •Stop: Below 0.00001080 or conservative below 0.00001000. •Short Setup (Only if breakdown confirmed): •Entry: Retest of 0.00001160 from below. •TP: 0.00001004 liquidity sweep. •Stop: Above 0.00001260. ✅ Conclusion SHIB/USDT Daily is in a consolidation phase between 0.00001000 – 0.00001597. The most probable scenario is a range-bound accumulation, with bias turning bullish if 0.00001160 holds and price reclaims 0.00001362, targeting 0.00001597 → 0.00001765. A breakdown below 0.00001160 shifts focus to 0.00001004 liquidity sweep, which would threaten the bullish structure.
