
HesamUNT
@t_HesamUNT

What symbols does the trader recommend buying?
Purchase History
پیام های تریدر
Filter
Signal Type
HesamUNT

Hey traders As u can see, not still playing in the 4H falling wedge The lower trendline which is below the 0.236 fib can b a gr8 entry Breaking out the pattern will b one of the confirmations Also ichi still playing bearish, breaking up the SenkouA in daily n 4H TF will b the second confirmation What u think about notcoin? Share ur chart n leave a comment
HesamUNT
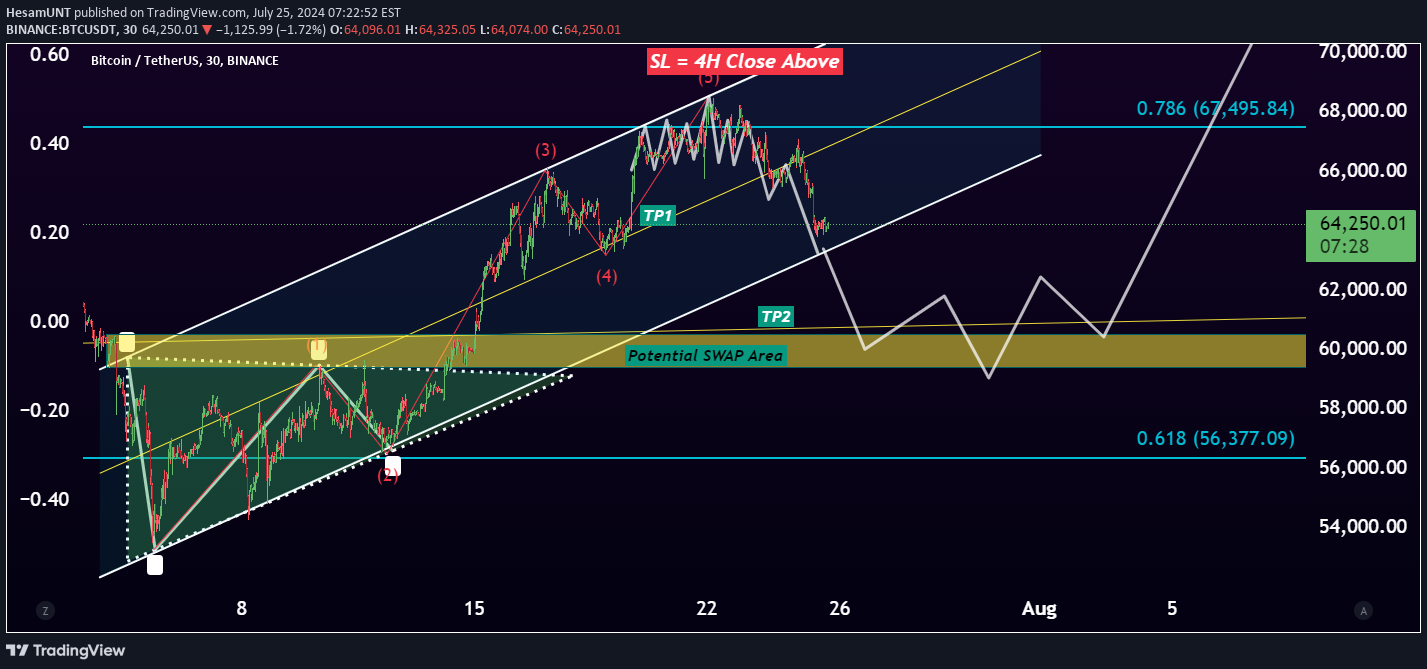
hey traders lets take a quick look at BTC from the daily TF, we have an important zone for trend confirmation and price still playing range in this Zone for a while based on the daily zone, we can expect support at the bottom n resistance behavior at the bottom of the zone the bottom of this zone which is our major support area already confirmed with fib + Zone + Harmonic Pattern in lower TF Like 4H and 2H TF and still working as a support area after 2 touches we got the first pump based on this chart in the first touch and the second touch made the move after breaking up the LTF harmonic triangle we broke up the pattern and had a nice pump to the 68k which is the Top of the daily zone so sell pressure was expected below this lvl in lower TF, and that was our previous trade that u can check it as an idea now, as u can see, there's a bullish parallel channel in 15m 30m TF and we go back to the bottom of this channel which is the target of the previous trade this channel comes from the Lower TF and we dont have any confirmation at this lvl in HTF, so I'm expecting this sell pressure to extend to the Swap area which is the yellow zone if it happens, we can expect another buy pressure at the Swap area, so we can get in after confirmation share ur thoughts n leave a comment
HesamUNT
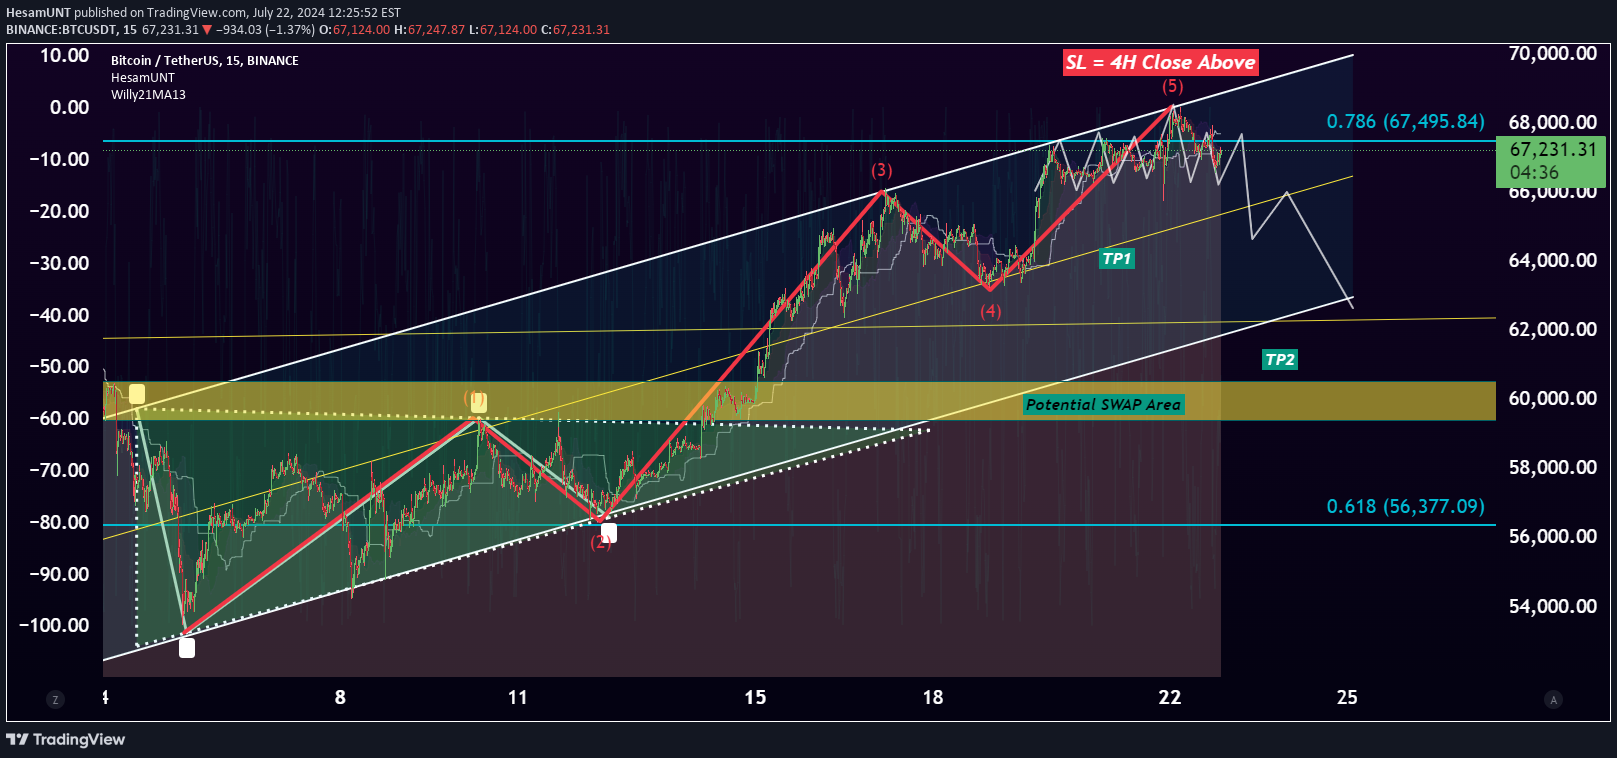
hey traders, i hope u having gr8 day so far as we expected, the Golden Ratio which comes from the HTF fib ext is still working as a support area price made a shadow below the Golden Ratio in HTF like Weekly, and then we had another bullish wave in LTF like 1H 2H 4H the confirmation for that move was the Harmonic Triangle or ascending triangle in LTF like 5m 15m at the key lvl which was the golden ratio after breaking up the Golden Ratio, we can take it as a potential SWAP area, so we can expect this lvl work as a potential support area in the next touches ( Yellow zone ) now, the price gets rejected in HTF like daily, and 4H at the 0.786 lvl as long as this lvl still works as a resistance area, we can expect this sell pressure continue to the midline of the parallel channel as a tp1 and bottom of the channel which confirmed by SWAP area as a TP2 n full Target What u think about Bitty ? share ur thoughts n leave a commentstill rejecting from the lvl in LTF make sure u will protect ur profitTP1 u can close, or keep it open n put ur sl in+theres a chance for this channel 2 push the price up so, if u still in position, make sure u will protect ur profiletheres an update that u can check make sure u will check the profile for more ideas n detailshit the SL in + around 64600 waiting for another confirmation
HesamUNT

hey traders as you can see, notcoin still playing in the bearish parallel channel notcoin already had almost 70% retracement if u take a look at daily TF based on fib retracement, 0.009 confirmed by 0.236 lvl also this area conformed by potential harmonic pattern if this area works as a support area, we can expect a range market n then pump to the : first target will b the swap area which confirmed by 0.0382 fib lvl tp2 will b the SenkouA peak which confirmed by golden ratio around 0.0236 and the last target will b the major resistance which is point "A" on harmonic pattern + 0.786 fib lvl sure, we need confirmation lvl by lvl what u think about notcoin? share ur vision n leave a commentComment: tp1 we need confirmation at this lvl, i guess there will b some sell pressure
HesamUNT
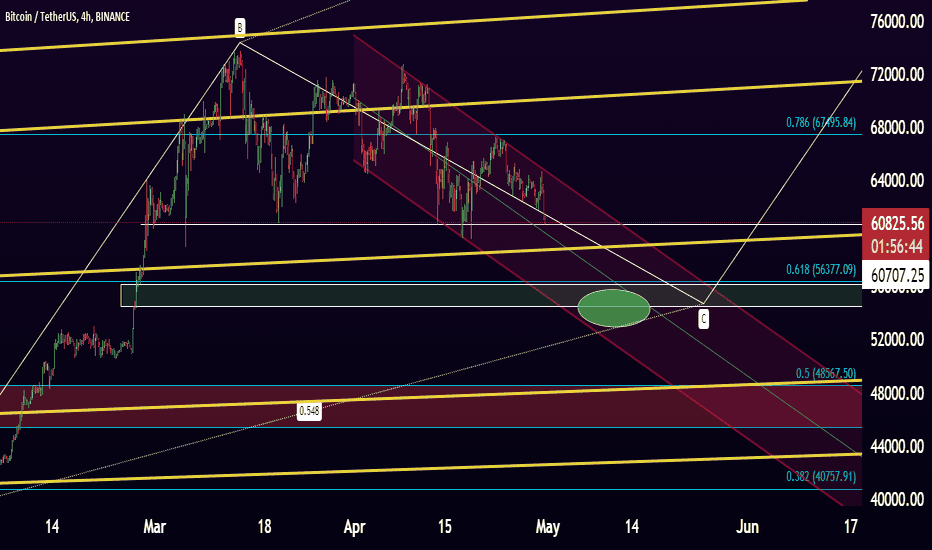
hey traders as u can see, BTC couldnt stablize above the 0.786 fib ext lvl and rejected to the Daily Support area also BTC formed a descending triangle in 2H TF and still playing in the bearish parallel channel we can expect a break down to the Lower Demand zone which confirmed by all-time Fib ext golden Ratio 0.618 if it happen and we go back to the golden Ratio, we can expect another buy pressure. in this case, Bullish H&S will b very Likely for the next moves also this area confirmed by bullish Harmonic pattern so . . . 1- All-time Fib ext 0.618 2- All-time dynamic lvl 3- 4H Demand Zone 4- Potential Bullish Harmonic Pattern 5- Potential Bullish H&S Pattern 6- Break out the Bearish parallel channel all of this strategies make this lvl strong enough for entry if we go back to the golden ratio and it works as a support area, we can expect another AB CD in higher TF same as the chart what u think about BTC ? Share ur chart n leave a commentstill working as a support area in daily TF
HesamUNT

hey traders as u can see, BTC couldnt stablize above the 0.786 fib ext lvl and rejected to the Daily Support area also BTC formed a descending triangle in 2H TF and still playing in the bearish parallel channel we can expect a break down to the Lower Demand zone which confirmed by all-time Fib ext golden Ratio 0.618 if it happen and we go back to the golden Ratio, we can expect another buy pressure. in this case, Bullish H&S will b very Likely for the next moves also this area confirmed by bullish Harmonic pattern so . . . 1- All-time Fib ext 0.618 2- All-time dynamic lvl 3- 4H Demand Zone 4- Potential Bullish Harmonic Pattern 5- Potential Bullish H&S Pattern 6- Break out the Bearish parallel channel all of this strategies make this lvl strong enough for entry if we go back to the golden ratio and it works as a support area, we can expect another AB CD in higher TF same as the chart what u think about BTC ? Share ur chart n leave a comment
HesamUNT

hey traders look at the chart, gold still playing in a bullish parallel channel blue lvls = long-term fib ext yellow lvls = long-term dynamic lvls ( Pitchfan ) white lvls = long-term fib retracement all these 3 lvls confirm this area for potential resistance area as long we play below the dynamic and fibs in 4H n daily TF, we can expect the selling pressure to the marked area in the chart what u think about Gold ? share ur chart n leave a commentTrade active: entry 2358.403Comment: we gt the first rejectionComment: EMA 50-200 bearish cross will b one of the confirmation for brearish scenario n we dont have it yetComment: this time we need 2 go below the area and candles need to stabilize below the EMAs, if it happen, the green area must turn to red, it will b one of the confirmations for the bearish scenarioComment: we got the bearish cross here candles need to close below the channels n fib in 4H TF for next moveComment: Still valid and rejecting from the HTFComment: Still rejection from the Higher TF, make sure u will protect ur profit Make sure u will protect ur profite
HesamUNT

hey traders as u can see, EOS already completed the ABCB pattern and hit the Daily Supply Zone, There is some selling pressure and bulls are trying 2 collect the sell pressures between 1.36$ _ 1.1$$ this fight between these 2 zones made a harmonic ABDC pattern IN 15M tf if we take it as a retracement move, not a reversal move, breaking up the triangle pattern will b trend confirmation to the TP1- 1.36 $ TP2- 1.48 $ TP3- 1.57 $ TP4- 1.63 $ TP5- 1.91 $ TP6- 2.10 $ wont b valid if price break down the demand zone in 4H or Daily TF share ur chart n leave a comment
HesamUNT

CELR USDT By HesamUNT Hey traders as u can see CELR broke up the bearish parallel channel, also plying above the Swap area Ichi still playing bullish in 1H 2H 4H Daily TF We can take this zone as a potential support area with 2 targets same as the chart wont b valid if 4H Candle close below the 0.01250 share ur vision n leave a comment
HesamUNT

LINK USDT By HesamUNT ( New Update ) hey traders pump was amazing and we didnt miss that now im looking for short position around all-time fib retracement lvl in 4H TF lower Demand zone will b the target we have 3 TPs in this trade, TP1 is very likely, but we need confirmation at TP2 what u think ? share ur chart n leave a comment
Disclaimer
Any content and materials included in Sahmeto's website and official communication channels are a compilation of personal opinions and analyses and are not binding. They do not constitute any recommendation for buying, selling, entering or exiting the stock market and cryptocurrency market. Also, all news and analyses included in the website and channels are merely republished information from official and unofficial domestic and foreign sources, and it is obvious that users of the said content are responsible for following up and ensuring the authenticity and accuracy of the materials. Therefore, while disclaiming responsibility, it is declared that the responsibility for any decision-making, action, and potential profit and loss in the capital market and cryptocurrency market lies with the trader.