
Harry_Brook3
@t_Harry_Brook3

What symbols does the trader recommend buying?
Purchase History
پیام های تریدر
Filter
تحلیل تکنیکال بیت کوین (BTC/USD): پیشبینی ریزش تا ۸۲ هزار دلار با استفاده از SMC
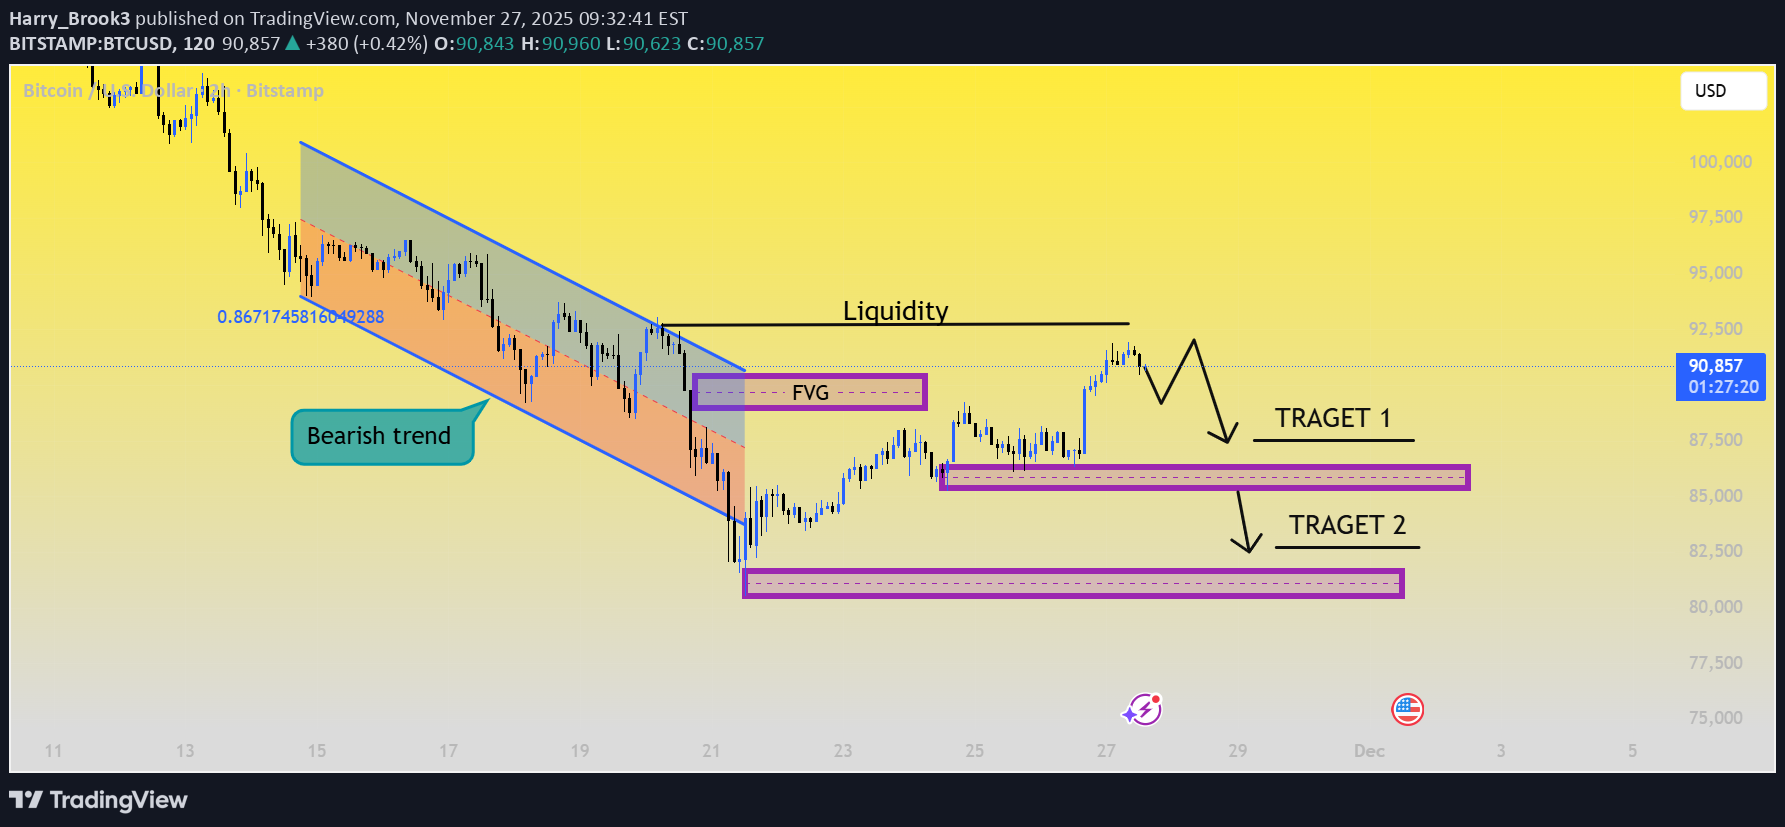
Bitcoin (BTC/USD) Chart Analysis This chart also uses Smart Money Concepts (SMC) to outline a potential short-term bearish setup (Sell) for Bitcoin (BTC/USD). Previous Trend: Price recently exited a clear bearish channel (downward movement). Liquidity & FVG: Price made a strong push up to sweep liquidity (hitting stop-losses above recent highs) and has now entered the FVG (Fair Value Gap) region. Prediction: The analysis predicts a reversal from this zone and a move lower, with two target zones: Target 1: Near the $86,000 level. Target 2: Near the $82,000 level (a deeper support zone).
تحلیل بیت کوین: آیا ریزش تمام شد؟ حرکت بعدی BTC به سمت ۹۵ هزار دلار!
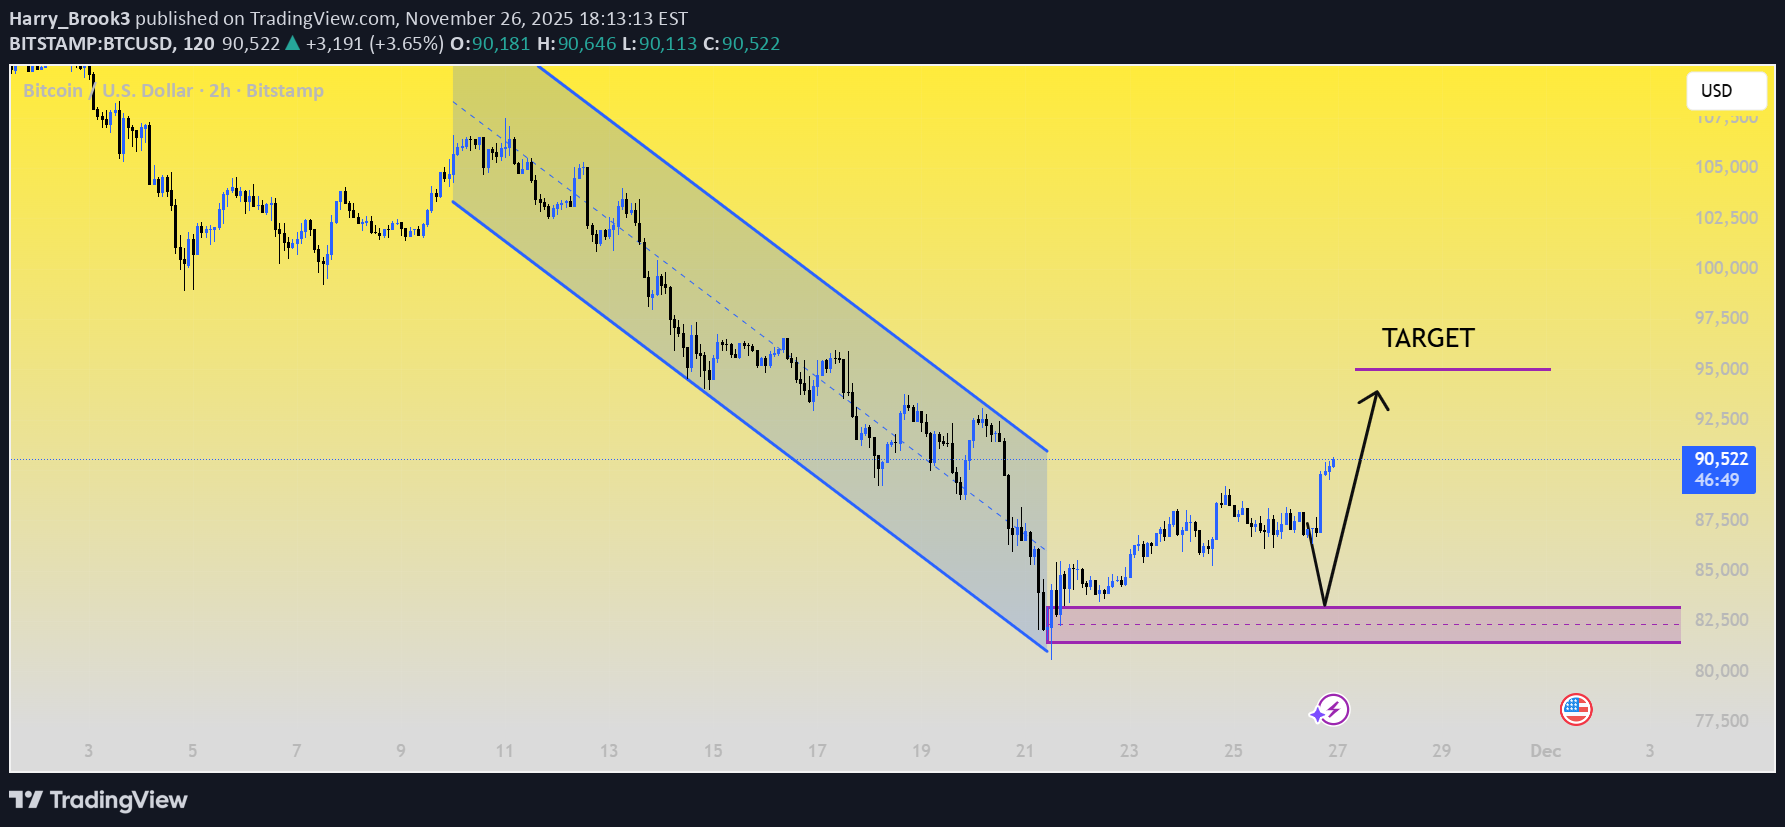
Based on the provided chart of Bitcoin / U.S. Dollar (BTC/USD): 📈 BTC/USD Price Action Summary The chart shows Bitcoin's price movement, highlighting a significant downtrend channel that was active from early to mid-November. Prior Trend: The price experienced a sharp decline within a well-defined parallel channel dropping from approximately $107,500 down to a low near $82,000. Support/Reversal: The downtrend appears to have been broken/ended around November 21st forming a potential support/accumulation zone (marked by the purple box) in the $81,000 - $82,500 area. Current Action Following the break, the price has entered a period of consolidation/uptrend attempt with the current price at $90,332. Projection: An upward projection is indicated suggesting a potential move towards the $95,000 level possibly after a retest of the recent support low (the 'V' shape). In short, the chart depicts a breakout from a bearish channel and a current attempt at recovery, with the price trading above $90,000
شکست صعودی اتریوم: آیا قیمت به ۳۶۵۰ دلار باز میگردد؟
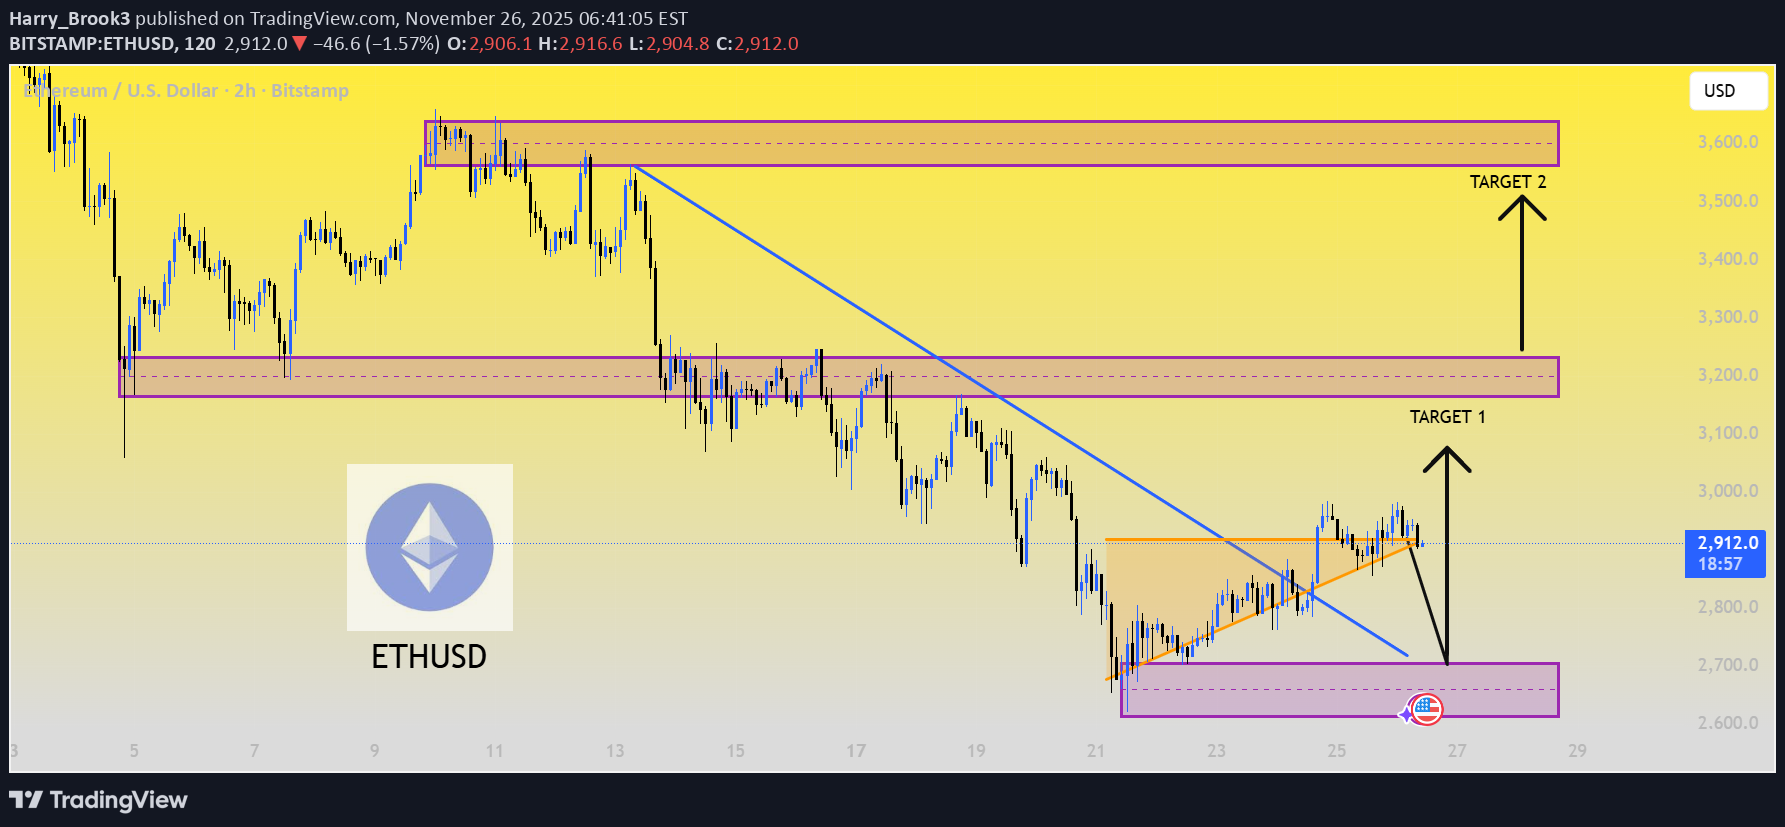
This chart analysis for Ethereum (ETH/USD) on the 2-hour timeframe highlights a recent bullish breakout from a descending trendline and a subsequent bullish pennant (or symmetrical triangle) formation. The price has successfully broken out of a short-term consolidation pattern (marked by the orange triangle), suggesting a potential reversal in the recent downward trend that began around \$3,600. Key Zones and Targets: 1.Support/Demand Zone: The recent price bottoming occurred within the purple support zone (approx.\$2,650 - \$2,750). 2. Immediate Target (Target 1): The first major upside resistance is located at the lower purple consolidation zone (approx. \$3,180 - \$3,250). 3. Secondary Target (Target 2): The next significant resistance and potential target is the higher purple supply zone (approx. \$3,550 - \$3,650), coinciding with the recent high.
سناریوی بعدی بیت کوین: آیا سقوط به ۶۰ هزار دلار قطعی است؟
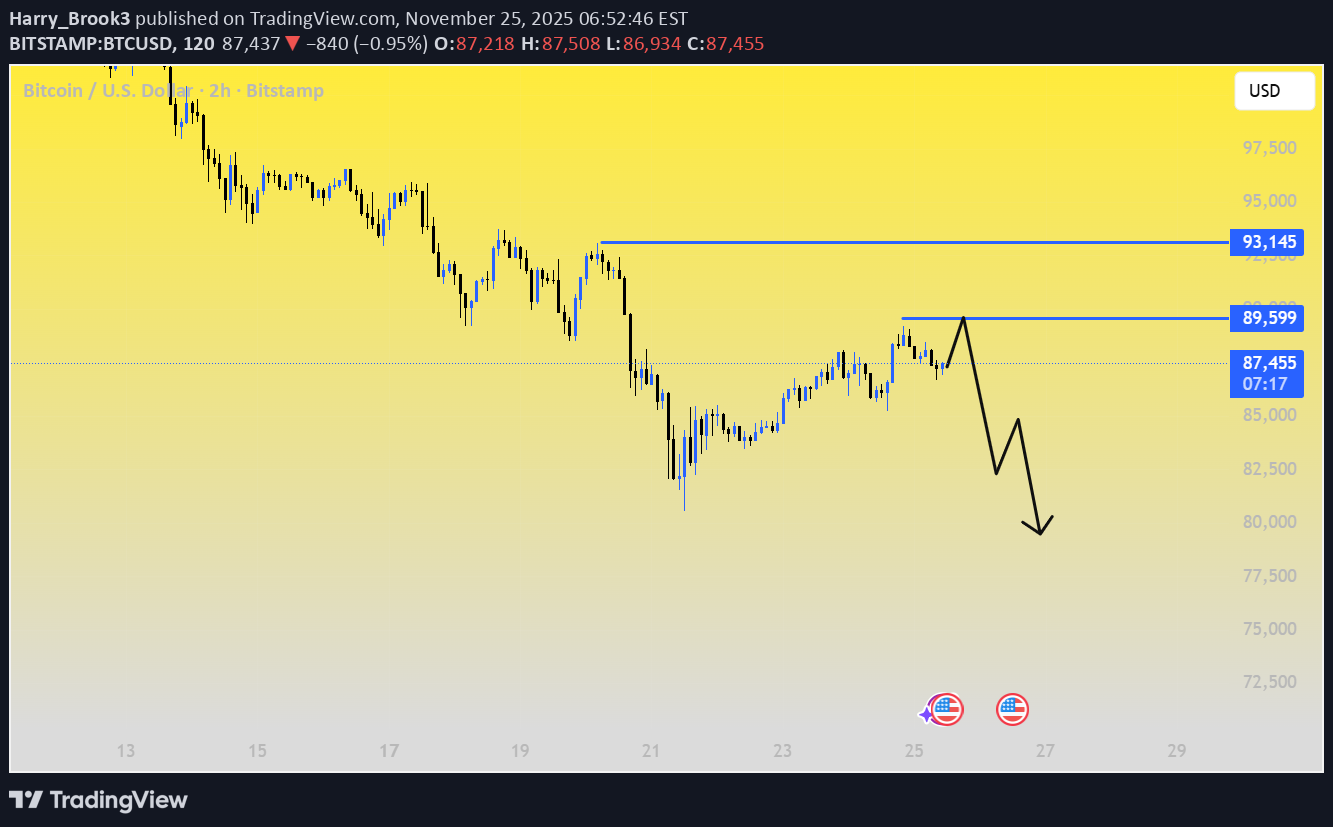
Bitcoin is the world's first and most recognized decentralized cryptocurrency. Invented in 2008 by an unknown person or group under the pseudonym Satoshi Nakamoto, it operates on a peer-to-peer network known as the blockchain. Key Feature: It allows transactions to be conducted directly between users without the need for a central authority, like a bank or government. Supply: Its total supply is capped at 21 million coins, making it a digitally scarce asset. 📉 Current Market Summary (November 25, 2025) As of today, Bitcoin is experiencing a period of significant bearish pressure and market consolidation following a sharp downturn in recent weeks. Price: Trading in the range of approximately $87,000 to $88,000. Recent Trend: Bitcoin has seen its sharpest monthly drop in over three years, falling more than 20% in November alone. This decline came after it failed to hold key psychological levels like $100,000 and $90,000. Key Drivers: Risk-Off Sentiment: Global investor caution due to broader macroeconomic worries, shifting interest rate expectations, and a rotation of capital toward safer assets like the US Dollar and short-term bonds. Institutional Outflows: Significant capital redemptions from spot Bitcoin Exchange-Traded Products (ETPs/ETFs) have been a major factor, indicating cooling institutional demand. Technical Breakdown: The price action has been consistently bearish, failing to reclaim critical resistance levels, with many analysts pointing to strong technical support potentially around the $83,000 level. The overall sentiment in the market remains one of "Extreme Fear" as investors assess whether the recent drop constitutes a deep washout or if further downward movement is likely.
Disclaimer
Any content and materials included in Sahmeto's website and official communication channels are a compilation of personal opinions and analyses and are not binding. They do not constitute any recommendation for buying, selling, entering or exiting the stock market and cryptocurrency market. Also, all news and analyses included in the website and channels are merely republished information from official and unofficial domestic and foreign sources, and it is obvious that users of the said content are responsible for following up and ensuring the authenticity and accuracy of the materials. Therefore, while disclaiming responsibility, it is declared that the responsibility for any decision-making, action, and potential profit and loss in the capital market and cryptocurrency market lies with the trader.