Technical analysis by Harry_Brook3 about Symbol BTC on 11/26/2025

تحلیل بیت کوین: آیا ریزش تمام شد؟ حرکت بعدی BTC به سمت ۹۵ هزار دلار!
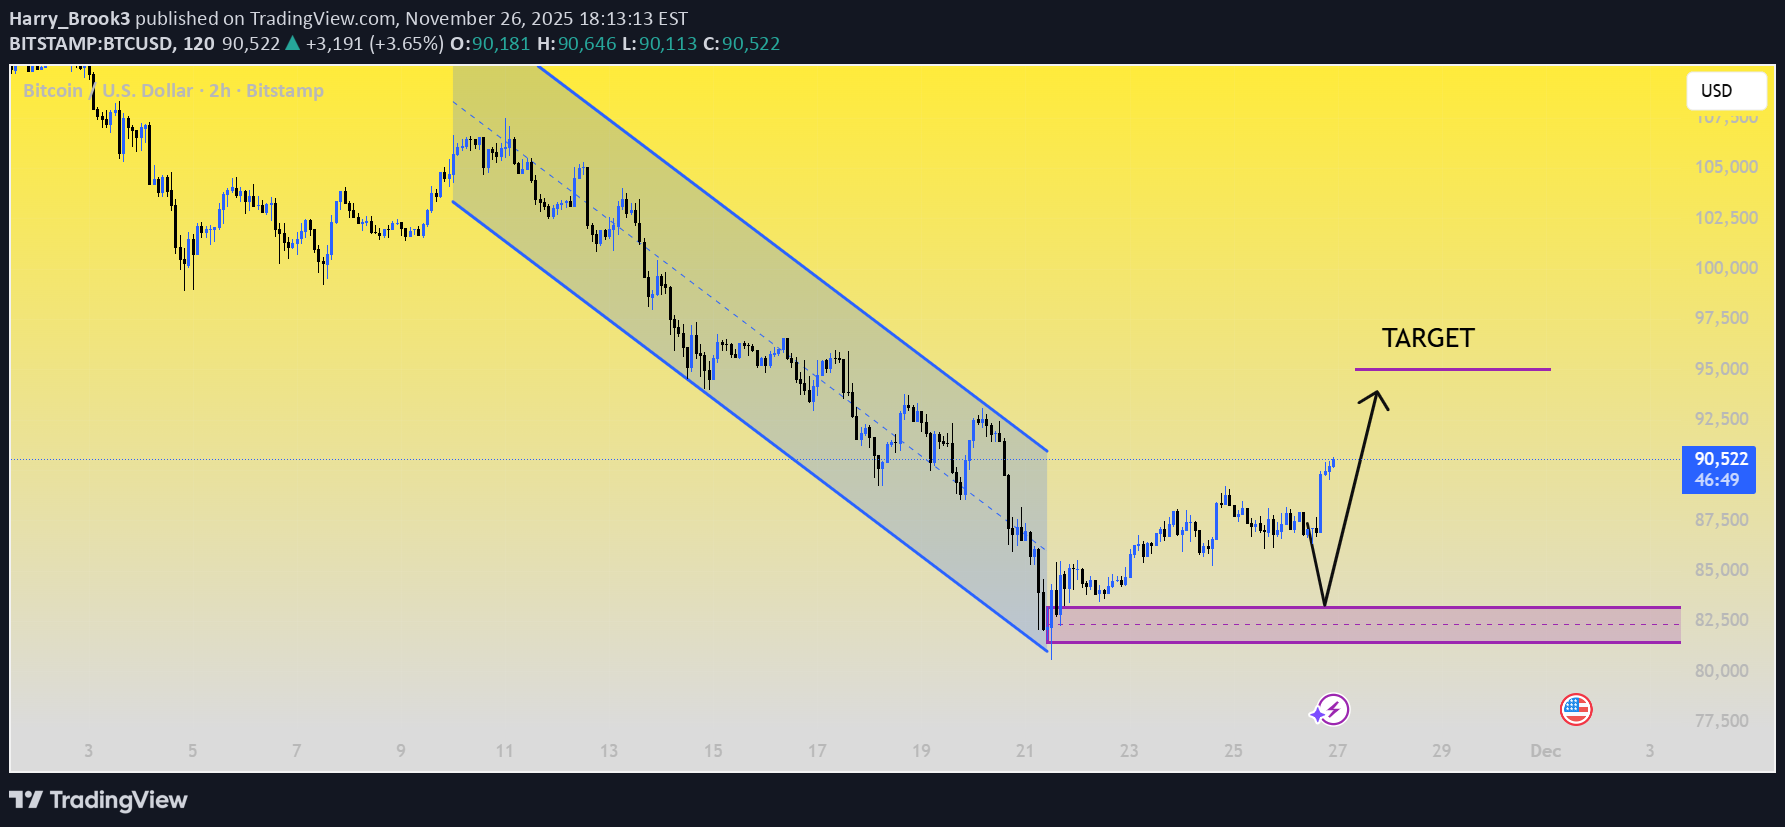
Based on the provided chart of Bitcoin / U.S. Dollar (BTC/USD): 📈 BTC/USD Price Action Summary The chart shows Bitcoin's price movement, highlighting a significant downtrend channel that was active from early to mid-November. Prior Trend: The price experienced a sharp decline within a well-defined parallel channel dropping from approximately $107,500 down to a low near $82,000. Support/Reversal: The downtrend appears to have been broken/ended around November 21st forming a potential support/accumulation zone (marked by the purple box) in the $81,000 - $82,500 area. Current Action Following the break, the price has entered a period of consolidation/uptrend attempt with the current price at $90,332. Projection: An upward projection is indicated suggesting a potential move towards the $95,000 level possibly after a retest of the recent support low (the 'V' shape). In short, the chart depicts a breakout from a bearish channel and a current attempt at recovery, with the price trading above $90,000