Technical analysis by Harry_Brook3 about Symbol ETH on 11/26/2025

شکست صعودی اتریوم: آیا قیمت به ۳۶۵۰ دلار باز میگردد؟
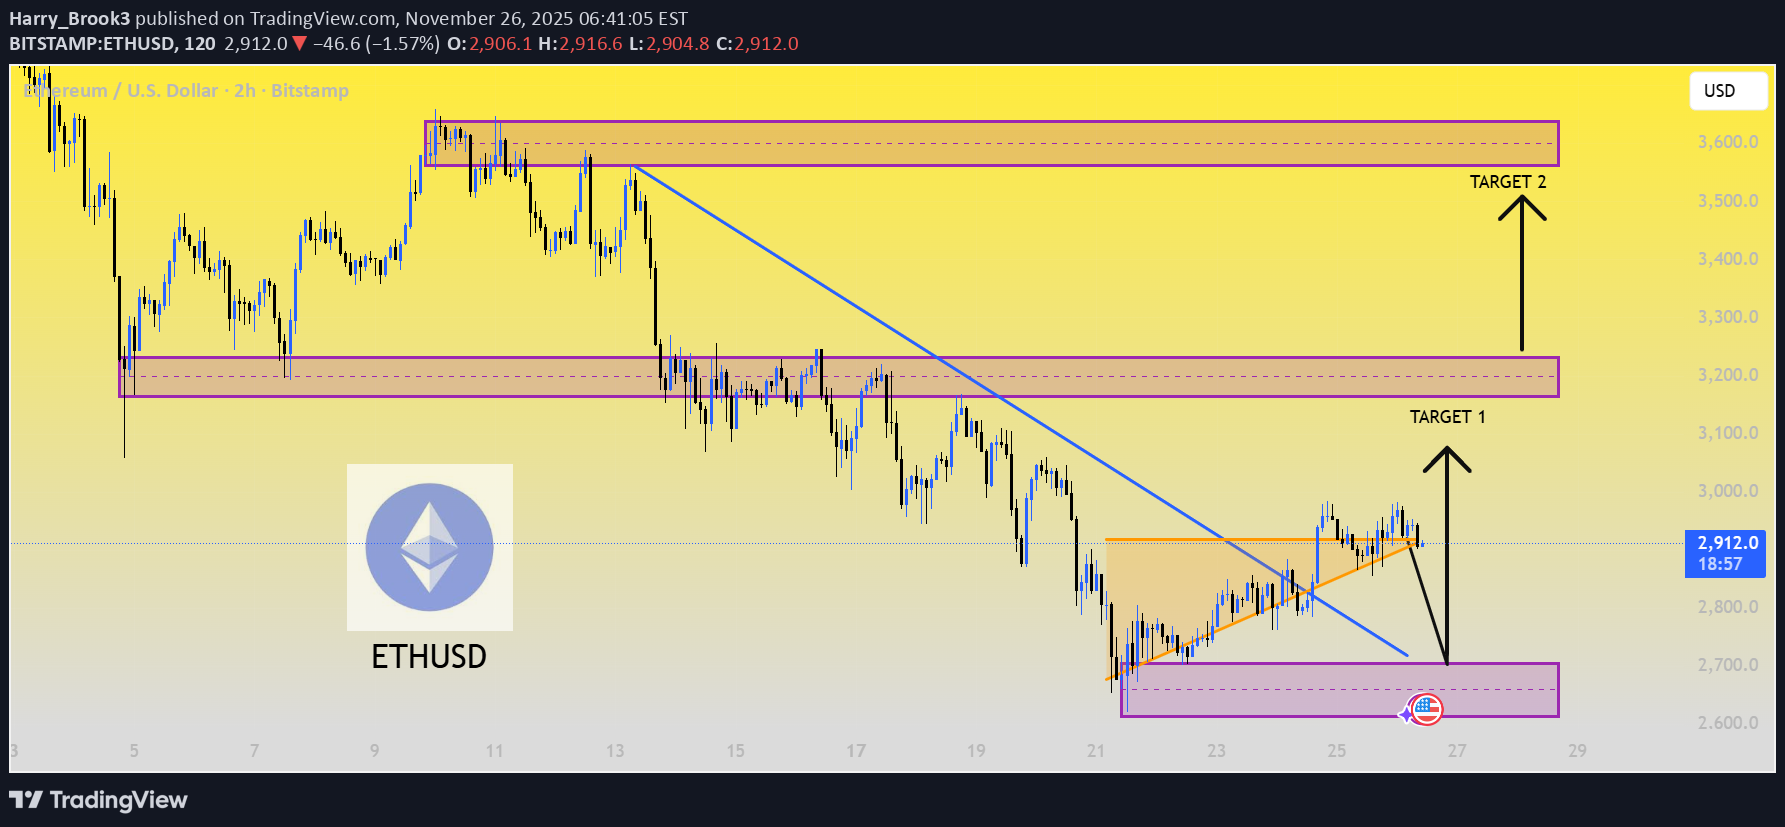
This chart analysis for Ethereum (ETH/USD) on the 2-hour timeframe highlights a recent bullish breakout from a descending trendline and a subsequent bullish pennant (or symmetrical triangle) formation. The price has successfully broken out of a short-term consolidation pattern (marked by the orange triangle), suggesting a potential reversal in the recent downward trend that began around \$3,600. Key Zones and Targets: 1.Support/Demand Zone: The recent price bottoming occurred within the purple support zone (approx.\$2,650 - \$2,750). 2. Immediate Target (Target 1): The first major upside resistance is located at the lower purple consolidation zone (approx. \$3,180 - \$3,250). 3. Secondary Target (Target 2): The next significant resistance and potential target is the higher purple supply zone (approx. \$3,550 - \$3,650), coinciding with the recent high.