
Gwen_Humuna
@t_Gwen_Humuna

What symbols does the trader recommend buying?
Purchase History
پیام های تریدر
Filter
Signal Type
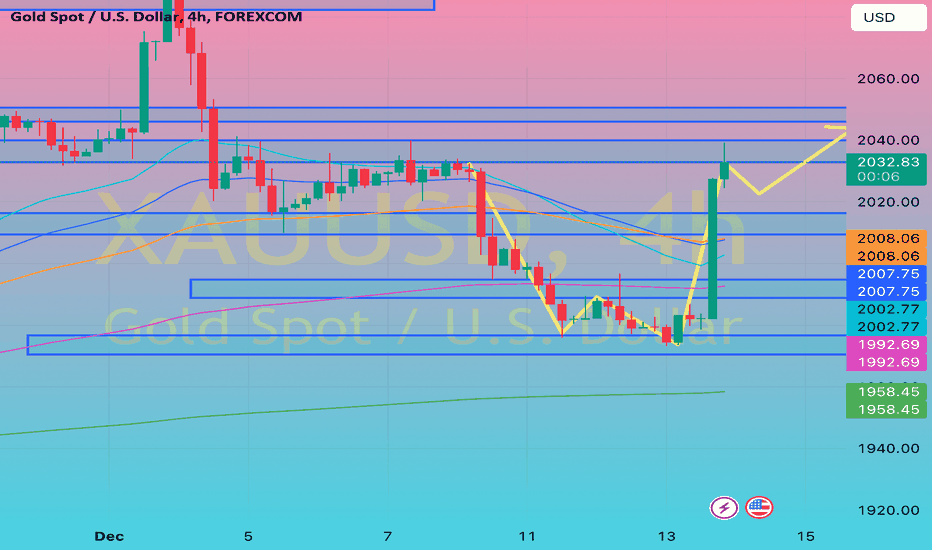
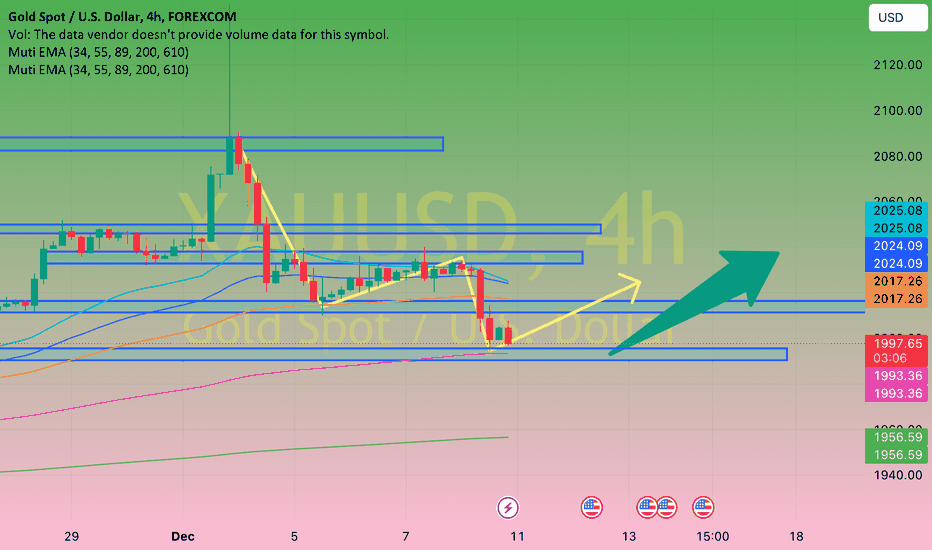
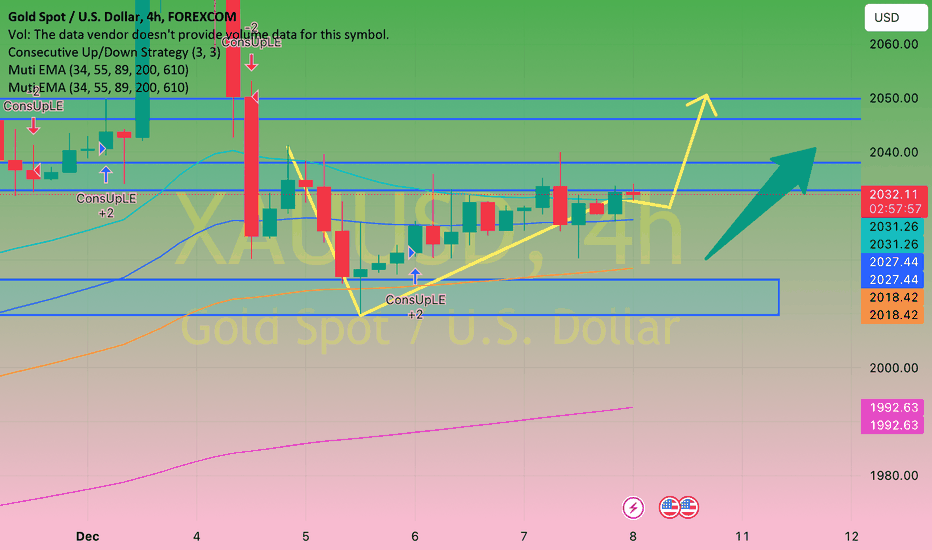
Gold prices remained relatively unchanged on Wednesday, with XAU/USD hovering around $1,980.00. The financial market is in a wait-and-see mode ahead of the Federal Reserve's monetary policy announcement, the final one for 2023. Back in September, the Summary of Economic Projections (SEP) or dot plot indicated officials still projected a final rate higher than the current 5.25%-5.50% rate. However, policymakers have tempered rate hikes in the two most recent meetings, and the likelihood of a rate hike today is almost negligible. Interest rate futures have long been priced at the tail end of tightening monetary policy, disregarding officials' warnings against it. Furthermore, investors are predicting multiple rate cuts in 2024, starting as early as the second quarter. The SEP will then define the direction of the US dollar, as this document may illuminate what policymakers believe could unfold in the coming years. In addition, Chairman Jerome Powell will hold a press conference to explain the Federal Open Market Committee's (FOMC) decision. Powell's words will also be scrutinized for hints about future actions. The US dollar might react to market sentiment, decreasing in value if investors become more optimistic and opt for higher-yielding assets.
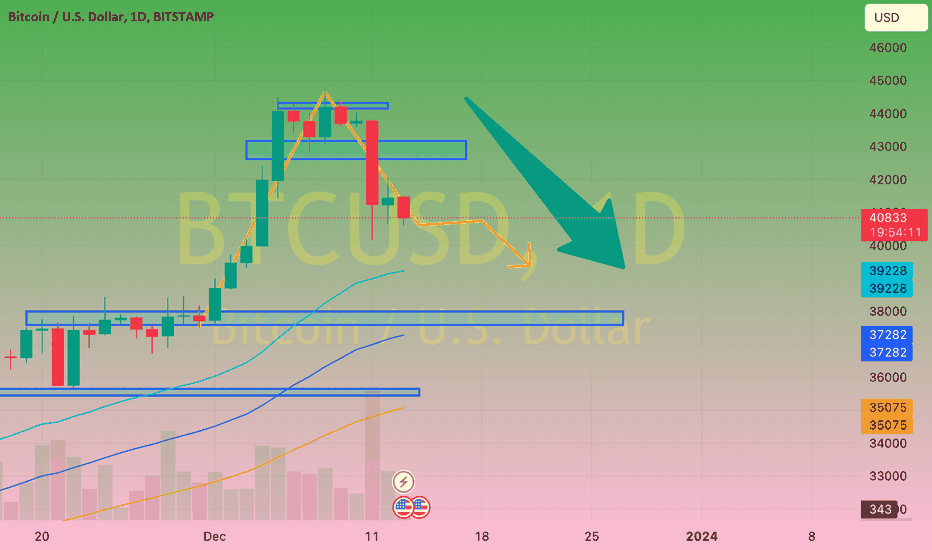
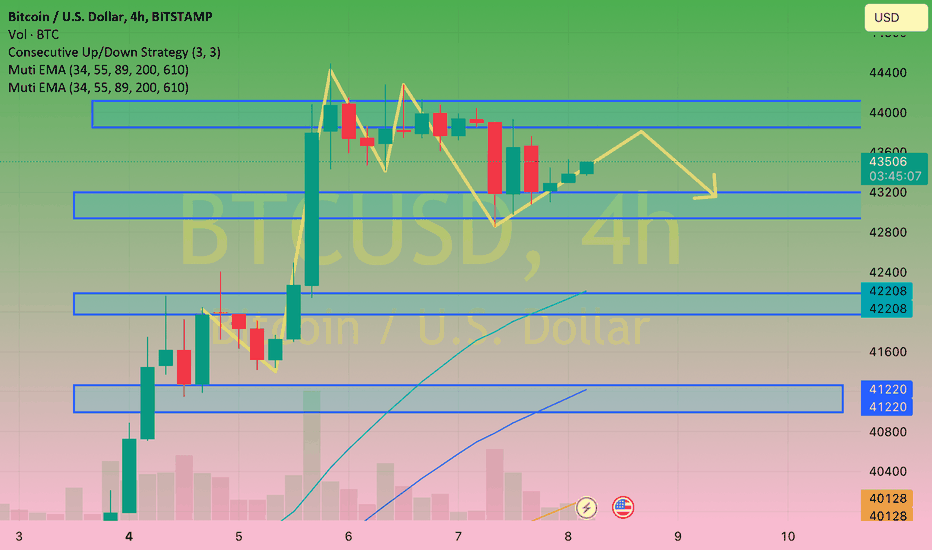
Bitcoin (BTC) is showing weakness ahead of the Federal Open Market Committee (FOMC) meeting scheduled for December 13. Federal Reserve Chairman Jerome Powell is expected to provide an economic forecast summary after the release of the Consumer Price Index (CPI) data, indicating that inflation in the U.S. has decreased to 3.1%, aligning with market expectations. Bitcoin Price Prepares for Increased Volatility Before FOMC Investors have shown caution and reduced risk ahead of the FOMC meeting, evident in a 40% decrease in trading volume over the past 24 hours. After the announcement of the U.S. CPI data for November, the Bitcoin price briefly surged to $42,000 before retracing. Looking ahead, the prevailing view is that the Fed will maintain interest rates at the target range of 5.25-5.50%. In the latest meeting in November, the FOMC kept interest rates steady, as in the September meeting, signaling that rates may remain unchanged in the near future but are still open to change based on economic conditions. The decision to pause interest rate hikes is widely anticipated, providing the Fed with additional time to determine whether the current interest rates effectively curb inflation's impact on economic growth. The range of 5.25% to 5.50% was raised in the July meeting, marking the 11th interest rate hike in the 2022/2023 cycle, all aimed at managing inflation. This explains the observed unease in the Bitcoin price. Implications for Bitcoin Price The increase in interest rates makes investors more cautious, negatively impacting risk-based assets like cryptocurrencies. According to the CME FedWatch tool, there is a 97.1% chance that the Fed will keep the Federal Funds Rate target at 5.25% to 5.50% in the upcoming FOMC meeting, while 2.9% of opinion polls predict a change to 5.50-5.75%.
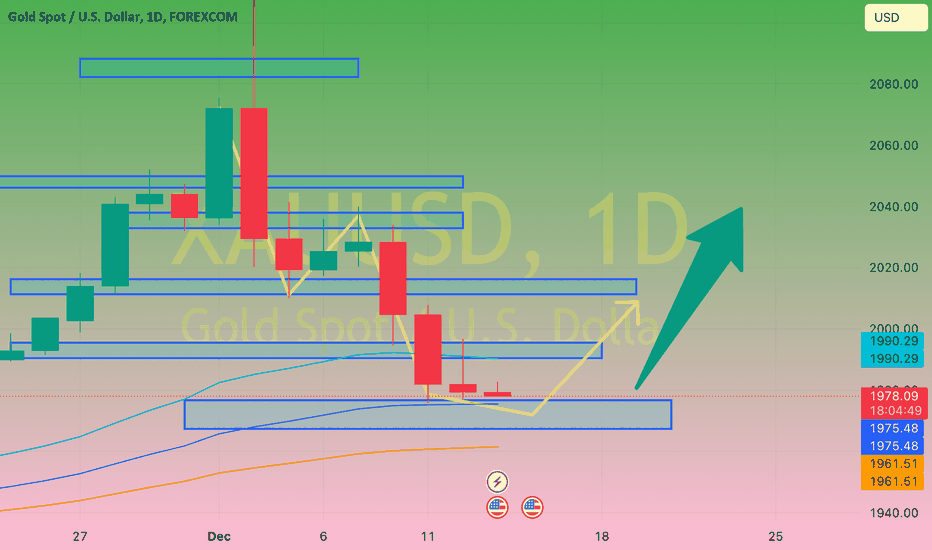
Gold prices traded within a narrow range during the Asian session on Wednesday, hovering around $1,980, just above the three-week low touched on Monday. The precious metal saw a slight increase on Tuesday after the U.S. released consumer inflation data. Gold prices remained relatively unchanged on Tuesday, with XAU/USD fluctuating around $1,980.00. The U.S. Dollar started the day with a subdued tone as improved Asian stock market performance prompted investors to move away from safe-haven currencies. However, investors remained cautious ahead of the U.S. Consumer Price Index (CPI) announcement. The report met expectations, showing a 0.1% increase in the monthly CPI and a 3.1% year-on-year CPI, slightly lower than the previous 3.2%. Finally, the core annual measure stood at 4%, aligning with expectations and October's figures. XAU/USD reached its intraday high at $1,996.68 in immediate response to this news, but the Greenback quickly changed direction, cutting losses due to inflation. Investors are trying to anticipate the Federal Reserve's (Fed) monetary policy stance. The central bank will make its announcement on Wednesday, and investors expect them to keep interest rates unchanged for the third consecutive meeting. What investors are looking for is clues about when policymakers will reverse the significant rate hikes and start cutting rates throughout 2024. Stable inflation partly weighs on the rate-cutting outlook, causing short-term concerns and benefiting the USD.

Content: Bitcoin is experiencing its most significant drop in nearly a month, catching the market off guard on Monday, shattering the optimism, also known as "hopium," for continued price growth until the SEC approves the BTC spot ETF in January 2024. However, the sudden market downturn has left investors surprised, leading to this optimism being shattered, attributed to the "whale panic" caused by significant whale selling. Daily Market Momentum Report: Bitcoin Whales Trigger Market Plunge Bitcoin's price has nearly dropped below $40,000 in the last 24 hours, with contracts worth over $340 million liquidated in just a few minutes. Although the exact reason behind this collapse is uncertain, the primary cause seems to be whale selling. This is evidenced by the Coinbase Premium Gap (CPG) registering a sharp decrease to -250. Simply put, CPG is an indicator that tracks the difference between the Bitcoin price listed on Coinbase (USD pair) and Binance (USDT pair). It provides an idea of whether US-dominant investors (Coinbase) or global users (Binance) are buying or selling more than the other. Whenever this premium gap is positive, US investors are considered to be driving buying pressure, while negative values point to global users, creating selling pressure. However, the significant drop in this index on Monday indicates whale intervention. This was further confirmed by the decline in reserves on the Binance exchange, noting the sale of around 16,000 BTC worth over $671 million accumulated over the past week. This sell-off has caused panic among users, resulting in a 7% intraday trading drop, pushing BTC to a low of $40,654. Cryptocurrency has since recovered, trading at $41,839 at the time of writing. Since the beginning of December, traders have been limiting exposure to high leverage in the derivatives market. The collapse on Monday may heighten this skepticism, causing traders to be cautious until January.
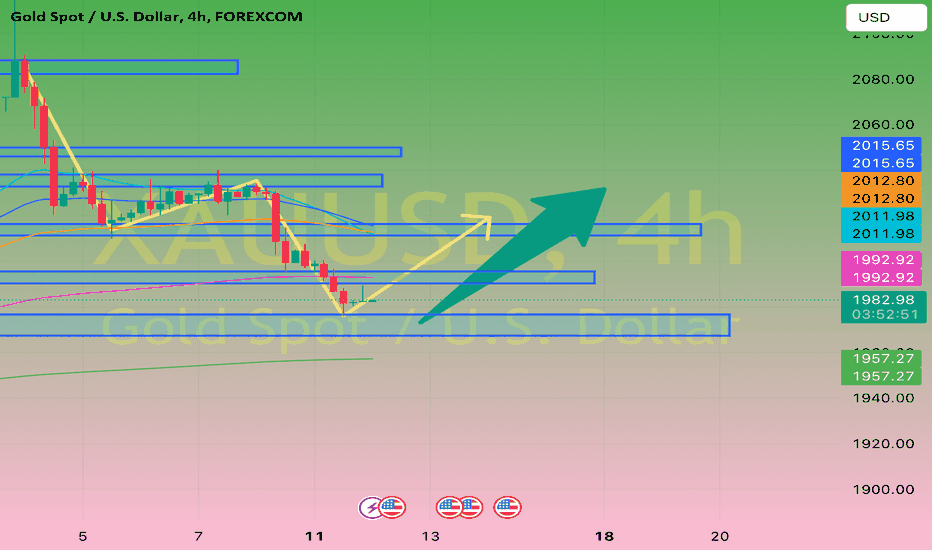
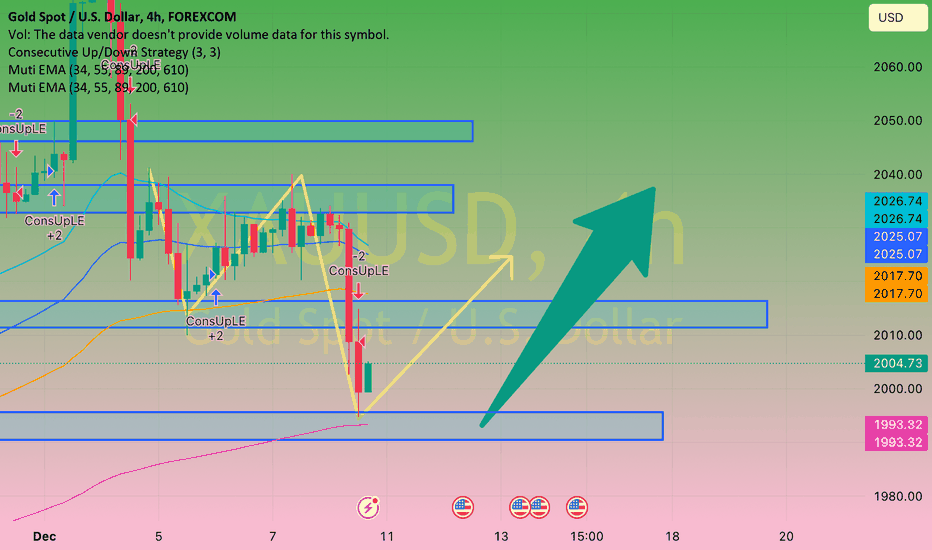
Spot gold continues its downward slide on Monday, dropping below the $2,000 threshold and easing into the nearby range of $1,980 as the market gears up for new inflation data with the US Consumer Price Index on Tuesday. XAU/USD has seen sharp declines for two consecutive days, signaling potential for an extended downtrend. Technical indicators on the daily chart reflect strong selling pressure as the pair breaks below the 20-day Simple Moving Average (SMA), maintaining a downward slope. Longer-term SMAs lack upward momentum, setting target levels around $1,930 to $1,950. Finally, technical indicators are descending into negative territory, aligning with lower lows. Looking ahead and on the 4-hour chart, risks lean towards the downside. XAU/USD accelerates its decline after breaking below the flat 200-period SMA, while the 20-period SMA crosses below the 100-period SMA from above—a sign of increased selling pressure. Meanwhile, technical indicators are heading south around oversold levels without showing signs of divergence. Gold hit a low of $1,976.26 on November 20, a breaking point confirming the continuation of the downward trend in the upcoming trading sessions. Support levels: $1,976.26, $1,959.40, $1,946.00 Resistance levels: $1,994.40, $2,001.70, $2,014.20
Gold prices are extending their trading range into the fourth consecutive day on Friday as investors exercise caution ahead of the highly anticipated US Non-Farm Payrolls (NFP) data scheduled for later in the day. The US NFP report could provide fresh impetus for gold prices. Currently, gold is oscillating without clear direction as traders refrain from making new bets on the US Dollar (USD) ahead of crucial US employment data. The USD is nursing wounds after a sharp decline, notably against the Japanese Yen. The USD/JPY pair dropped over 500 pips on Thursday, pushing the exchange rate to a new 4-month low of 141.63. Market participants hope for an earlier-than-expected policy adjustment by the Bank of Japan (BoJ). Despite the USD sell-off, gold prices are not benefiting, as US Treasury bond yields recover strongly from multi-month lows. This diminishes the appeal of non-interest-bearing gold. Markets are repositioning in US government bonds and the USD as they seek to lock in profits ahead of the Federal Reserve's (Fed) interest rate decision next week. Meanwhile, the eagerly awaited US labor market data is under scrutiny for new clues regarding the Fed's interest rate outlook. The market is pricing in around a 60% chance of a rate cut in March. The NFP data is expected to reveal an addition of 180,000 jobs in November, compared to the previous job growth of 150,000. Average hourly earnings, a measure of wage inflation, are predicted to rise by 4.0% YoY in November. The latest US ADP employment and JOLTS data indicate loosening labor market conditions. If the weak US NFP print confirms this trend, expectations for a Fed rate cut could surge, undermining the USD and US Treasury bond yields. In such a scenario, gold prices may sustainably reclaim the $2,050 barrier. Conversely, if the data significantly exceeds expectations, the market could use it as a reason to take profits ahead of the Fed's decision, and gold price adjustments may continue toward the $2,000 level.
Gold broke below the daily range, dropping to $2,010 after the optimistic US job report. While XAU/USD attempted a recovery to $2,020, rising US bond yields triggered another price decline. Observing the daily chart, Gold formed higher lows after a volatile Monday session, indicating potential for a new uptrend. The Relative Strength Index (RSI) in 14 days is higher than the midpoint, supporting Gold's potential for upward movement. Gold buyers need to find acceptance above the $2,050 region for further progress towards $2,100. New buying opportunities may emerge above this level, aiming for the all-time high of $2,144. On the flip side, immediate support is seen at $2,009, and below this, the $2,000 level poses a significant test for trend-following traders. At this level, the 21-day Simple Moving Average (SMA) will align. The next downside price cushion is identified around the round figure of $1,980.
Bitcoin has frequently been compared to Gold over the years. Initially deemed a "safe haven" similar to Gold, analysts are currently evaluating these two investments to determine if Bitcoin meets the criteria as "Gold on steroids." Relative returns are adjusted for the risk of Bitcoin compared to Gold. Over the past 5 years, up to November, Bitcoin's Sharpe Ratio has competed favorably when compared to Gold and other proven asset classes in the market. The Sharpe Ratio is defined as the difference between the return of an investment and the risk-free rate divided by the standard deviation of the investment. Simply put, the Sharpe Ratio adjusts performance for risk beyond what investors would bear for a specific asset. Jurrien Timmer, Global Macro Economic Director at Fidelity, notes that Bitcoin's correlation with the S&P 500 (+40%) is higher than that of Gold (+14%) over a 5-year period. However, the correlation between BTC and the US stock market has decreased over the years and is lower than most asset classes. Over the past 12 months, the correlation between BTC and the S&P 500 has decreased from 40% to 25%. Timmer argues that Bitcoin is more volatile than most other assets, but the volatility impacts both ways, and BTC investments have their own risk-reward characteristics, as seen in the past decade. According to a CoinShares report, institutional investors continue to pour money into Bitcoin funds, with a weekly inflow of $132.8 million as of December 4th. At the time of writing, the price of Bitcoin is $44,162 on Binance.
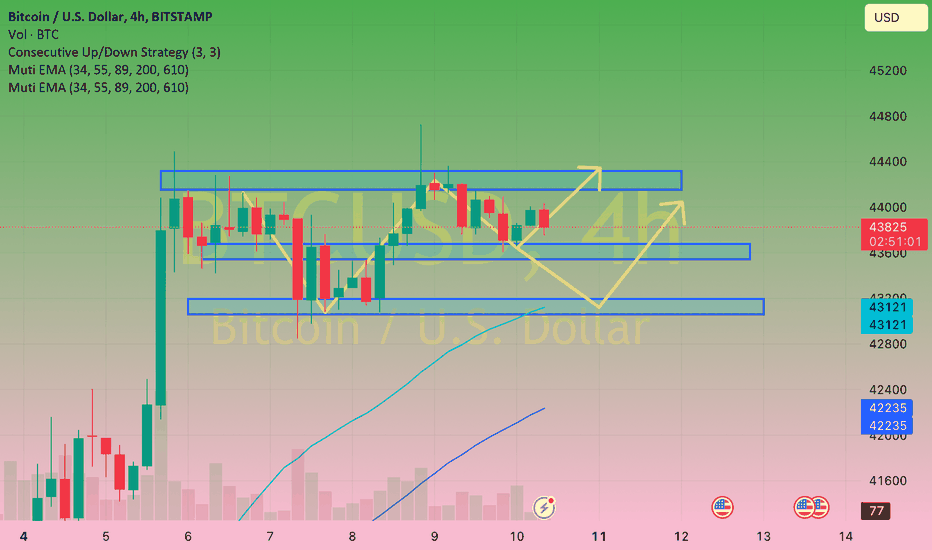
Bitcoin price faces potential decline Bitcoin is currently trading at $43,241 after failing to surpass the $44,500 level, leading to minor adjustments. While broader market prospects suggest an upward trend at the time of writing, the short-term picture leans slightly towards a downward trajectory. This is evidenced by the Moving Average Convergence Divergence (MACD) indicator. The diminishing green bars indicate a weakening upward trend, implying vulnerability to a Bitcoin price drop. However, BTC is likely to drop back to $42,000 or even $40,000 if the previously established support levels are breached. This is a short-term scenario, pending a stronger-than-expected NFP report. Yet, if the report is weaker or broader market signals turn bullish, a recovery from the $42,000 level becomes plausible. This would propel an upward movement, pushing Bitcoin prices beyond $44,500 and negating the bearish outlook.
Gold set a new all-time high this week at $2,144.48 in a strong rally on Monday, and XAU/USD spent the rest of the week trading above $2,000 after easing from Monday's opening surge. The focus now turns to the US NFP data to provide new directional momentum. Observing the daily chart, Gold has established higher lows after a volatile trading session on Monday, indicating more opportunities for a new uptrend. The 14-day Relative Strength Index (RSI) above the midline supports the potential for Gold's upward movement. Gold buyers need to find acceptance above the $2,050 region to make further progress towards the $2,100 level. New buying opportunities will emerge above this level, targeting the all-time high of $2,144. On the flip side, immediate support is seen at Tuesday's low of $2,009, below which the $2,000 level will be a crucial test for trend-following traders. At that level, the 21-day Simple Moving Average (SMA) will align. The next downside cushion is identified around the round number of $1,980.
Disclaimer
Any content and materials included in Sahmeto's website and official communication channels are a compilation of personal opinions and analyses and are not binding. They do not constitute any recommendation for buying, selling, entering or exiting the stock market and cryptocurrency market. Also, all news and analyses included in the website and channels are merely republished information from official and unofficial domestic and foreign sources, and it is obvious that users of the said content are responsible for following up and ensuring the authenticity and accuracy of the materials. Therefore, while disclaiming responsibility, it is declared that the responsibility for any decision-making, action, and potential profit and loss in the capital market and cryptocurrency market lies with the trader.