
Greenfireforex
@t_Greenfireforex

What symbols does the trader recommend buying?
Purchase History
پیام های تریدر
Filter
Signal Type
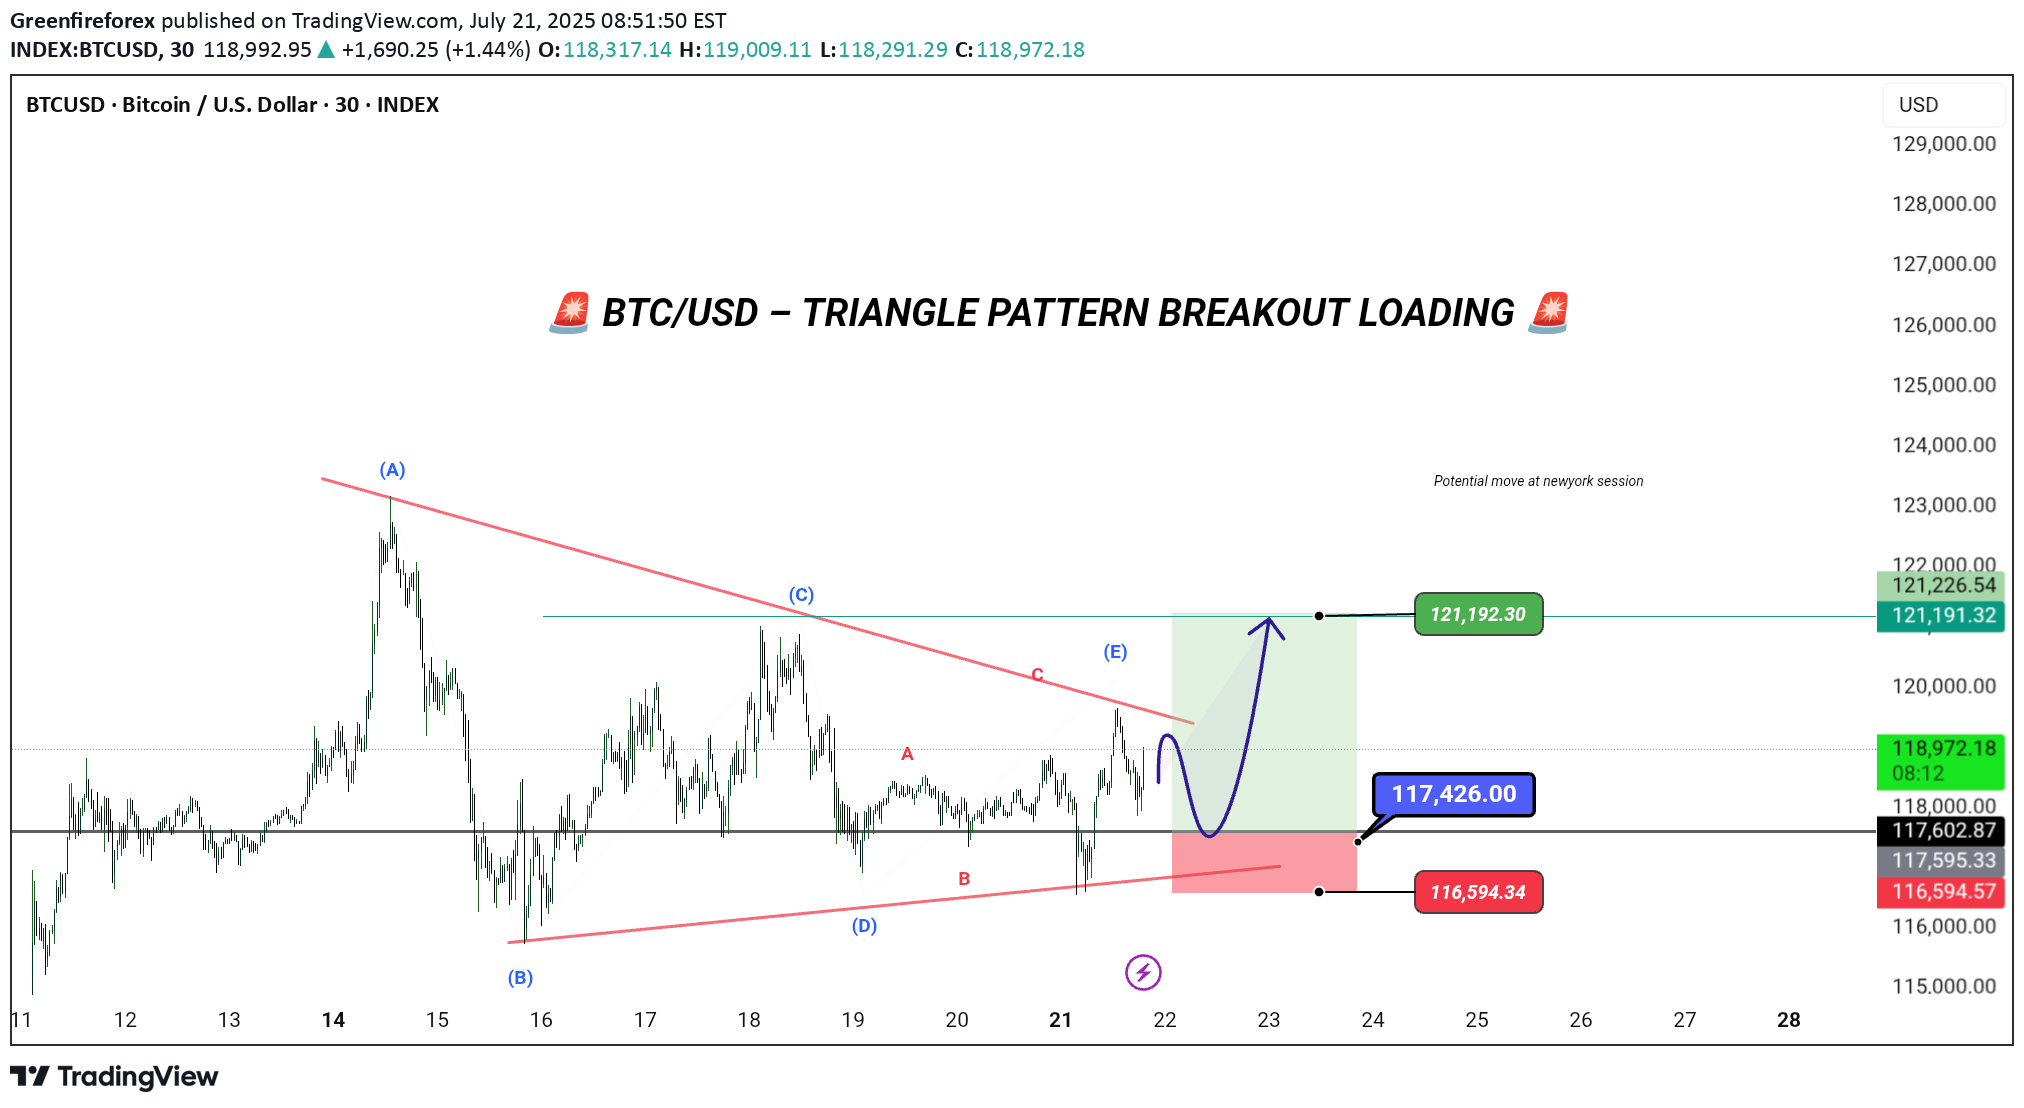
We’re coiling up like a spring 🌀 inside this textbook triangle structure — and the breakout is about to go BOOM. 👀 Watch the (E) Wave closely. This is where smart money traps the late sellers. Once price taps the 117.4K zone, expect a sharp reversal up. 🎯 Target: 121,192 📍 Entry: 117,426 ❌ Stop Loss: 116,594 💡 Logic: Classic Elliott Wave triangle → ABCDE complete → final breakout wave incoming. This setup is cleaner than a fresh fade. Don’t sleep on it 😴 🧠 PATIENCE = POWER Let the market show its hand — then snipe your entry. 🎯 🕒 Timeframe: 30M ⚙️ Strategy: Elliott Triangle + Breakout Play ---
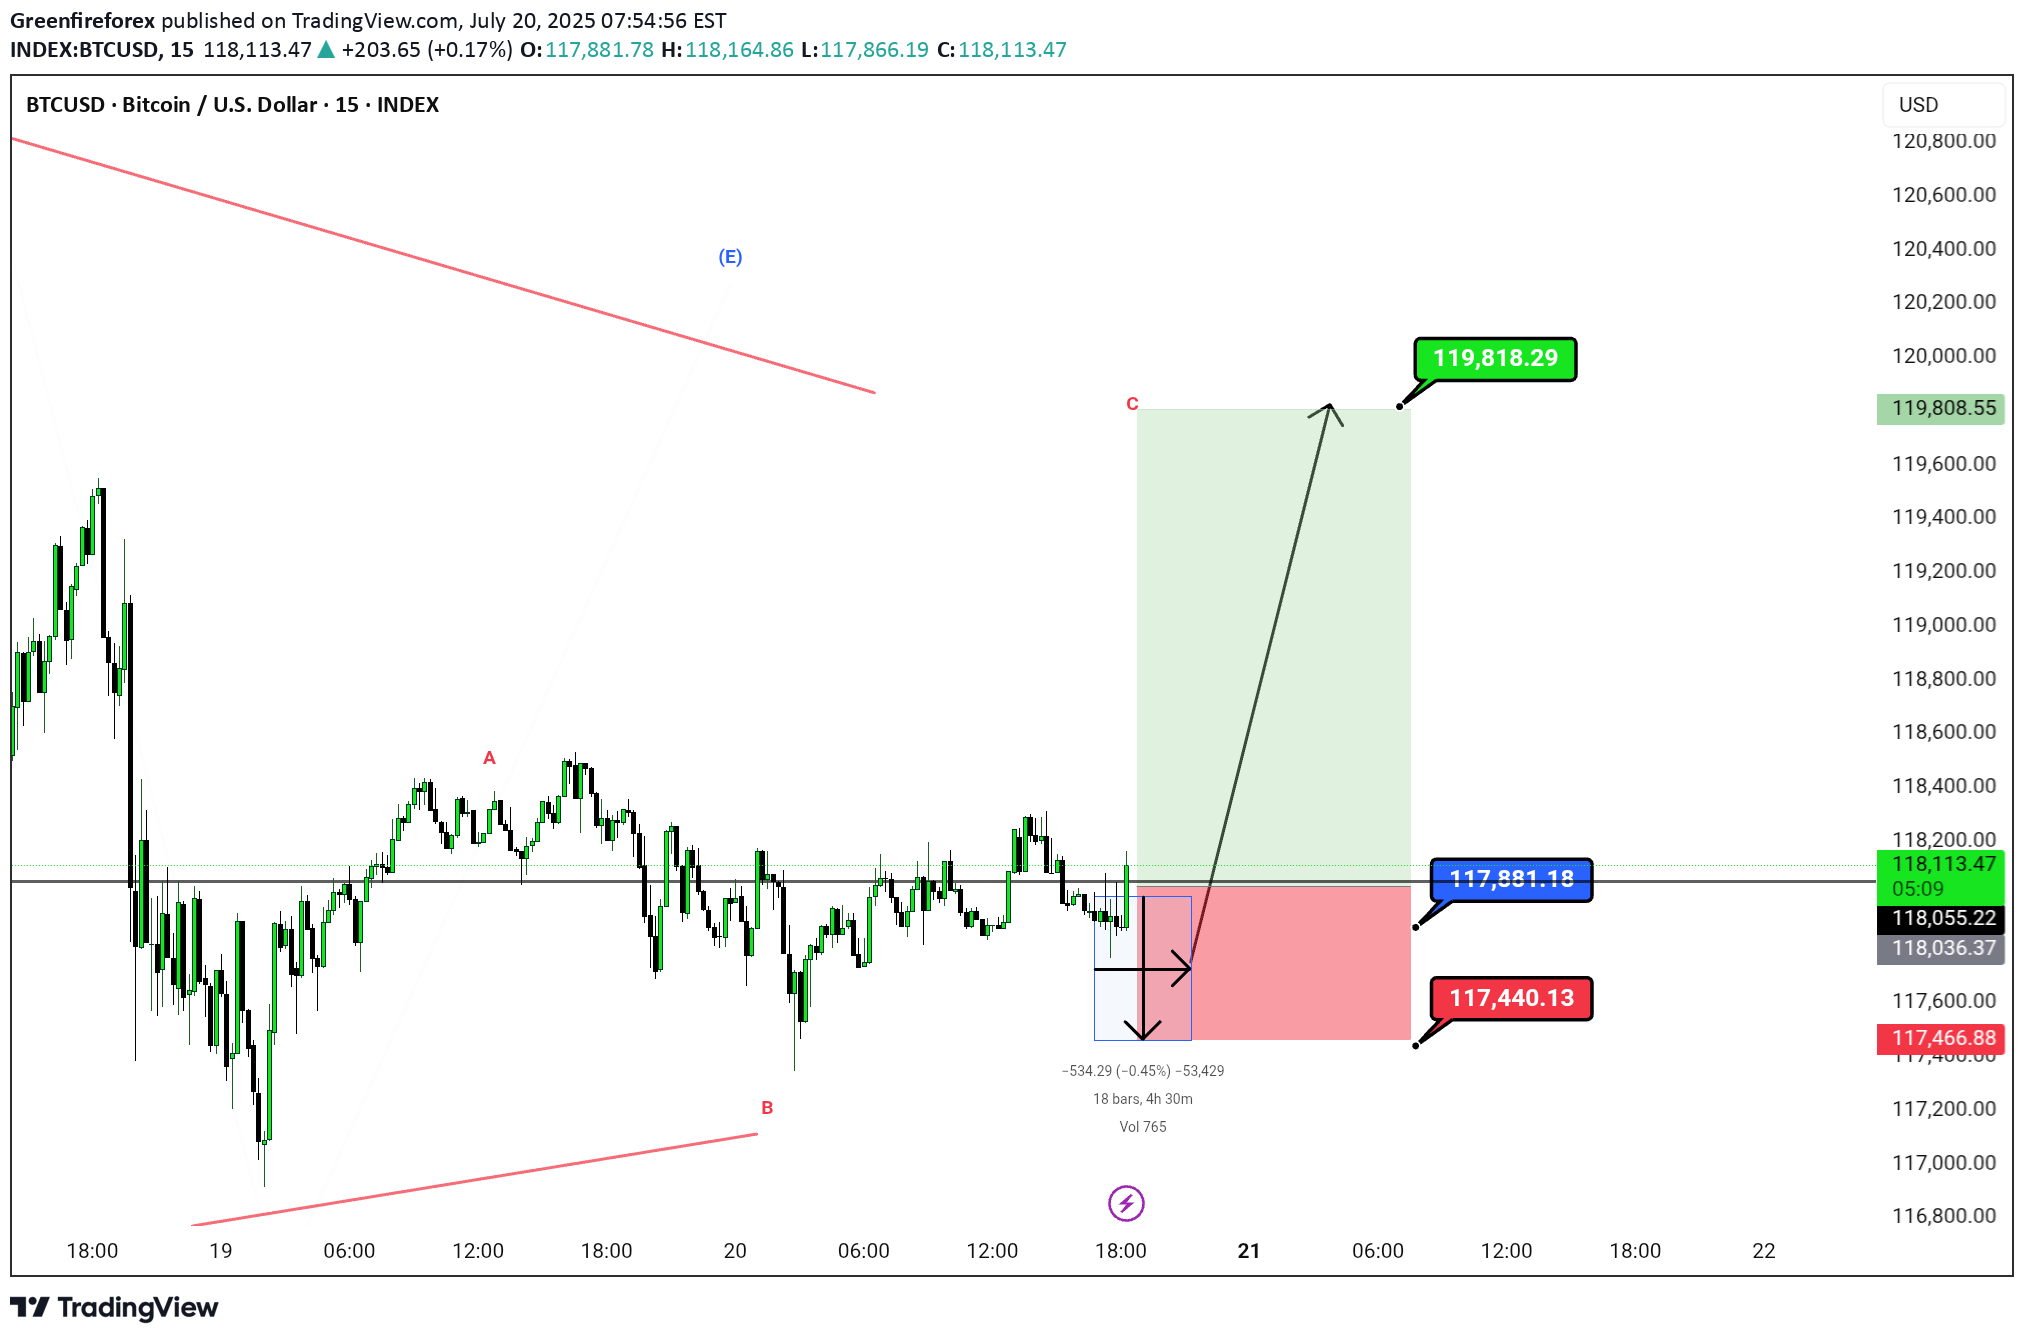
This chart shows a 15-minute timeframe analysis for BTC/USD (Bitcoin/US Dollar) using Elliott Wave . --- 📊 Chart Summary: Wave Structure: Labeled with corrective wave A–B–C, indicating the end of a corrective pattern. Price is currently in the potential reversal zone near Wave B, suggesting a bullish move toward Wave C completion. --- ✅ Trade Setup: Entry Zone: Around current price levels (≈117,889.74) Stop Loss (SL): 117,440.13 (marked in red) Target (TP): 119,818.29 (marked in green) Risk-to-Reward Ratio (RRR): Approx. 1:4, a favorable trade setup --- 🔍 Key Technical Observations: Bullish Projection: A large green zone indicating strong bullish momentum if Wave C plays out. Invalidation Zone: Price falling below 117,440.13 would invalidate the bullish count. Volume Marker: Small thunderbolt symbol at the bottom could imply a volume spike or a critical event time. Chart Title: Published under Greenfireforex branding, timestamped Jul 20, 2025, likely indicating a public or private analysis post. --- 📌 Possible Interpretation: This chart suggests a buy opportunity for BTCUSD if price respects the bottom zone (117,440) and begins to climb toward the projected target (119,818). It uses wave theory logic assuming this is a Wave C rally, and price has completed a corrective move. I'm ready to answer in comments session
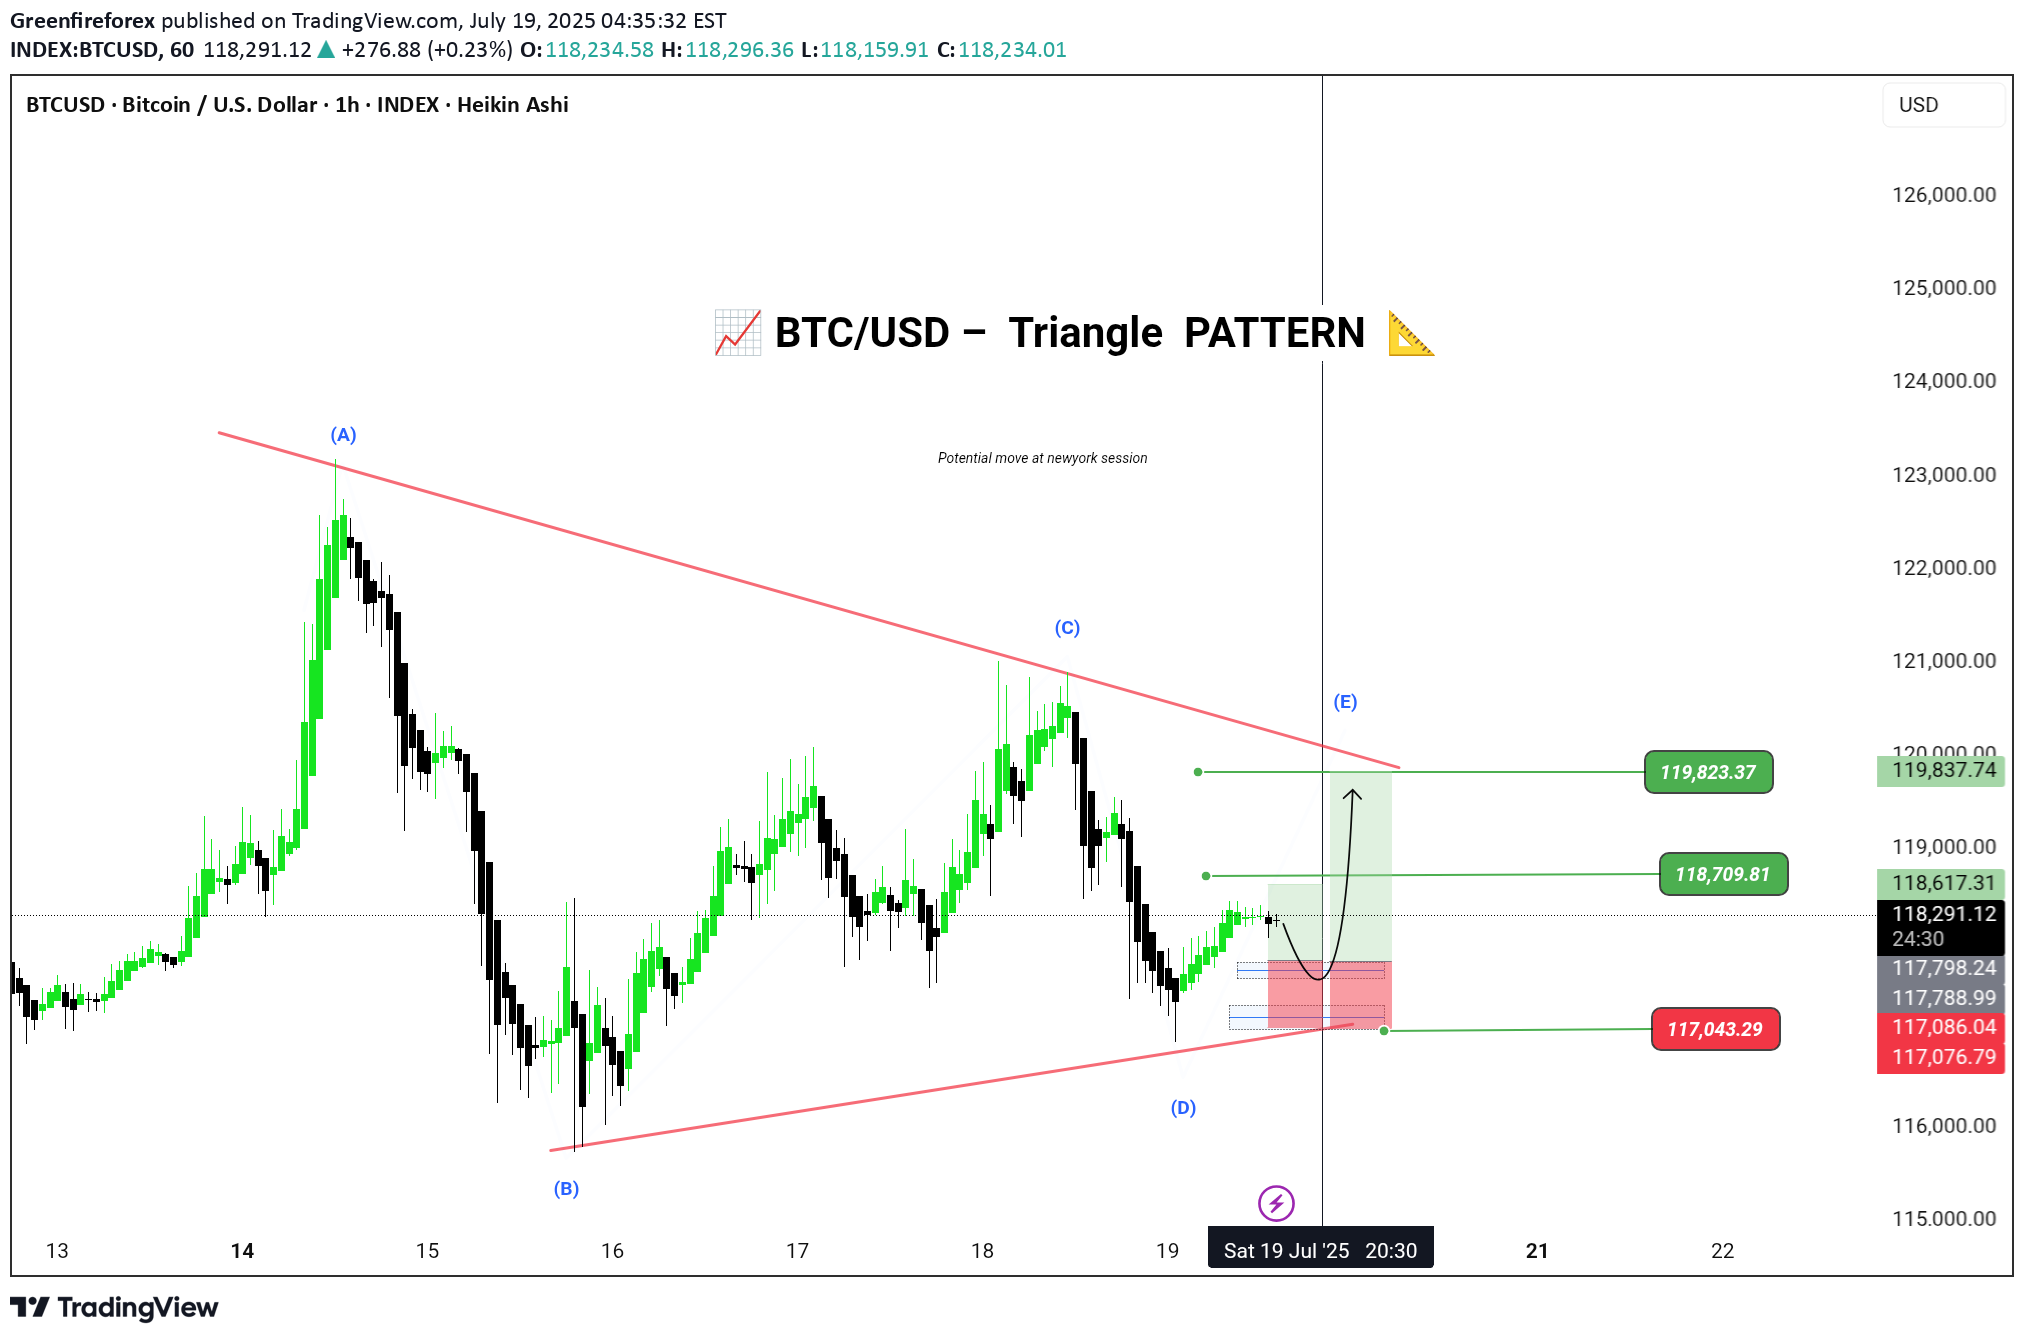
Bitcoin is currently forming a contracting triangle (ABCDE) structure on the 1H chart. The market appears to be respecting the lower trendline support and could be completing Wave D, now preparing to push into Wave E. 🟢 Entry Zone: 117086 – 117076 🎯 Targets: • 118709 • 119823 ⛔ Stop Loss / Invalidation: Below 117043 🧩 Pattern: Elliott Wave Contracting Triangle 📅 Timeframe: 1H (Heikin Ashi) 📌 Chart by: Greenfireforex 📌 Wait for a bullish confirmation candle above the support zone for a safe long setup. Triangle break could lead to momentum continuation toward the targets. ---
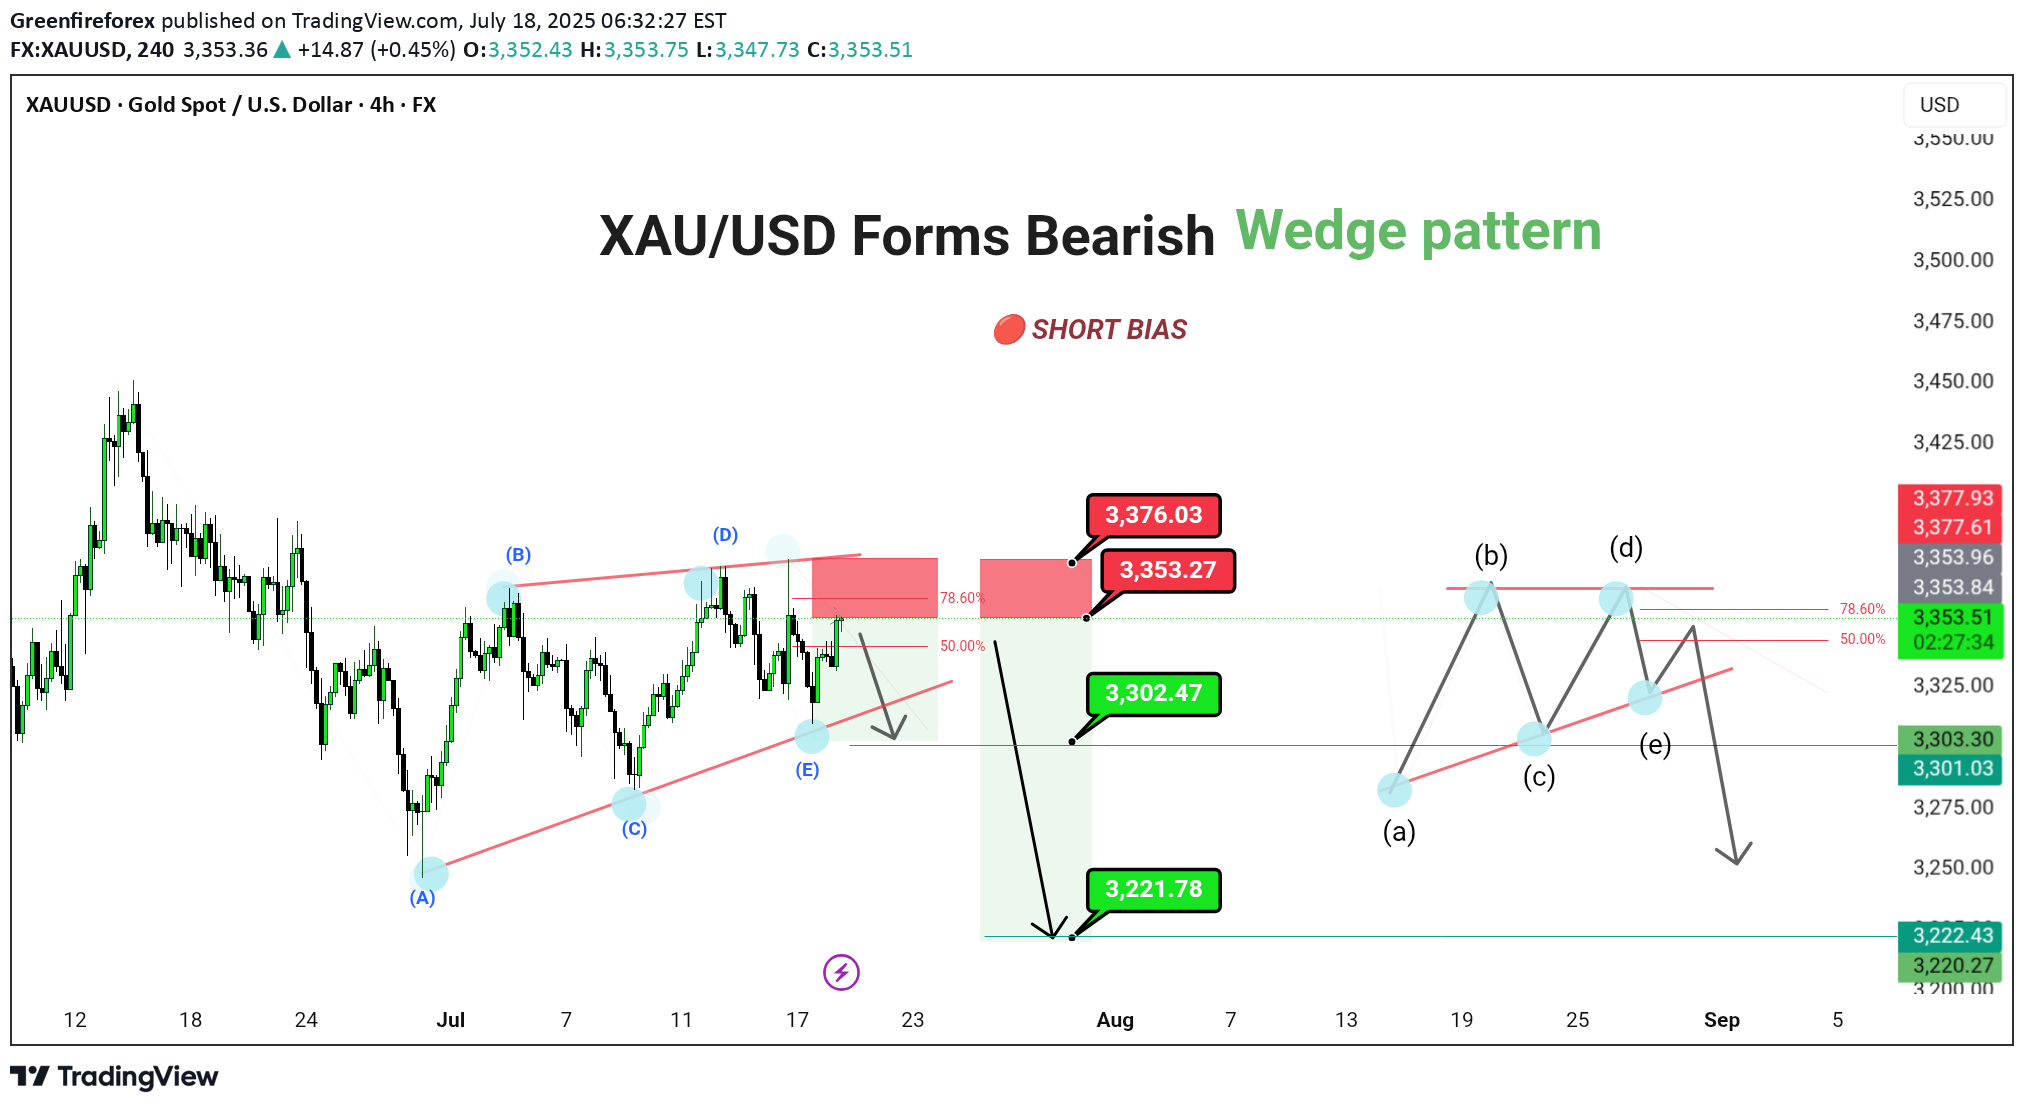
XAU/USD (4H) | FX | Gold Spot vs US Dollar 🔴 SHORT BIAS 📅 Updated: July 18 --- 🔍 Description Gold is trading within a bearish contracting triangle, suggesting a continuation move to the downside after the recent corrective bounce. Price is currently approaching the key 3,371–3,376 resistance zone, which aligns with the 78.6% Fibonacci retracement and upper triangle boundary. This resistance confluence could mark the termination of the (E) wave of the triangle, paving the way for a larger downward thrust. A confirmed break below 3,302 would open the door toward 3,221 as the next major target. The structure also leaves room for a minor internal triangle (a)-(b)-(c)-(d)-(e) pattern within the broader range, reinforcing the bearish setup. --- 📊 Technical Structure (4H) ✅ Bearish contracting triangle: (A)-(B)-(C)-(D)-(E) ✅ 78.6% Fibonacci + supply zone = ideal rejection point ✅ Internal triangle projection aligns with lower support test 📌 Downside Targets Target 1: 3,302.47 Target 2: 3,221.78 🔻 Invalidation: Above 3,376.03 --- 📈 Market Outlook Macro View: Rising real yields and cooling inflation reduce gold’s appeal Fed Watch: Hawkish tone supports USD, weighing on XAU Technical View: Structure favors downside break from triangle formation --- ⚠️ Risks to Bias Break and daily close above 3,376.03 invalidates triangle structure Sudden risk-off sentiment or dovish Fed shift could boost gold demand Sharp reversal in dollar strength --- 🧭 Summary: Bearish Breakout Setup Forming XAU/USD is completing a bearish triangle structure, with price sitting just below resistance. A rejection from the 3,371–3,376 zone can trigger a breakout lower, first toward 3,302, then extending to 3,221. As always, confirmation and tight risk control are key. ---
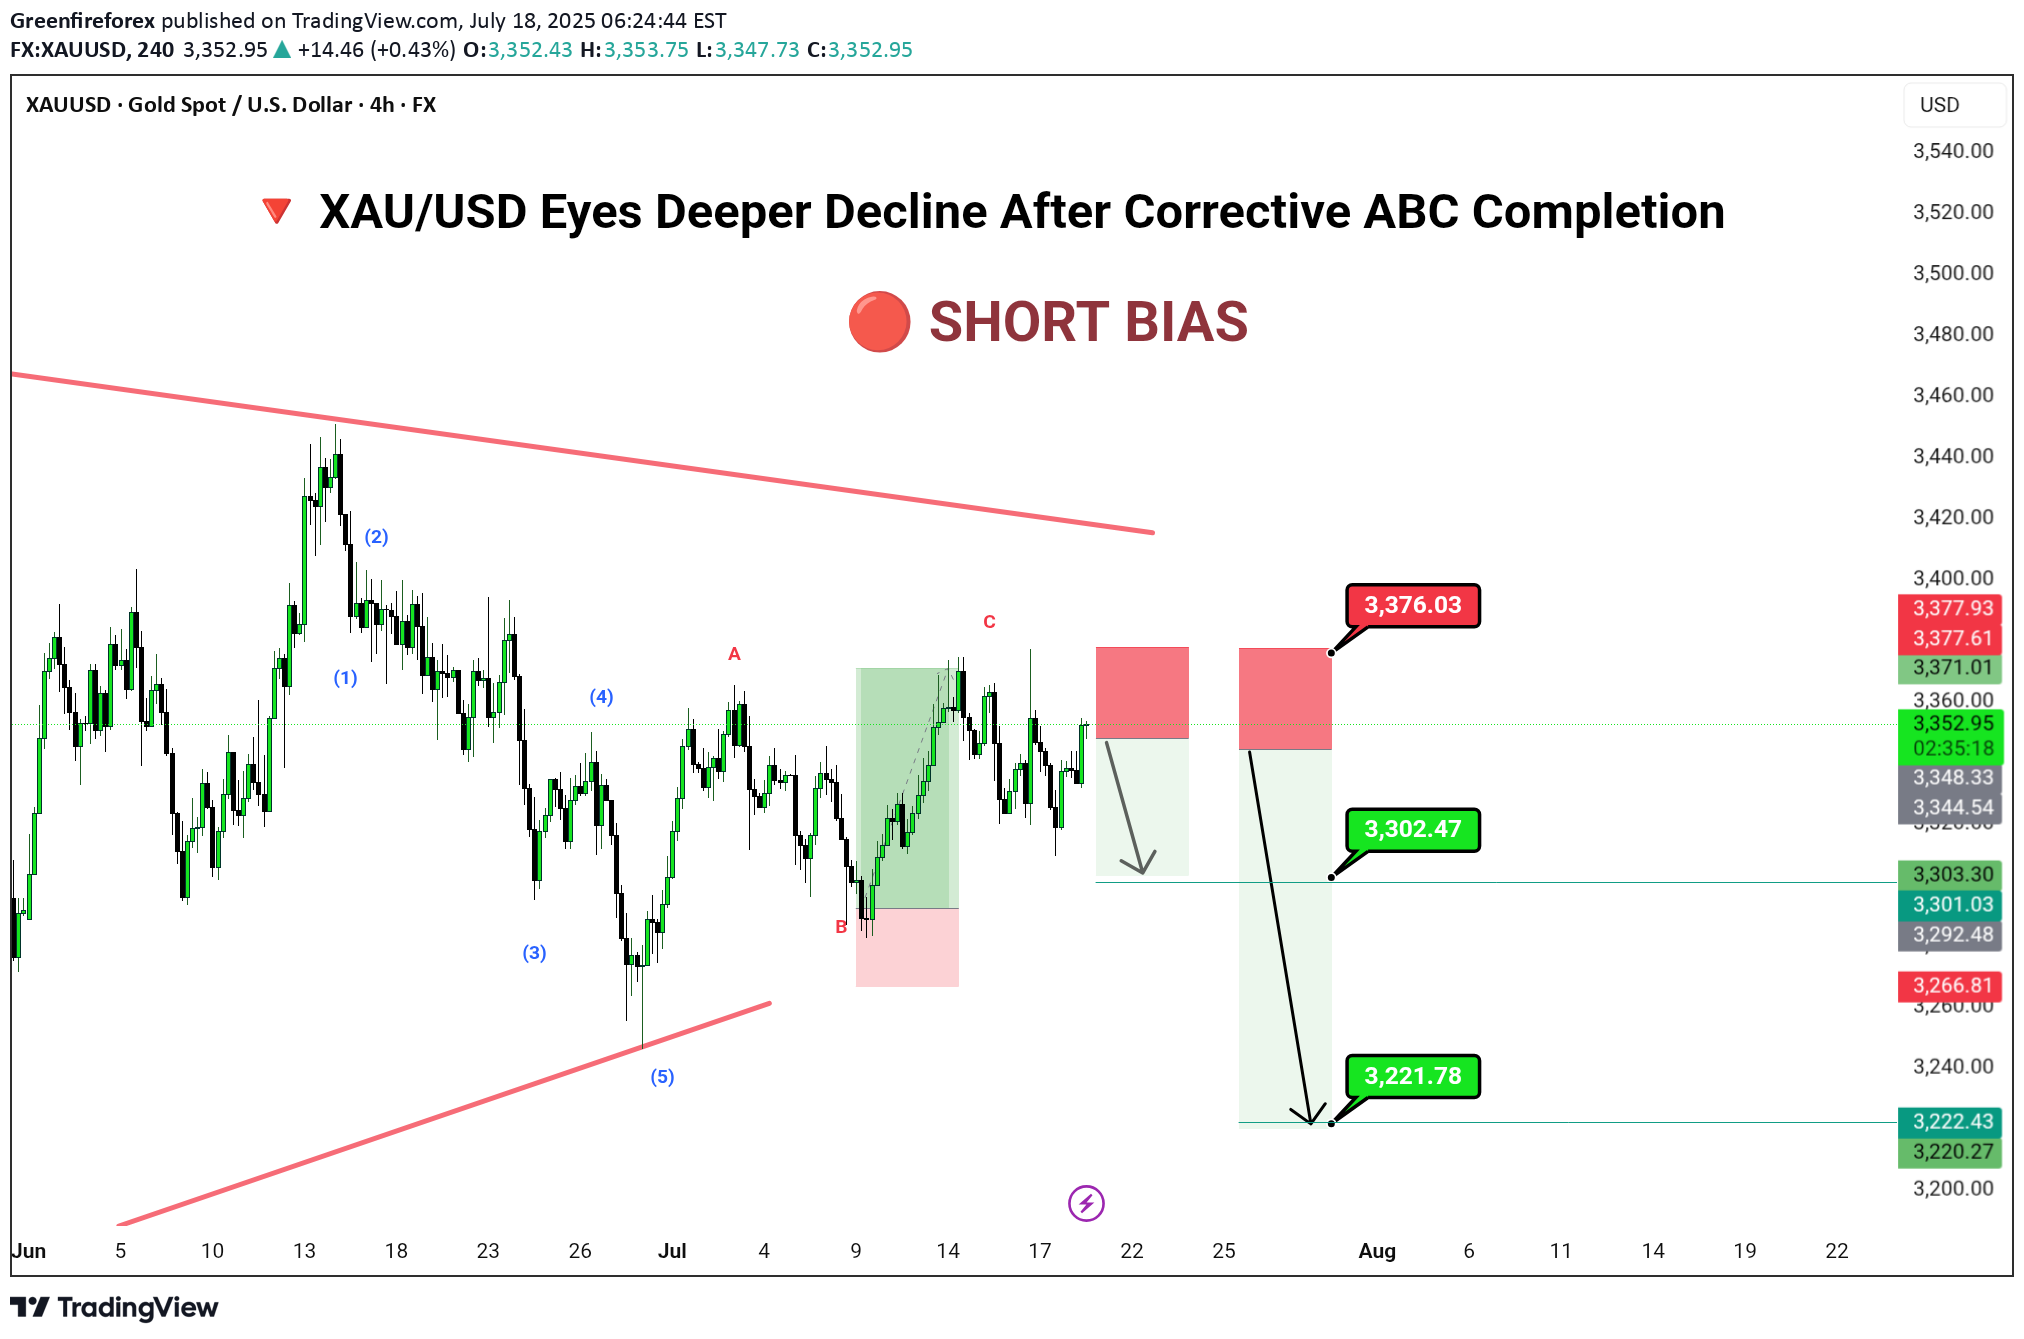
🔻 📊 Technical Structure (4H) ✅ 5-wave bearish impulse completed ✅ ABC correction likely completed ✅ Supply zone: 3,371–3,376 📌 Downside Targets First: 3,302.47 Final: 3,221.78 🔻 Invalidation Zone Above: 3,376.03 (Break above invalidates short scenario) --- 📈 Market Outlook Macro Context: Gold faces pressure amid rising real yields and stronger dollar flows. Technical Context: Price trapped within a long-term descending wedge; corrective rally meets resistance. Risk Appetite: Risk-on tone limits safe-haven demand in short term. --- ⚠️ Risks to Watch Breakout above 3,376 may trigger bullish breakout Dovish Fed tone could reverse short-term USD strength Geopolitical tension reviving gold demand --- 🧭 Summary: Bearish Structure in Play XAU/USD has completed a textbook ABC retracement and now sits inside a key shorting zone. A rejection here opens space for significant downside toward 3,221. Traders should watch closely for bearish confirmation before committing to positions, with stops tightly placed above 3,376.
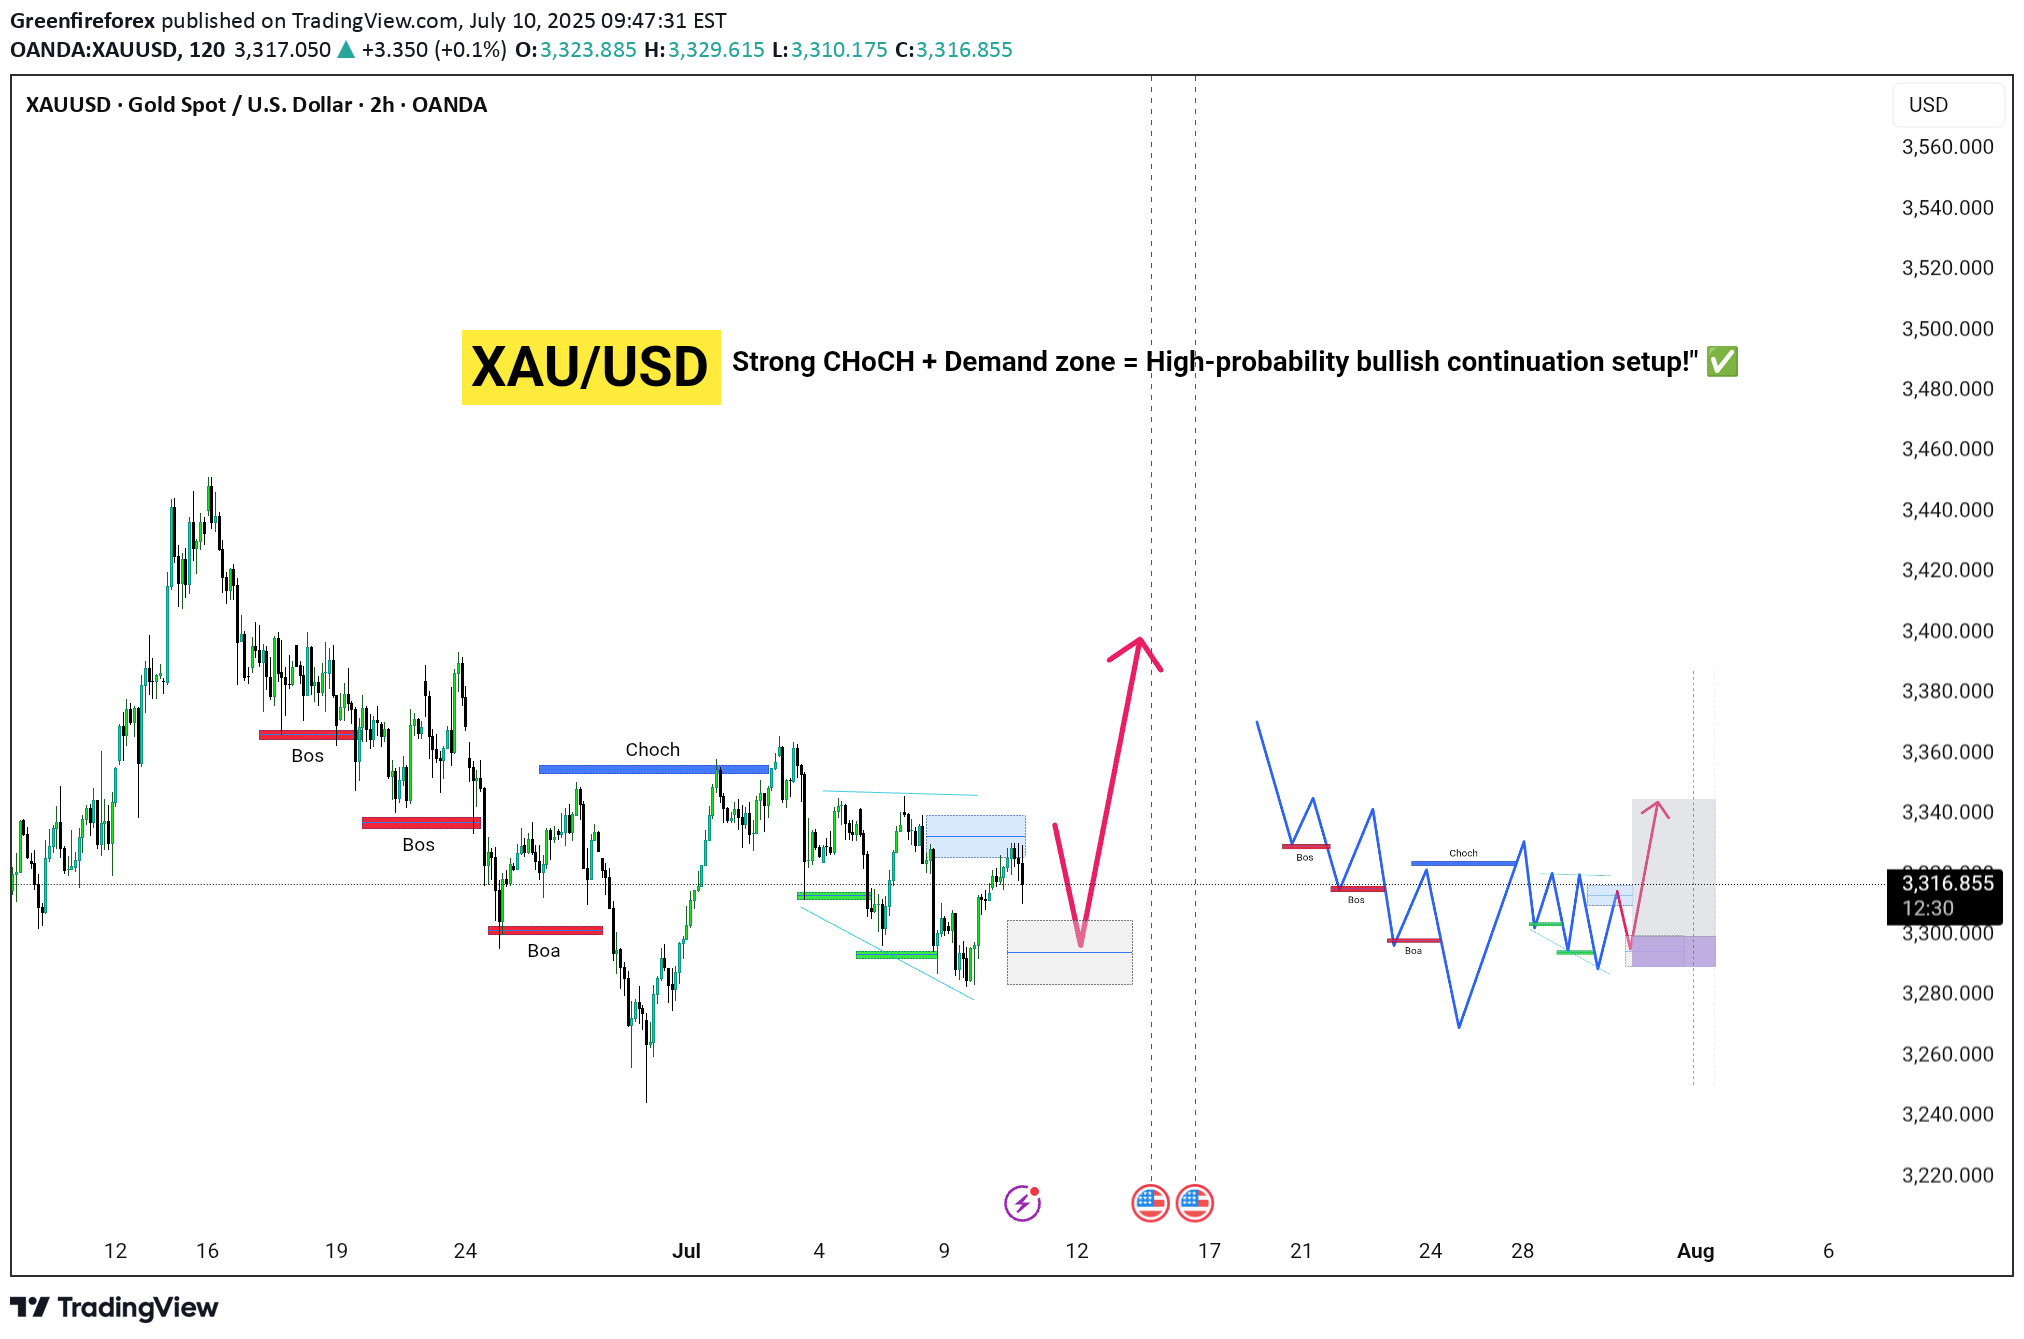
Strong CHoCH + Demand zone = High-probability bullish continuation setup!" ✅Key Highlights:🔴 Multiple BOS confirm bearish trend continuation up to late June.🔵 CHoCH on early July marks a potential bullish reversal zone.📉 Price currently retracing into a demand zone (highlighted blue box) for potential long entries.🔮 Expected bullish leg targeting the 3,350–3,400 zone before another possible correction.🧠 Projected schematic aligns with Wyckoff accumulation + SMC concepts—anticipating further BOS and CHoCH as price unfolds.📅 Watch for upcoming U.S. economic events that may influence volatility (shown with news icons).📌 Bias: Bullish above demand zone | Invalidation: Clean break below demand and failure to hold above recent BOS.
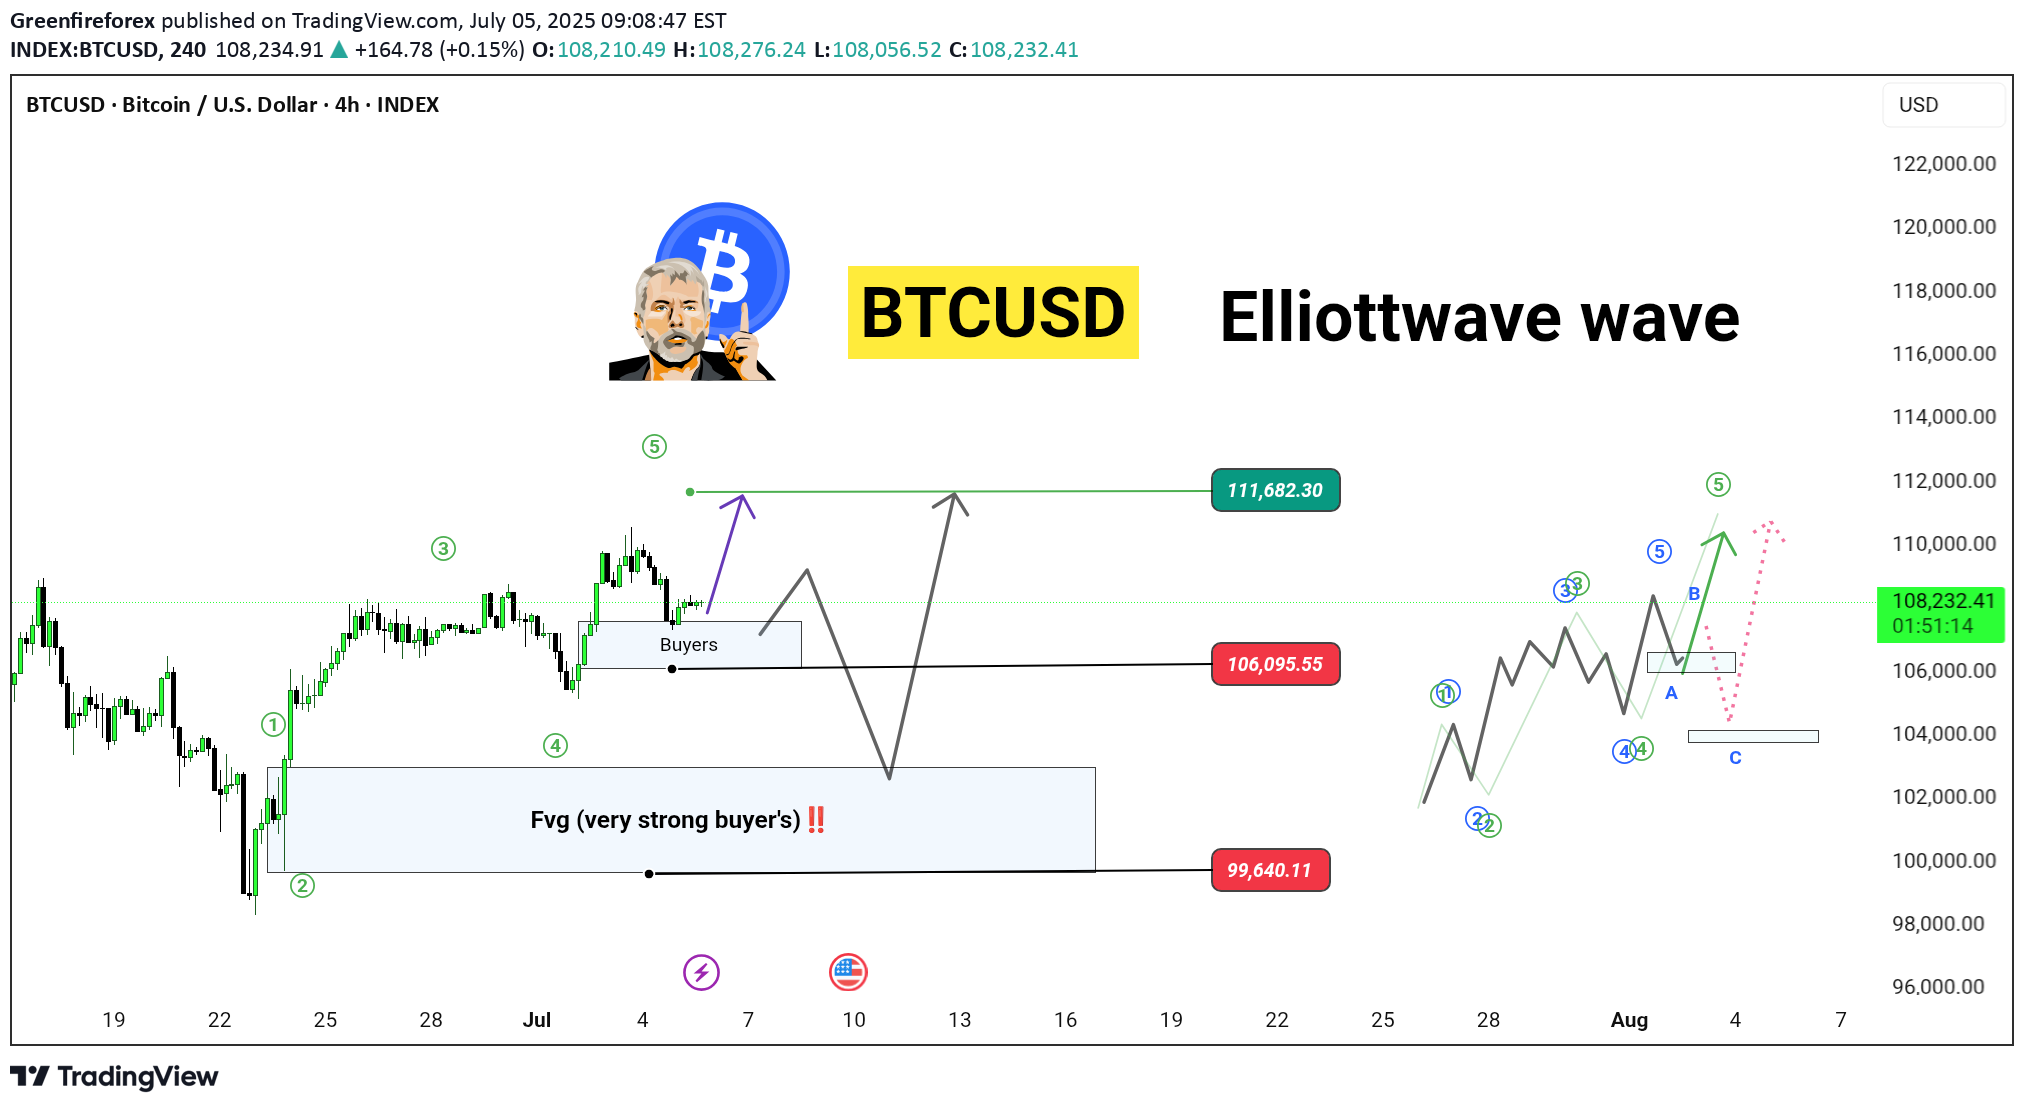
“BTCUSD is Setting Up for a Powerful Wave 5 Rally! 🚀 | Elliott Wave + SMC Analysis”---📊 Optimized :> 📈 Bitcoin (BTCUSD) 4H Elliott Wave ForecastBTC is currently forming a classic Elliott Wave 5 setup after completing a clean 1-2-3-4 sequence, supported by strong Smart Money Concepts (SMC) zones!We’re now at a critical decision point — will bulls push to 111,682 or will price revisit the Fair Value Gap (FVG) near 99,640 for re-accumulation?This chart outlines two potential bullish paths after retracement and the complete ABC correction possibility.---🧠 Key Technical Confluences:✅ Wave 1 to 5 structure forming cleanly💸 Strong Buyer Zone (FVG) at $99,640🔁 Correction zone marked for Wave A-B-C retracement🟢 Premium breakout target: 111,682🔴 Support zones: 106,095 and 99,640---🚀 My Outlook:If BTC holds above 106K, we may see a sharp continuation to 111K+ as part of Wave 5.But if smart money needs deeper liquidity, we’ll likely revisit the discount FVG before a major push up.---🔍 Tags#BTCUSD #BitcoinAnalysis #ElliottWave #SmartMoney #FVG #Wave5 #BTCForecast #CryptoTrading
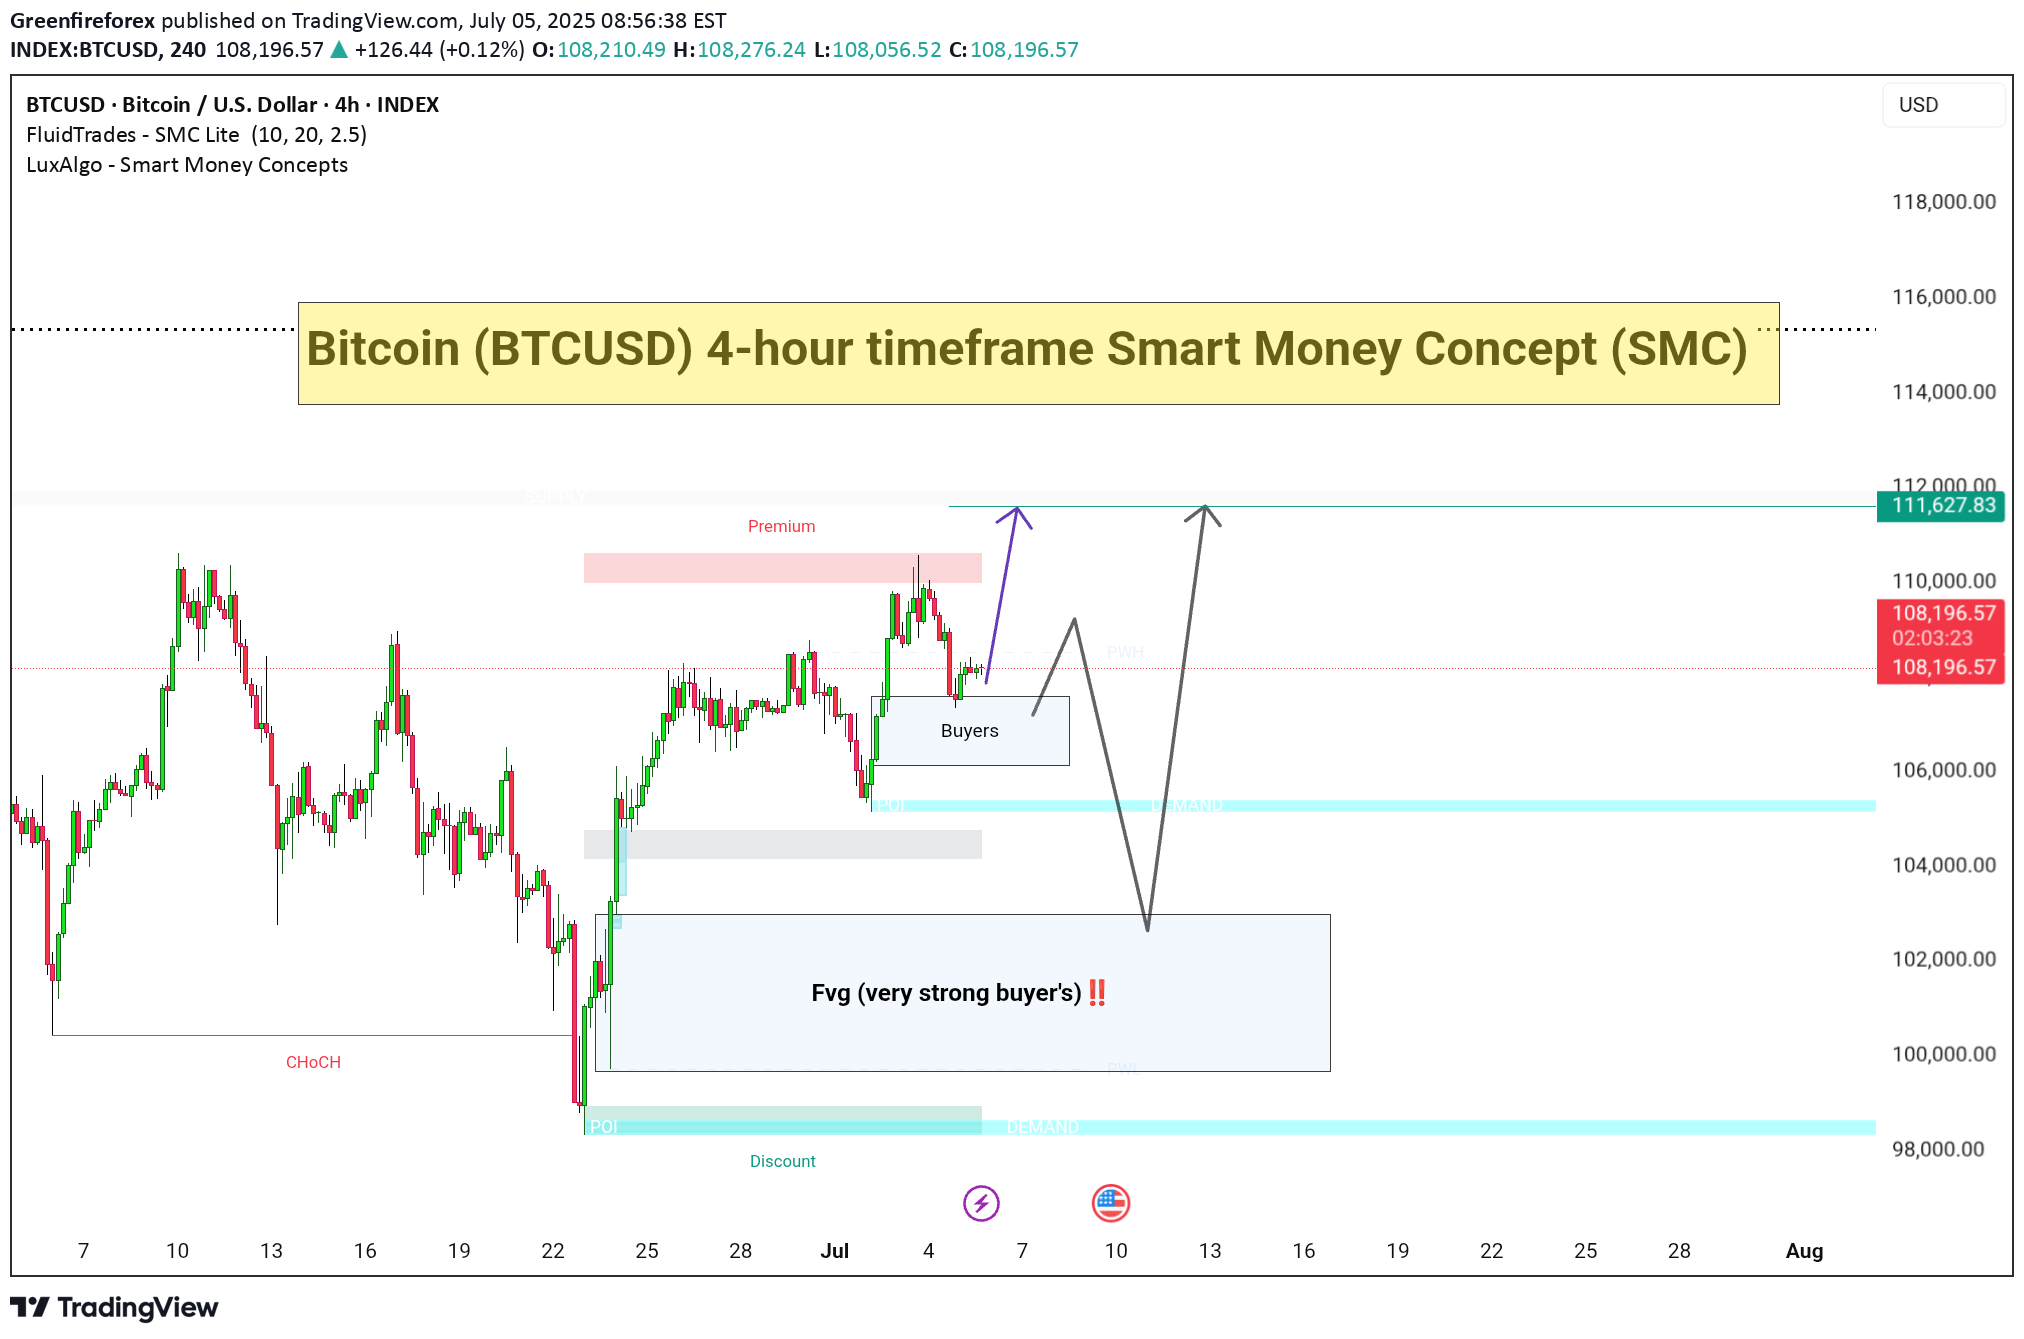
📌 Key Zones:Zone TypePrice AreaImportancePremium~111,000-112,000Sell area / resistanceBuyers Box~107,000-108,500Current minor supportFVG Zone~100,000–106,000Strong buy zone with imbalanceDiscountBelow 102,000High interest zone for large buyersResistance Target111,627.83Key liquidity target---🔔 Conclusion:As long as buyers defend the current support, price can target the 111.6K resistance.If rejected, deeper discount entries may be formed in the FVG zone, giving smart money a chance to reaccumulate.Keep an eye on economic calendar/news (indicated by icons on chart) which might trigger volatility near July 10.
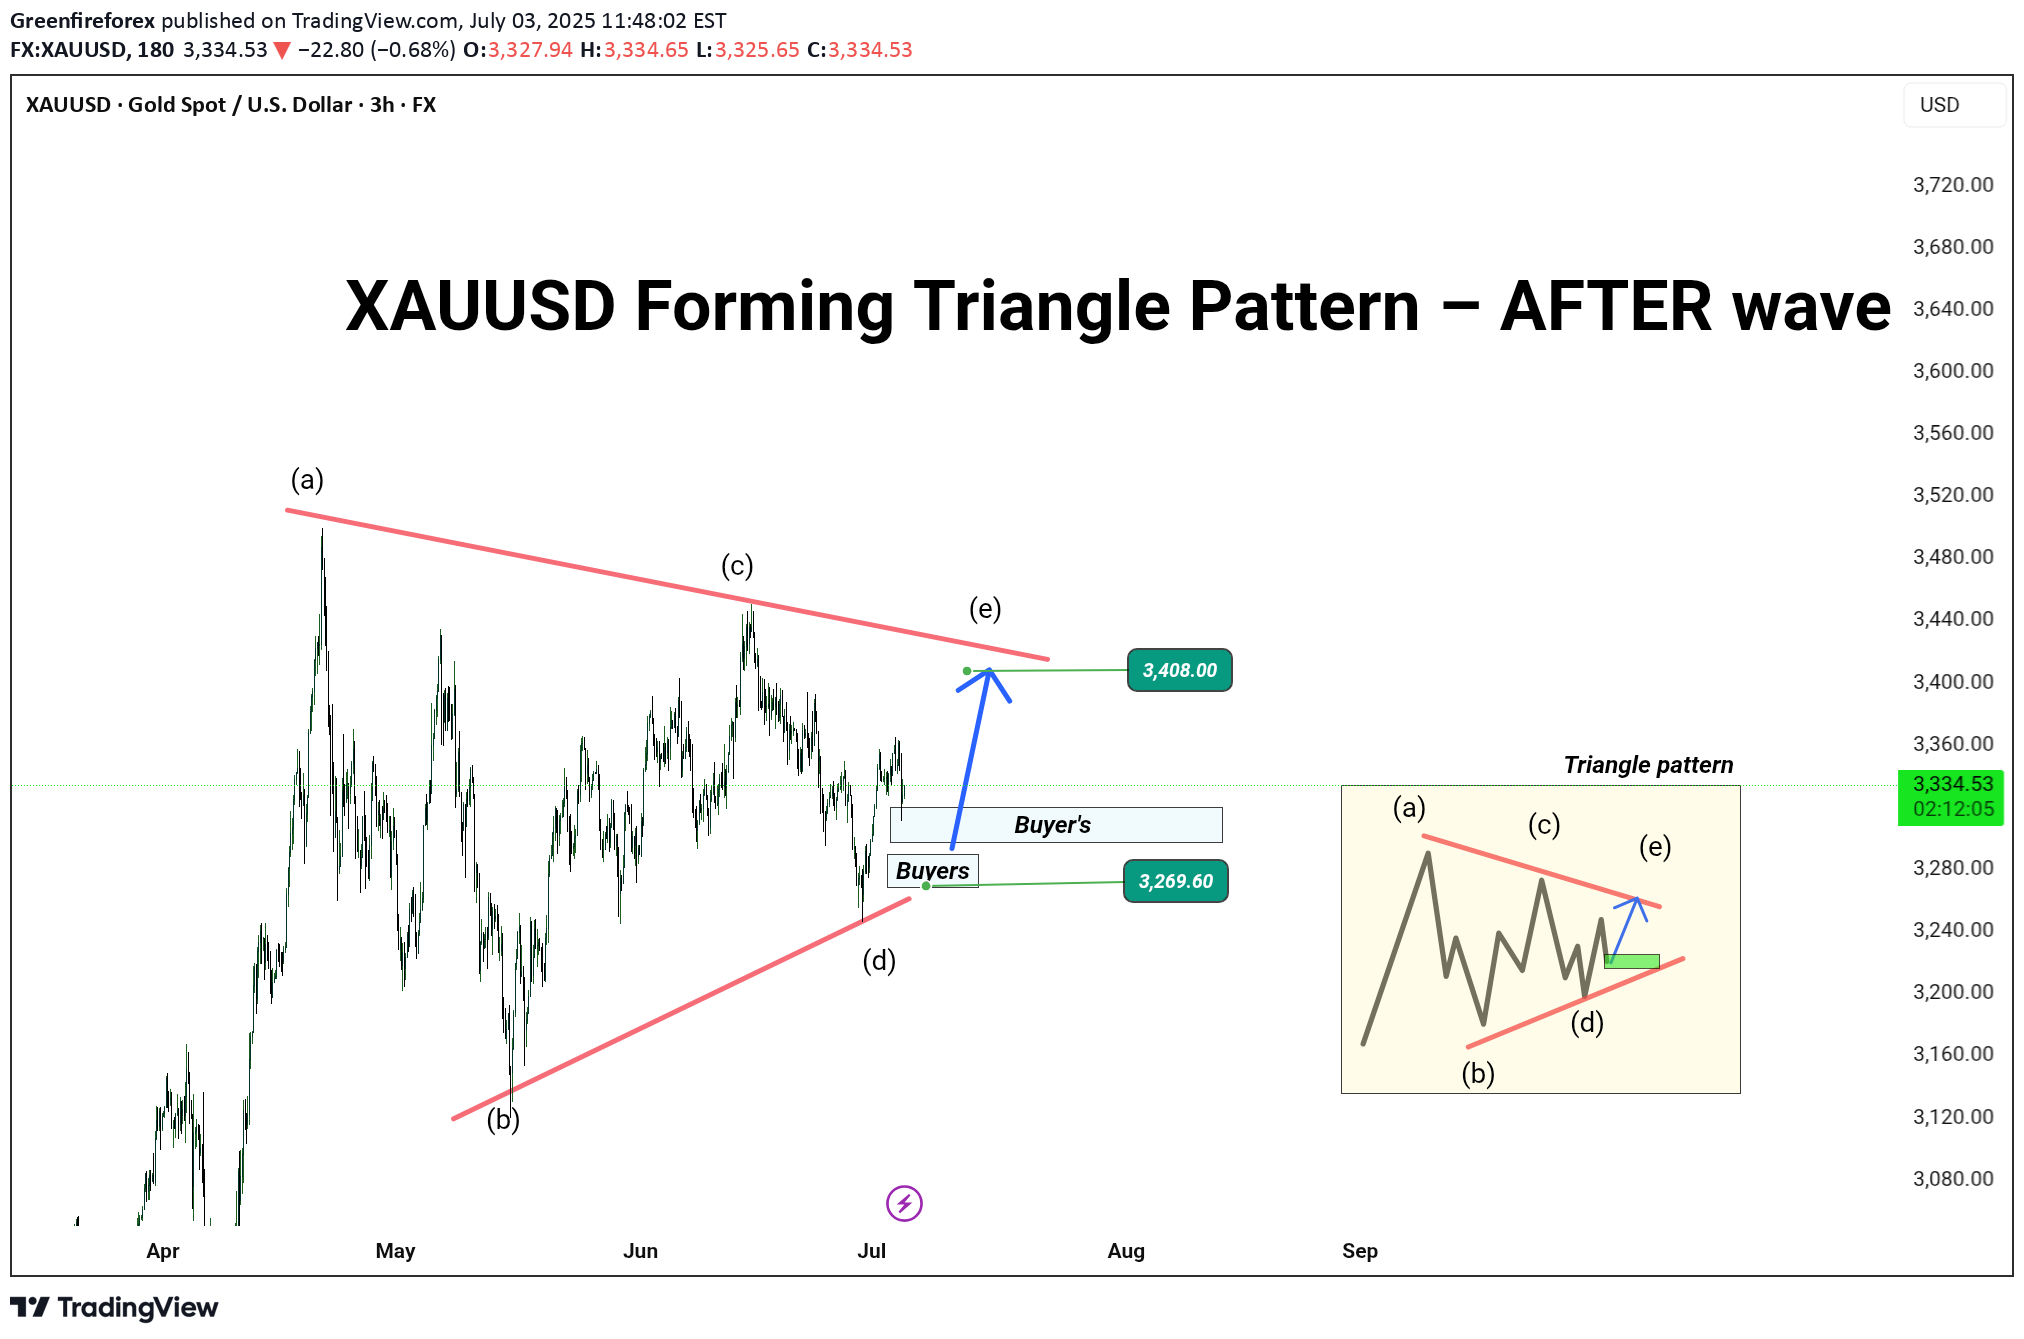
🚨 Gold (XAUUSD) Technical Analysis – 3H ChartGold is currently forming a classic contracting triangle pattern (ABCDE), with wave (e) in progress. Price is bouncing from a strong buyers’ zone near 3269.60, showing signs of upward pressure.📊 Current Structure:Wave count: (a)-(b)-(c)-(d)-(e)Consolidation within a symmetrical triangleKey support: 3269.60Resistance zone to watch: 3408.00📈 Potential Scenario:If price holds above the buyer’s zone, we can expect a bullish wave (e) push towards the upper trendline at 3408, potentially leading to a breakout continuation.📍 Trade Plan (Educational Purpose):Long Setup Valid Above: 3269.60Target: 3408.00Stop Loss (SL): Below 3260 (based on your risk profile)---🧠 Why This Matters?This triangle setup often leads to strong breakout moves, especially in commodities like gold during fundamental uncertainty or dollar index shifts. The market is compressing — be prepared for the breakout move.---📢 Follow for more clean Elliott Wave + Price Action setups!💬 Drop your analysis in the comments. Let’s grow together!
Disclaimer
Any content and materials included in Sahmeto's website and official communication channels are a compilation of personal opinions and analyses and are not binding. They do not constitute any recommendation for buying, selling, entering or exiting the stock market and cryptocurrency market. Also, all news and analyses included in the website and channels are merely republished information from official and unofficial domestic and foreign sources, and it is obvious that users of the said content are responsible for following up and ensuring the authenticity and accuracy of the materials. Therefore, while disclaiming responsibility, it is declared that the responsibility for any decision-making, action, and potential profit and loss in the capital market and cryptocurrency market lies with the trader.