Technical analysis by Greenfireforex about Symbol BTC: Buy recommendation (7/20/2025)

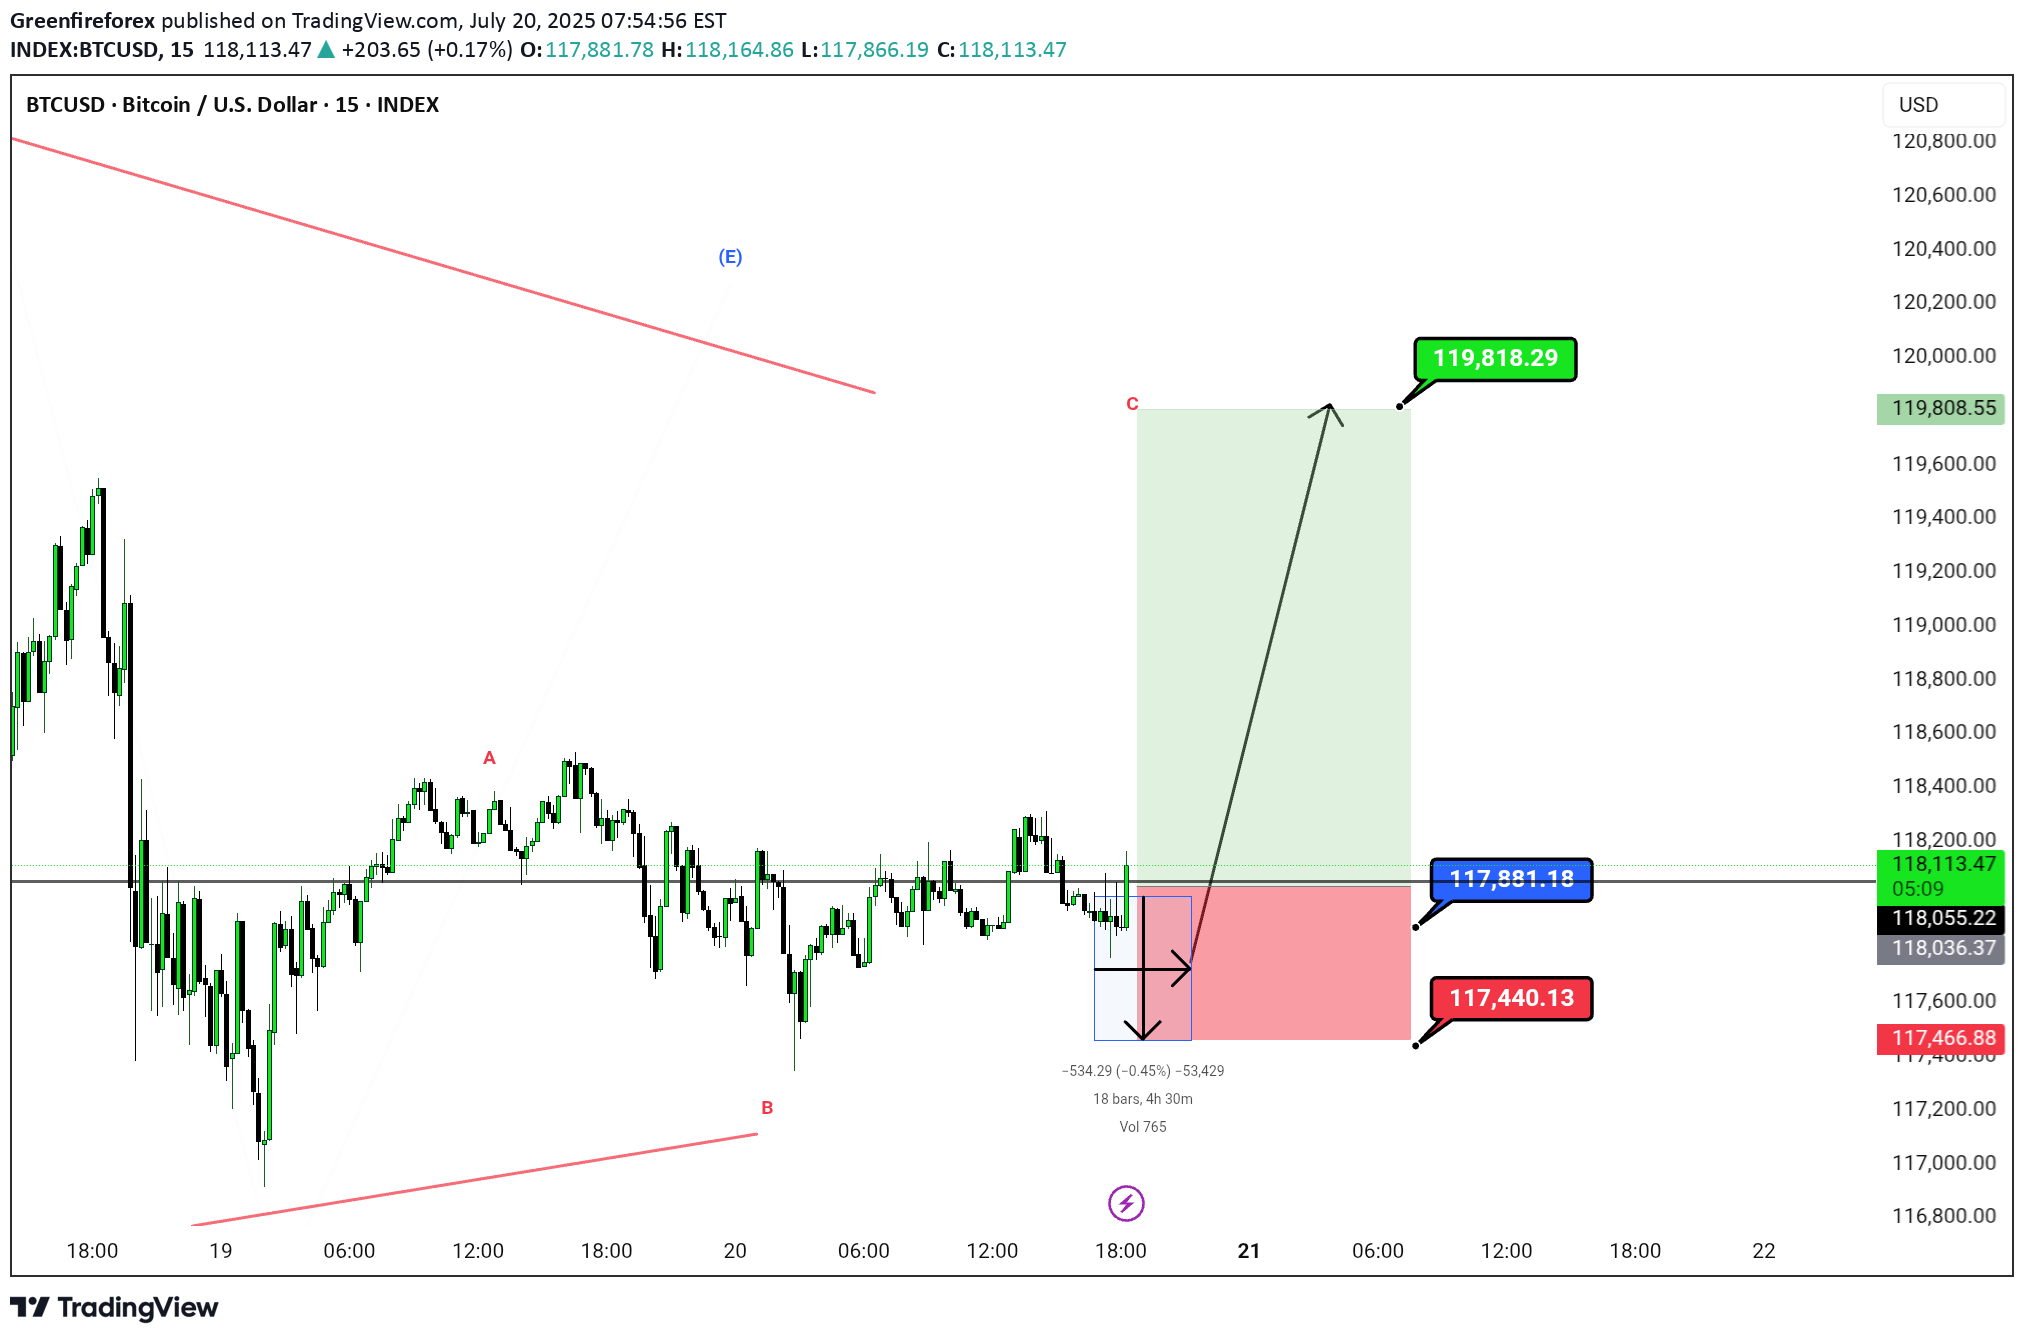
This chart shows a 15-minute timeframe analysis for BTC/USD (Bitcoin/US Dollar) using Elliott Wave . --- 📊 Chart Summary: Wave Structure: Labeled with corrective wave A–B–C, indicating the end of a corrective pattern. Price is currently in the potential reversal zone near Wave B, suggesting a bullish move toward Wave C completion. --- ✅ Trade Setup: Entry Zone: Around current price levels (≈117,889.74) Stop Loss (SL): 117,440.13 (marked in red) Target (TP): 119,818.29 (marked in green) Risk-to-Reward Ratio (RRR): Approx. 1:4, a favorable trade setup --- 🔍 Key Technical Observations: Bullish Projection: A large green zone indicating strong bullish momentum if Wave C plays out. Invalidation Zone: Price falling below 117,440.13 would invalidate the bullish count. Volume Marker: Small thunderbolt symbol at the bottom could imply a volume spike or a critical event time. Chart Title: Published under Greenfireforex branding, timestamped Jul 20, 2025, likely indicating a public or private analysis post. --- 📌 Possible Interpretation: This chart suggests a buy opportunity for BTCUSD if price respects the bottom zone (117,440) and begins to climb toward the projected target (119,818). It uses wave theory logic assuming this is a Wave C rally, and price has completed a corrective move. I'm ready to answer in comments session
