
Fx_Faiza
@t_Fx_Faiza

What symbols does the trader recommend buying?
Purchase History
پیام های تریدر
Filter
Signal Type
Fx_Faiza
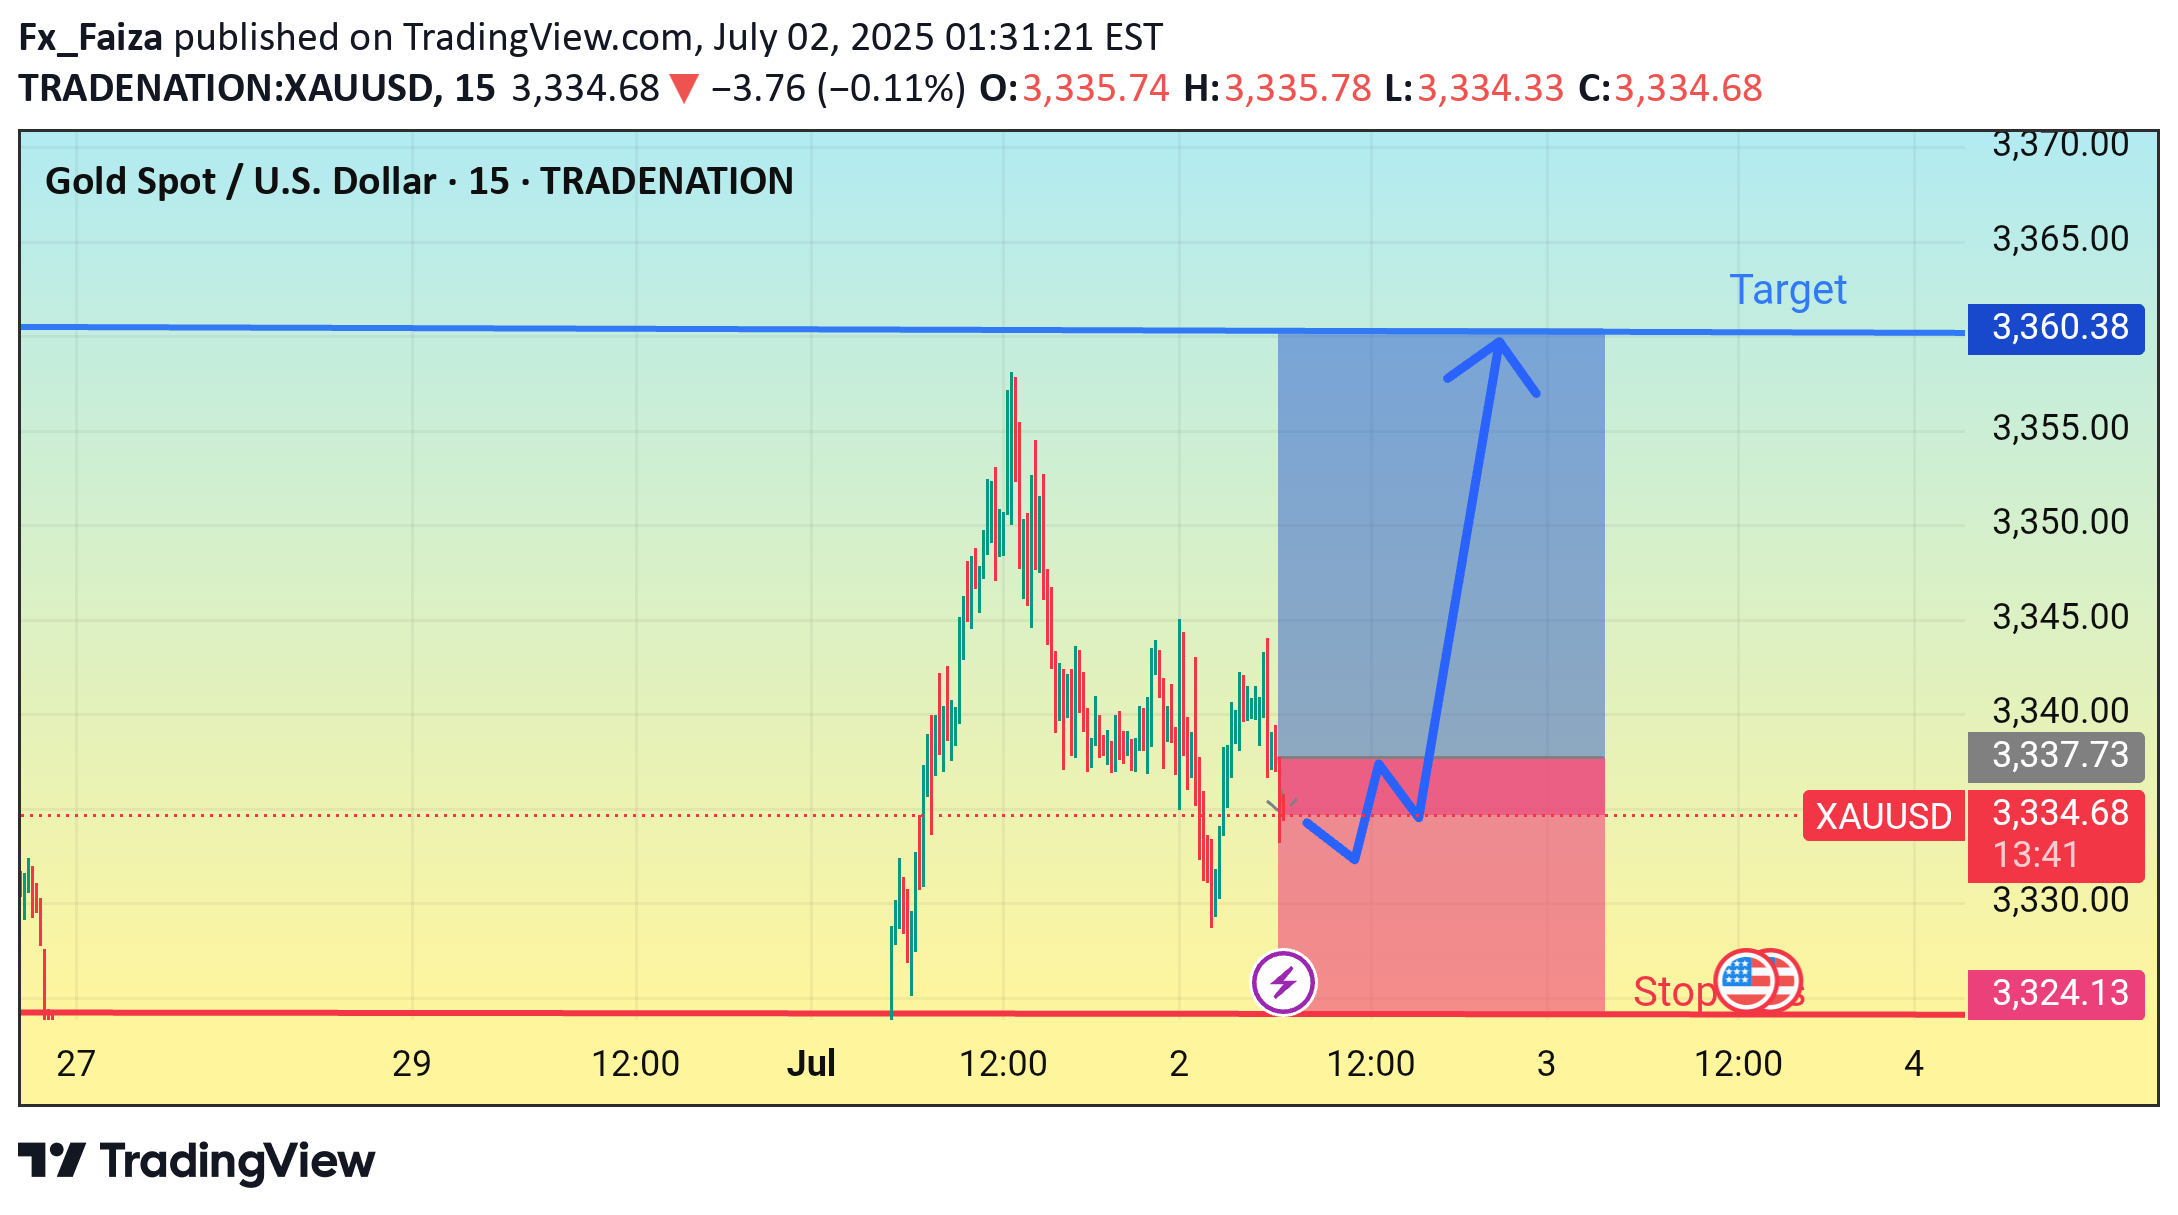
Gold buy now entry point 3335Target 3360Stop loss 3324
Fx_Faiza
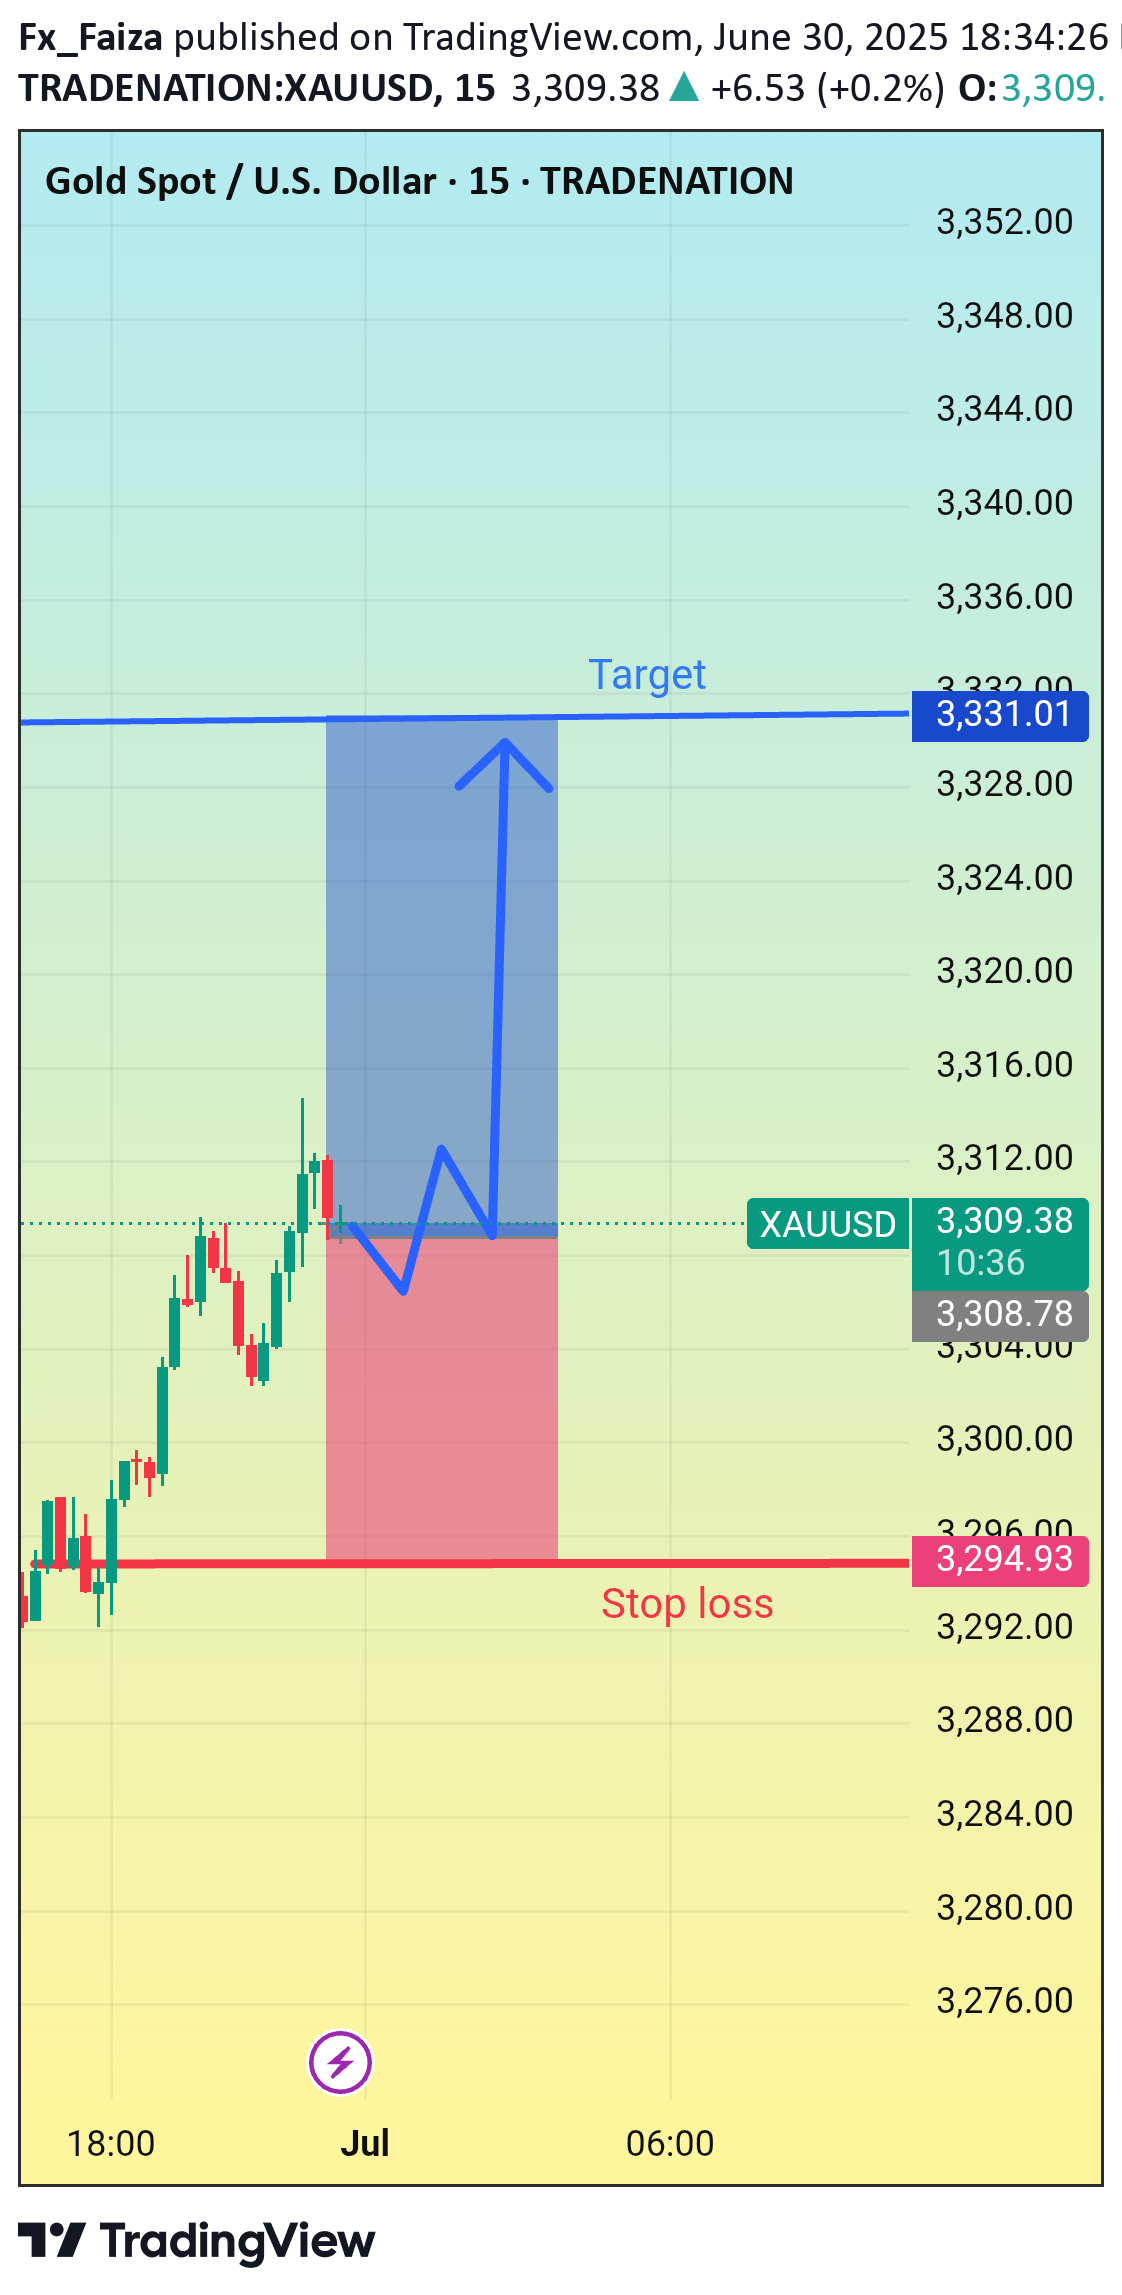
Gold buy now entry point 3309Target 3331Stop loss 3294
Fx_Faiza
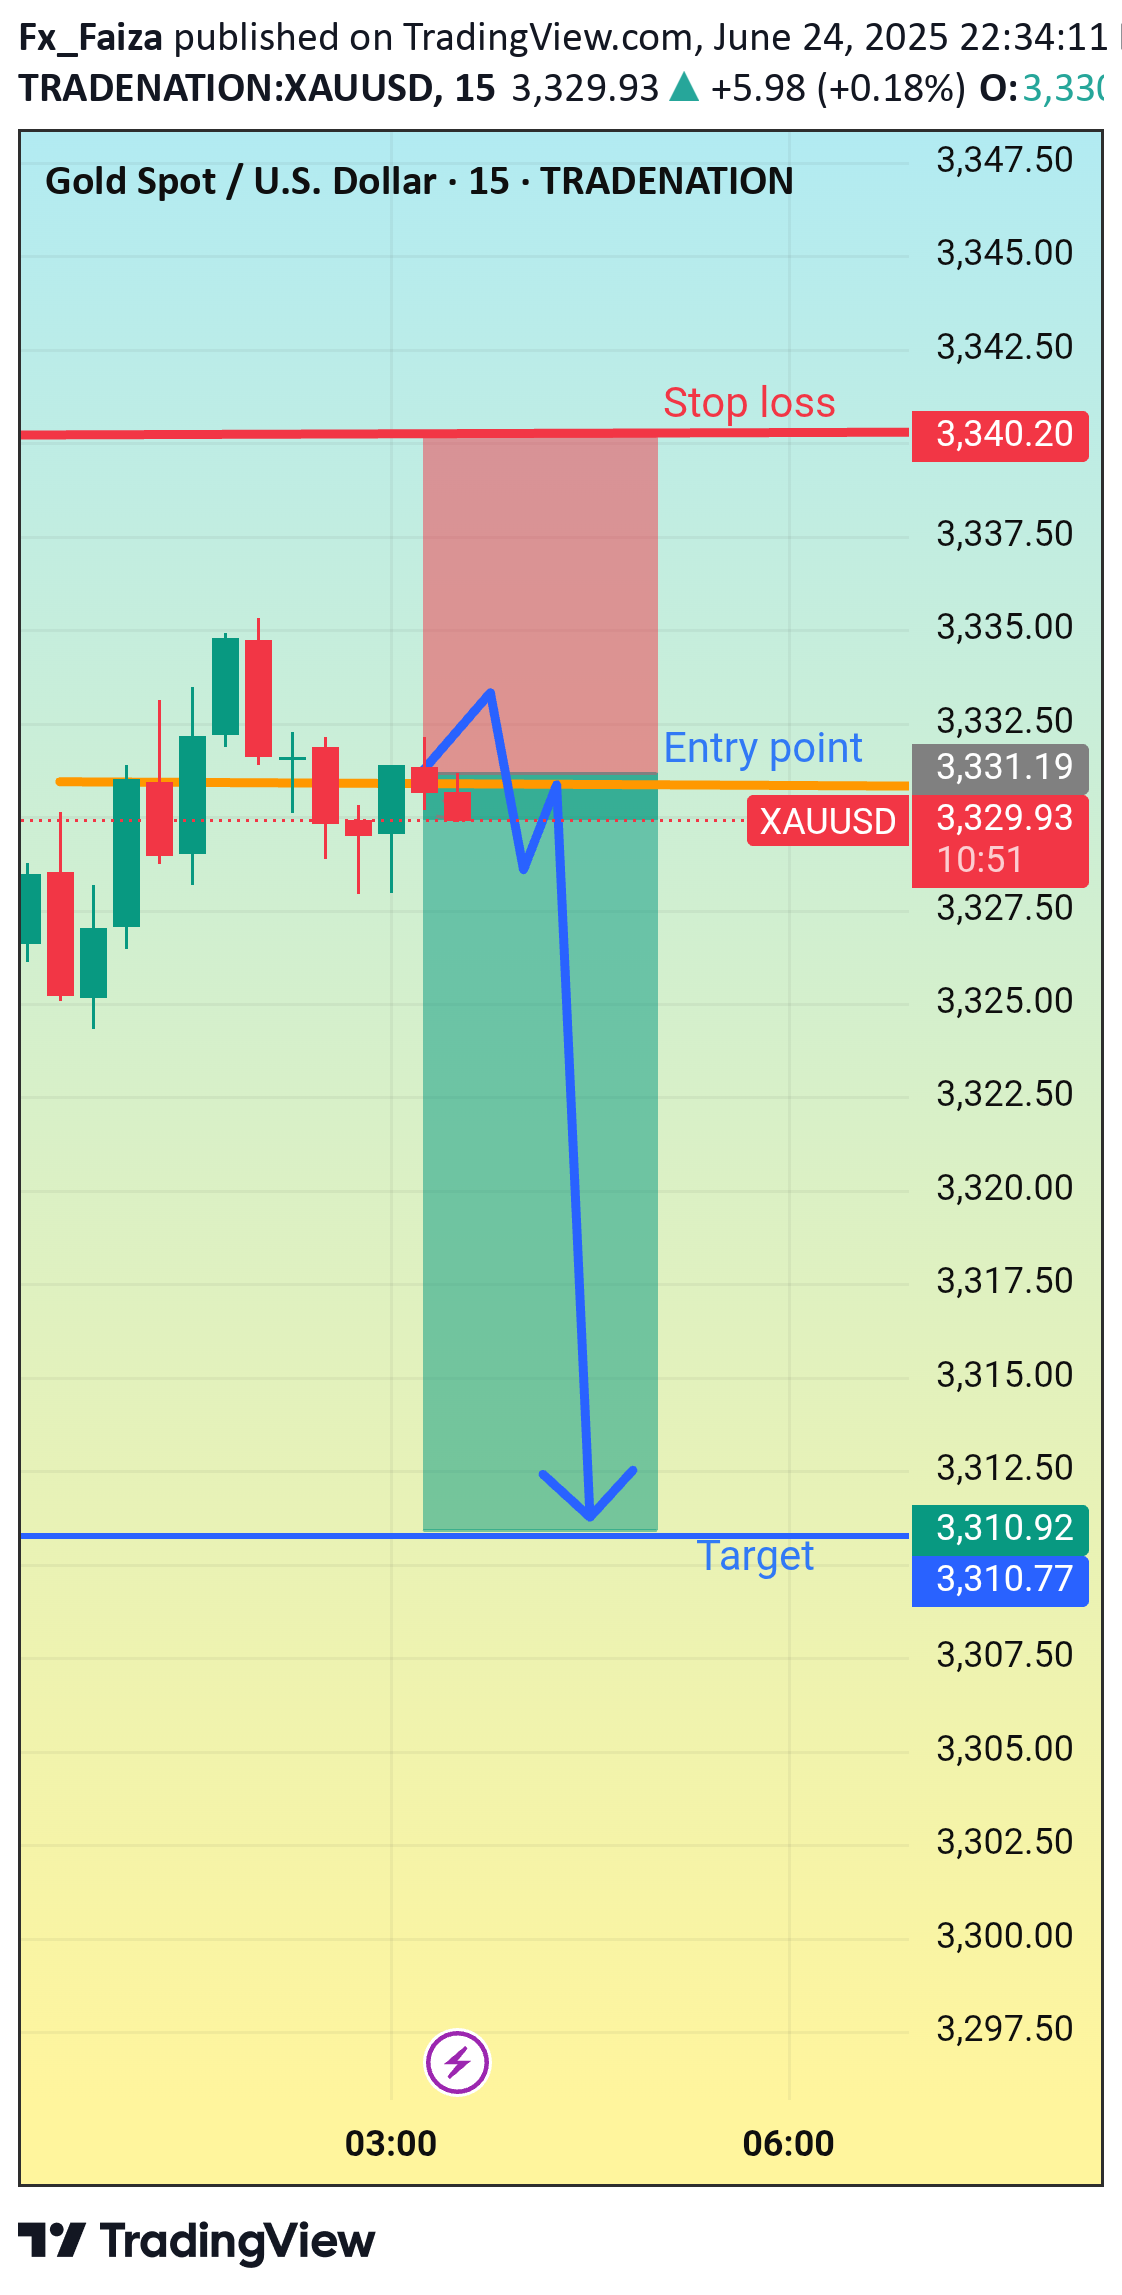
Sell (Short) Trade Setup:Instrument: Gold Spot / U.S. Dollar (XAU/USD)Timeframe: 15 MinutesEntry Point: 3,331.19Stop Loss (SL): 3,340.20Target (Take Profit): 3,310.77 / 3,310.92---🔍 Trade Logic:Chart par bearish candle formation dikha raha hai.Entry ke baad price ka short-term bounce expected hai (as shown by blue zigzag arrow).
Fx_Faiza
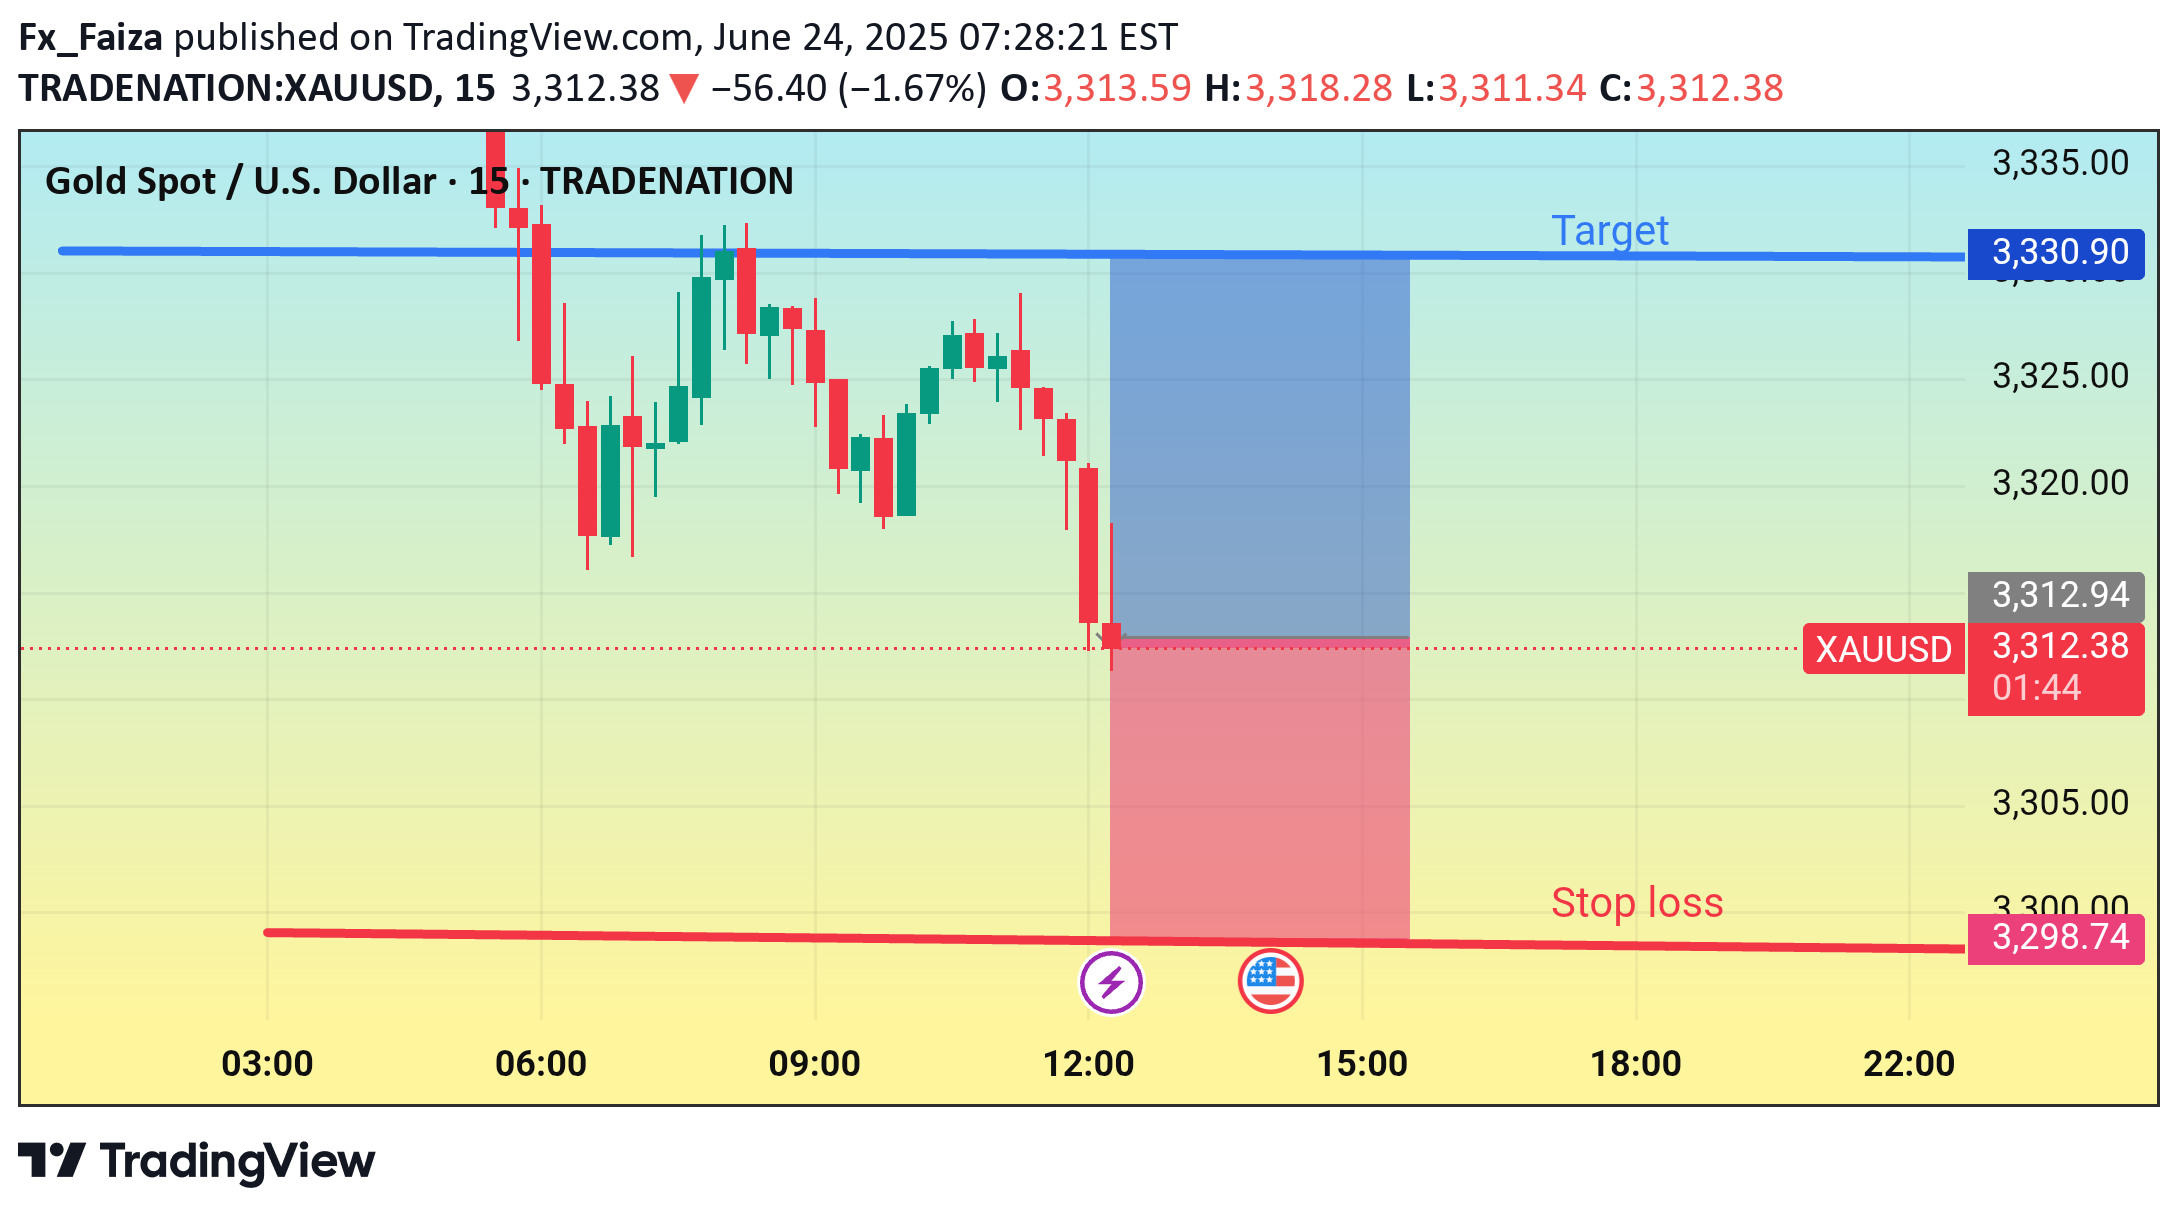
Instrument: Gold (XAU/USD)Timeframe: 15 minutesEntry Price Area: Around $3,312.94Target (Take Profit): $3,330.27Stop Loss: $3,298.74Risk-Reward Ratio: Looks favorable (approx. 1:1.5 or better)📈 Trade Idea:The chart suggests a long (buy) position with:A potential reversal (indicated by the blue zigzag arrow) after a minor pullback.
Fx_Faiza
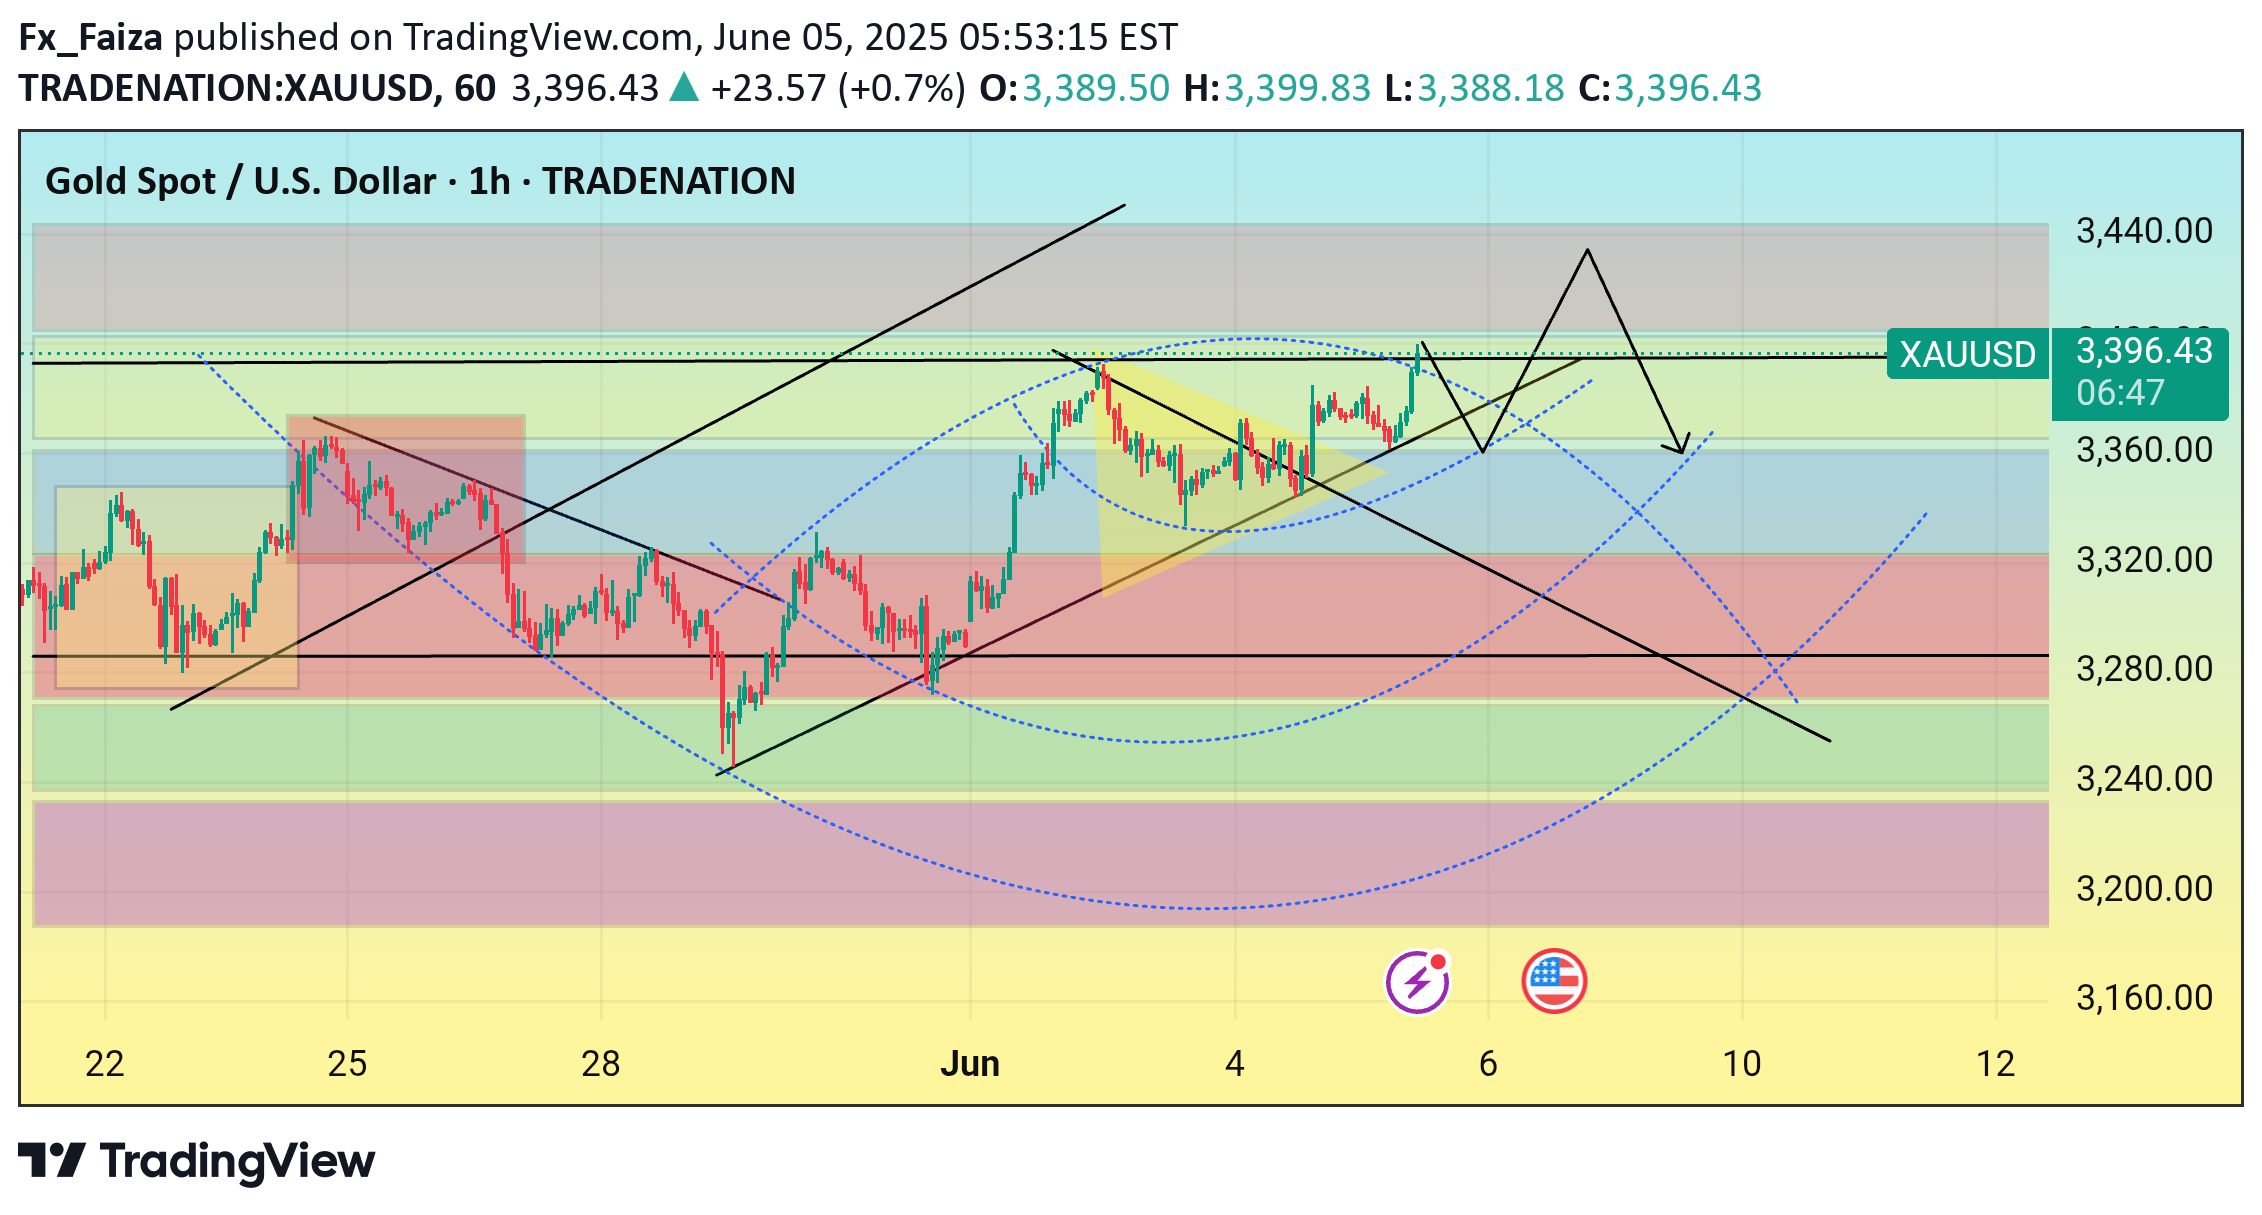
🟢 Big Picture – What’s Happening on the Chart?This is a 1-hour chart of XAU/USD (Gold), showing the recent trend, key levels, and a forecasted movement.At a glance, you can see that Gold has been in a bullish recovery since the drop on May 29. The market is currently testing a key resistance zone (around $3,400), which aligns with the upper boundary of the ascending channel and a previous consolidation area.---🔍 Technical Breakdown (Experienced View)1. Trend StructureThe market formed a higher low after a recent dip (around May 29), suggesting bulls are gaining control.Price is respecting an ascending trendline, showing a short-term bullish channel.However, the price is approaching an area of confluence resistance (horizontal resistance + channel top).2. Chart PatternsThe current setup hints at a rising wedge, which is typically a bearish reversal pattern.The chart shows projected arrows suggesting a breakout to the upside (short-term) followed by a pullback, which matches how wedges often behave: false breakouts before the real move.3. Fib and Zone AnalysisThe color bands behind the chart likely represent Fibonacci retracement zones or volume profile levels.Notice how the price interacts with the green/yellow zone—it’s a clear area where price historically reacts.If price rejects from here, a pullback to the 3,350 or even 3,300 zone is possible.---🧠 Experienced InterpretationIf I were trading this:Scenario A (Breakout Trap): I’d be cautious about chasing a breakout above 3,400. This could be a liquidity grab, where market makers push price slightly above resistance to trap breakout buyers, then reverse.Scenario B (Short Setup): After the false breakout, I’d look for bearish confirmation (rejection candle, bearish engulfing, or RSI divergence) to enter a short targeting 3,350–3,300.Scenario C (Long Continuation): If price breaks out strongly and retests the 3,400 level as support, I might switch bias and go long toward 3,450. But I’d need a clear break and hold above this level first.---🧭 Trading Psychology ReminderThis chart reflects anticipation. The trader behind it expects a fake-out before a drop. As an experienced trader, I wouldn’t blindly follow arrows—but I’d use them to prepare “if-then” scenarios, like:If price breaks above resistance but closes back inside → look to short.If price holds above breakout → ride momentum long with tight risk control.---✅ SummaryCurrent bias: Bullish short-term, bearish correction expected.Key zones: Resistance at $3,400–$3,420; Support at $3,350 / $3,300.Strategy: Wait for confirmation of either breakout or rejection; prepare for both outcomes.Risk Management: Crucial at resistance zones like this—false breakouts are common traps.
Fx_Faiza
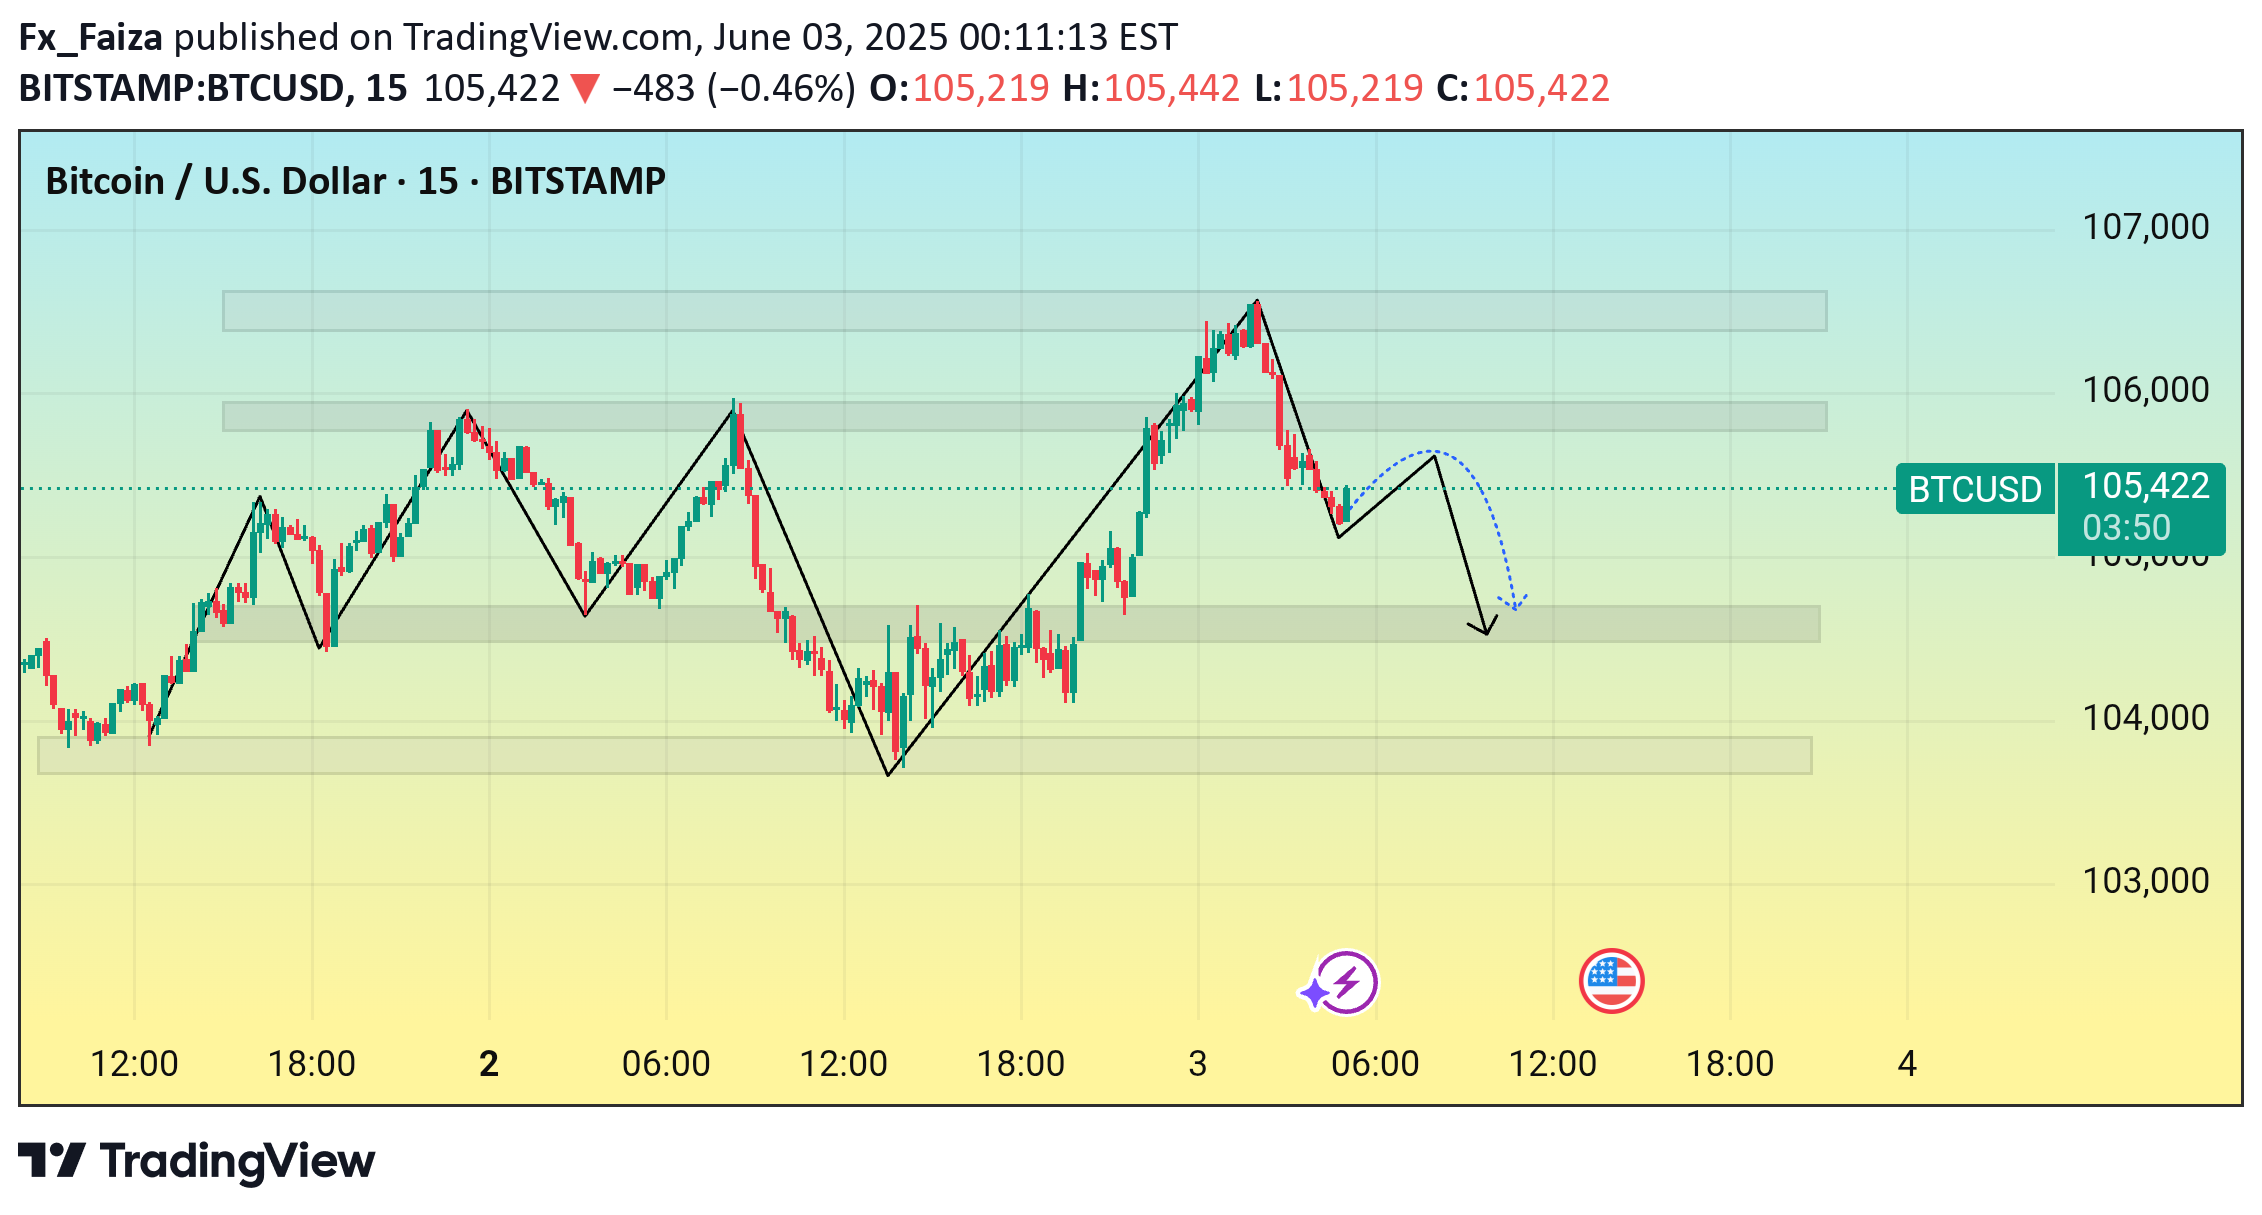
Recent market structure and a potential bearish move. After a peak near 107,000, Bitcoin has started a downward trend. The projection suggests a minor pullback before continuing lower toward the 104,000–103,500 support zones. Traders may watch for confirmations before entering positions.
Fx_Faiza
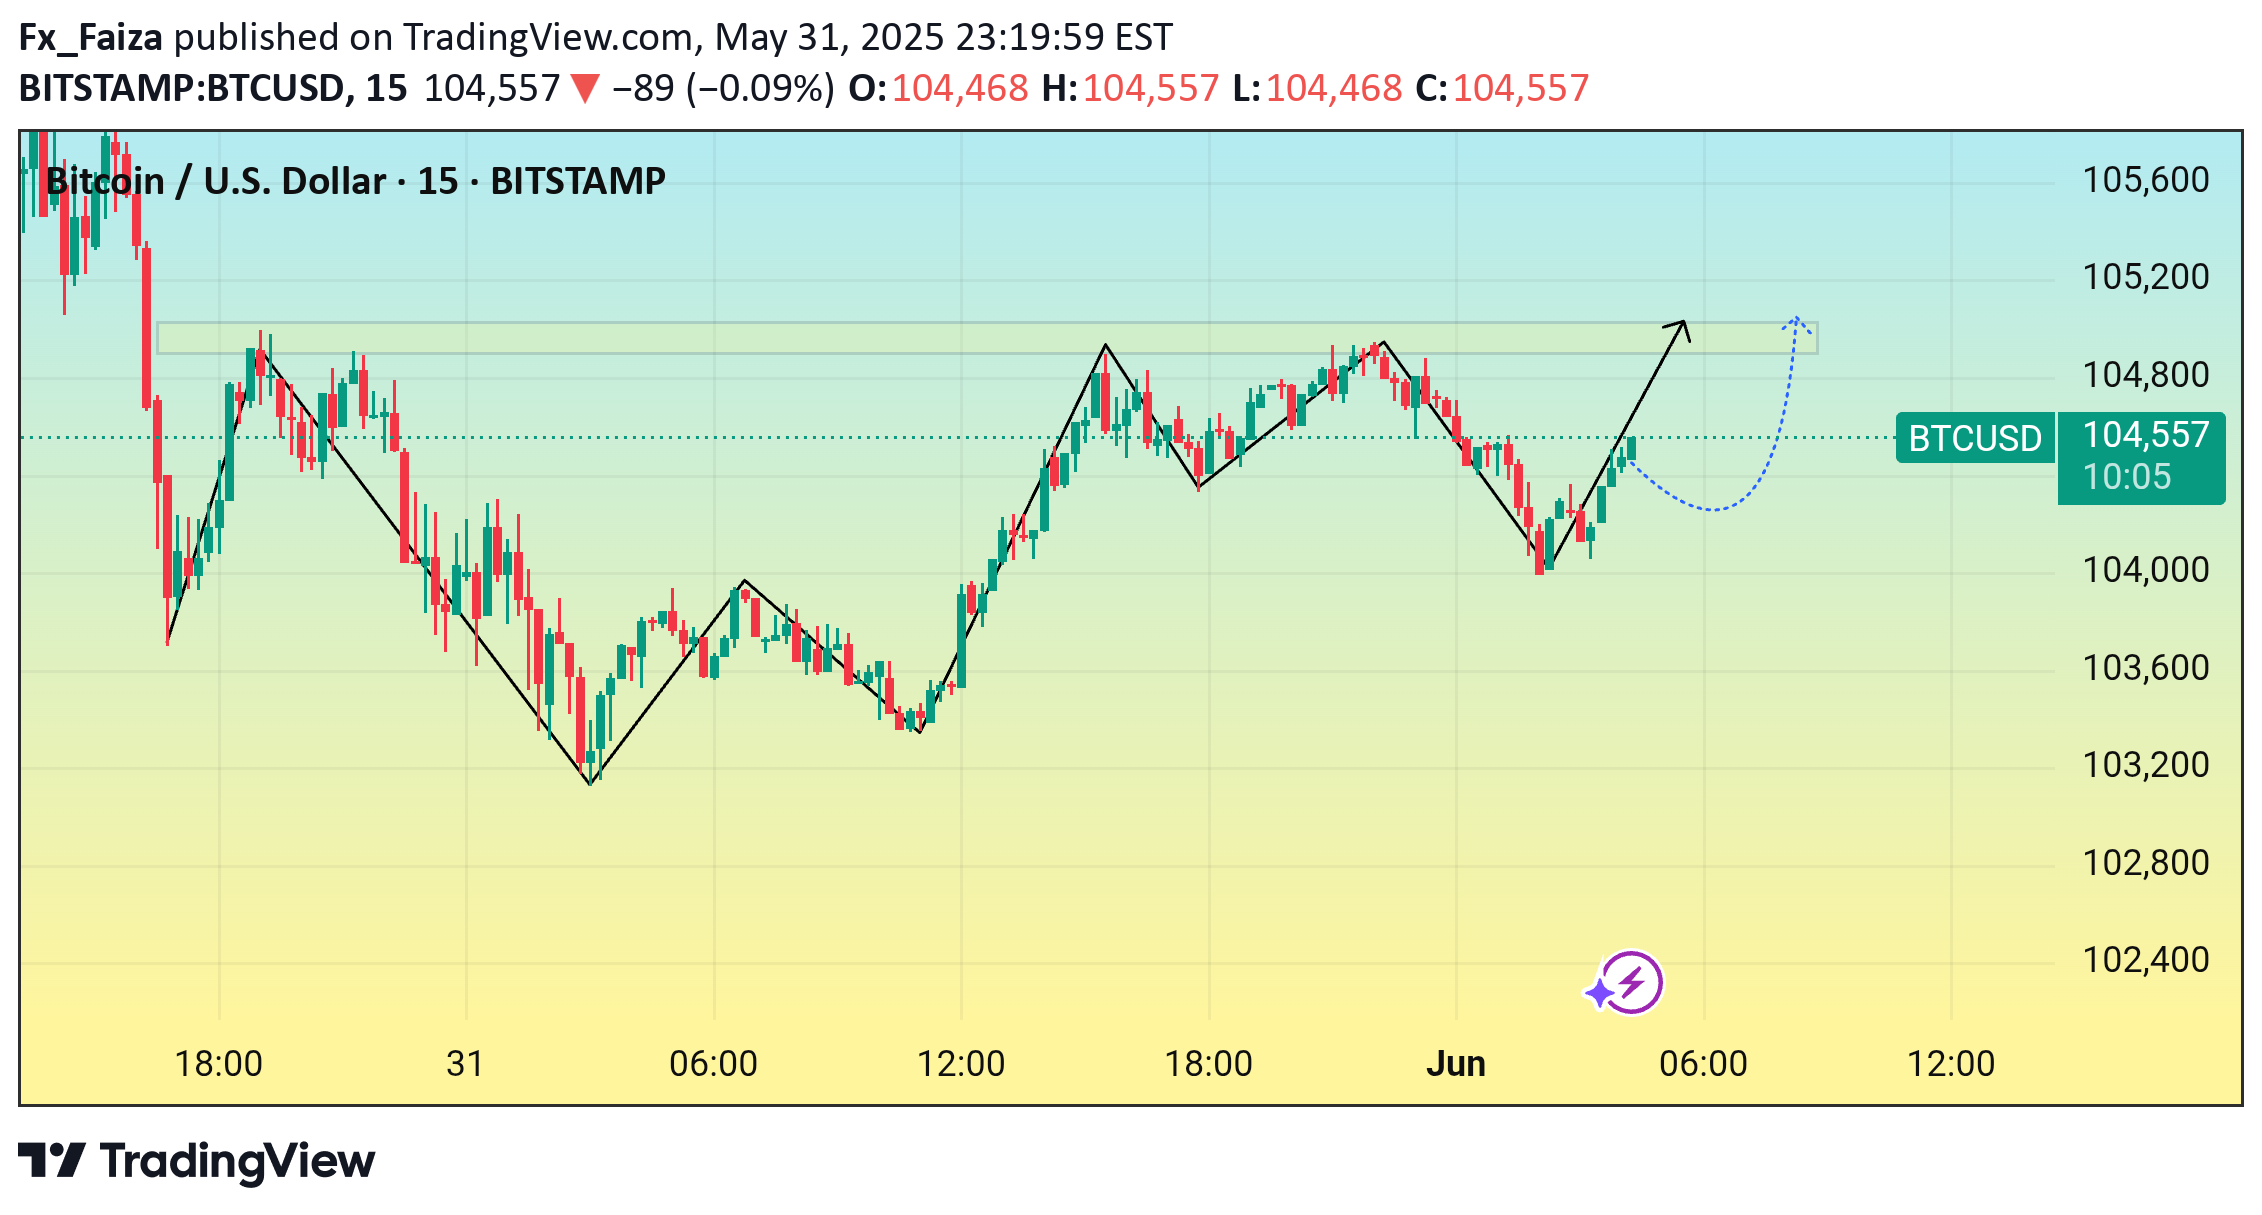
Bitcoin currently trading at $104,496. The chart includes a bullish projection, suggesting a possible short-term upward move toward the $105,000 resistance level. If this level is reached and broken, a continuation of the uptrend could follow. The black and blue arrows indicate potential bullish momentum and consolidation phases.
Fx_Faiza
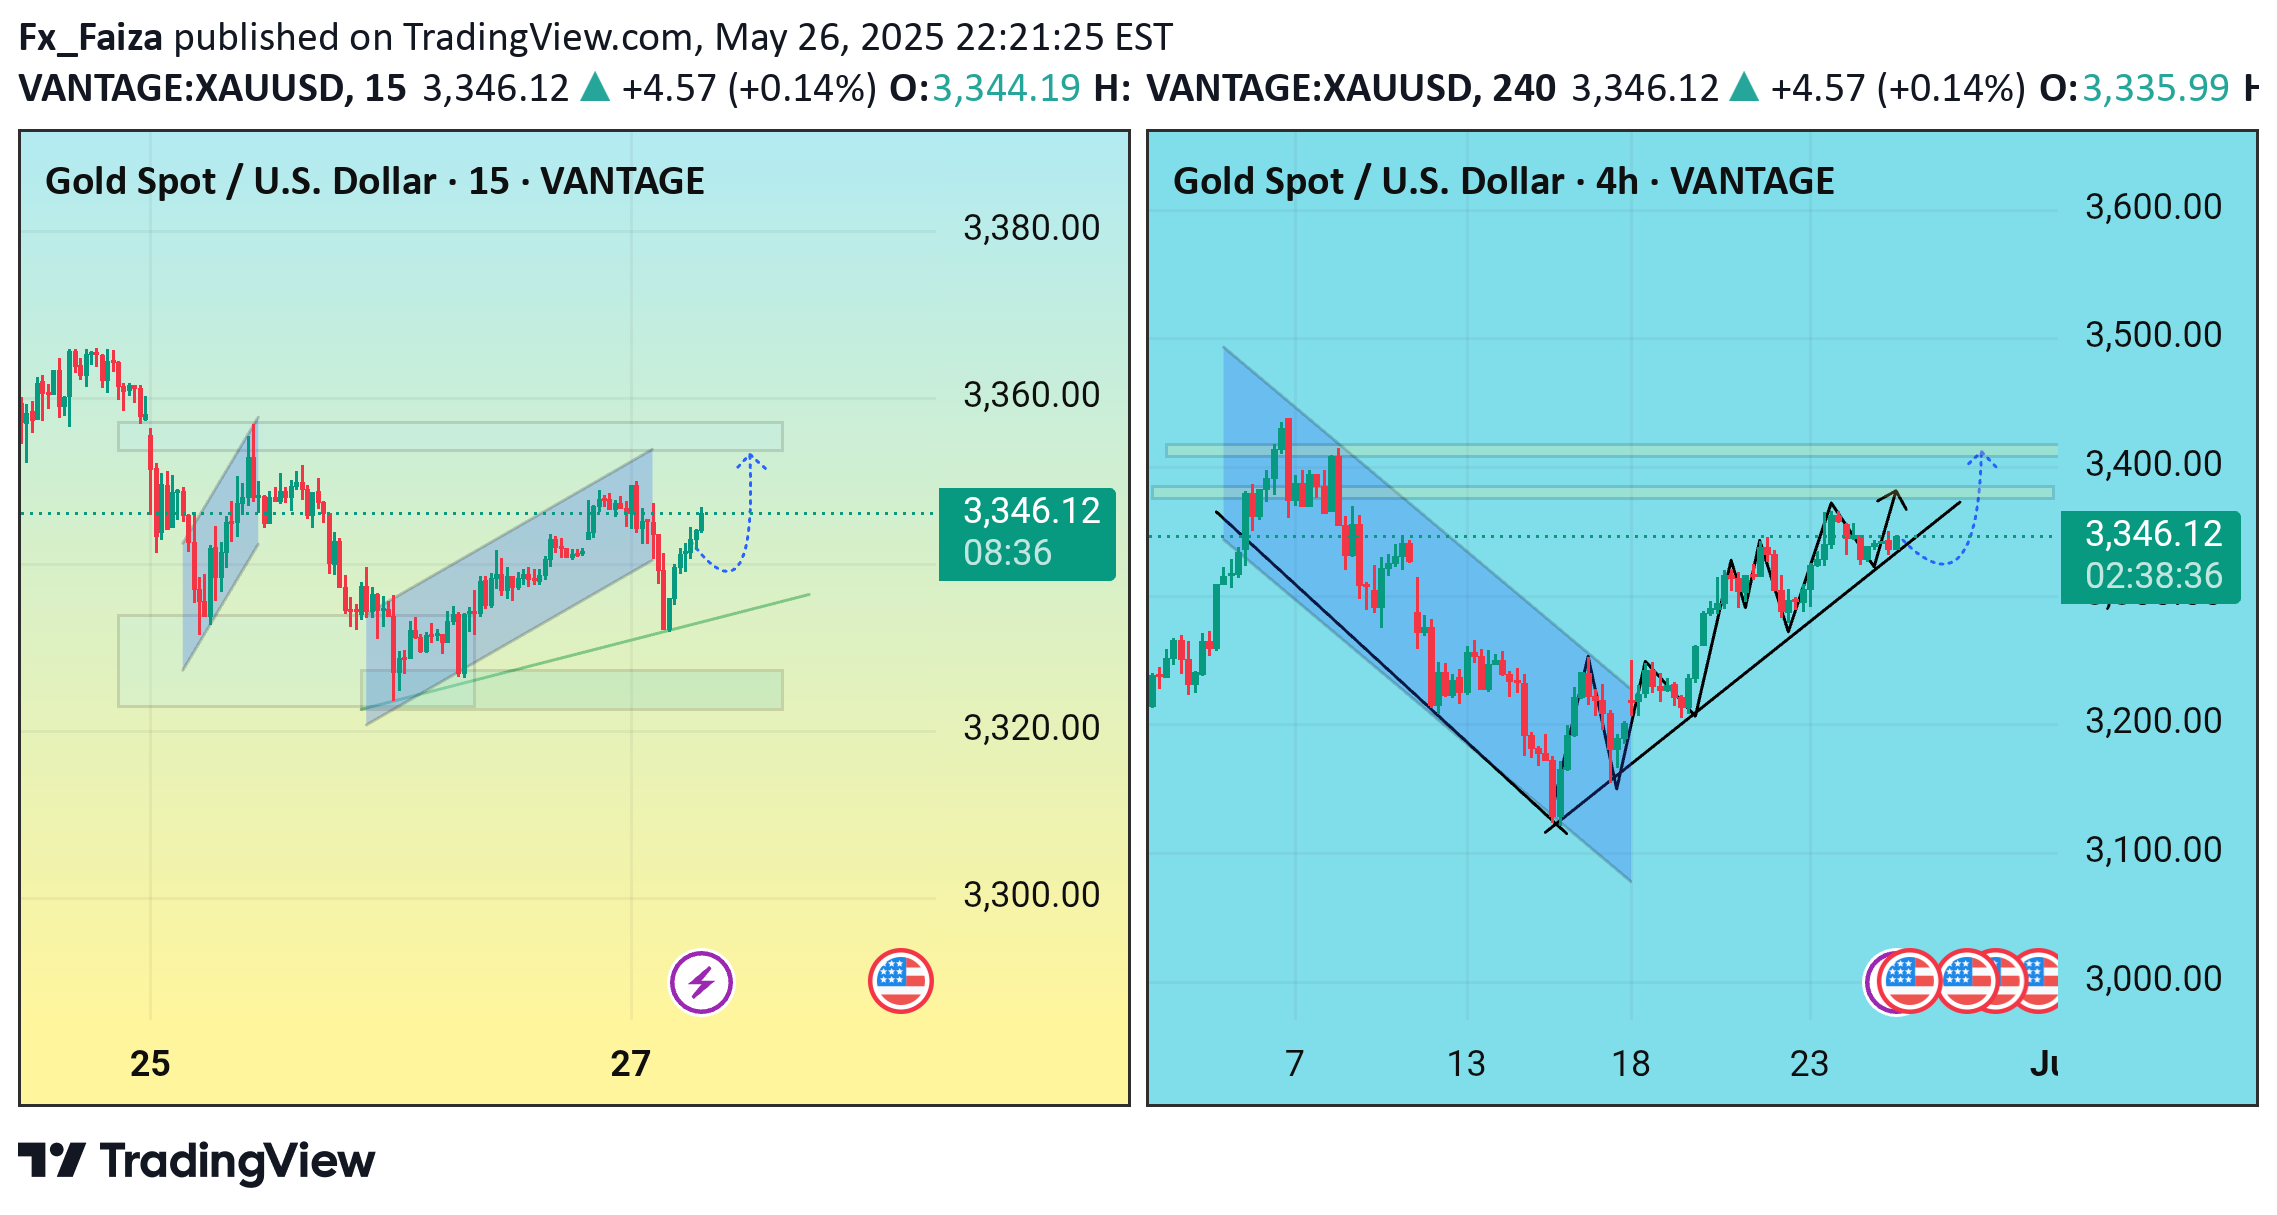
15-Minute Chart (Intraday View)Trend Structure: Price has been trading within a small ascending channel after a prior consolidation.Breakout Anticipation: The recent rejection at the top of the channel followed by a pullback to near the lower trendline suggests a potential bullish continuation. The dashed blue arrow implies a forecast for a bounce off the trendline and a breakout to the upside.Support Zone: There's a visible horizontal demand zone around the 3330–3340 area, acting as a short-term support.Bias: Bullish if price sustains above this support and breaks the local structure high.---4-Hour Chart (Swing/Medium-Term View)Primary Pattern: A falling wedge breakout occurred earlier (bullish reversal pattern), leading to a strong bullish impulse.Ascending Trendline: Price is consistently respecting an upward sloping trendline, indicating bullish market structure with higher lows.Resistance Area: Horizontal resistance between 3340–3400, as shown by the multiple yellow shaded zones.Projected Move: Blue dotted line indicates an expected consolidation or pullback before a continuation move toward 3400+. The solid black arrow suggests a more immediate bullish scenario.---Overall Analysis & OutlookTrend: Bullish on both intraday and swing timeframes.Key Levels:Support: 3320–3340Resistance: 3380–3400Trading Idea:Aggressive Entry: Long from current support zone targeting 3380–3400, with tight stop below 3320.Conservative Entry: Wait for a confirmed breakout above 3380 with a retest for entry.
Fx_Faiza
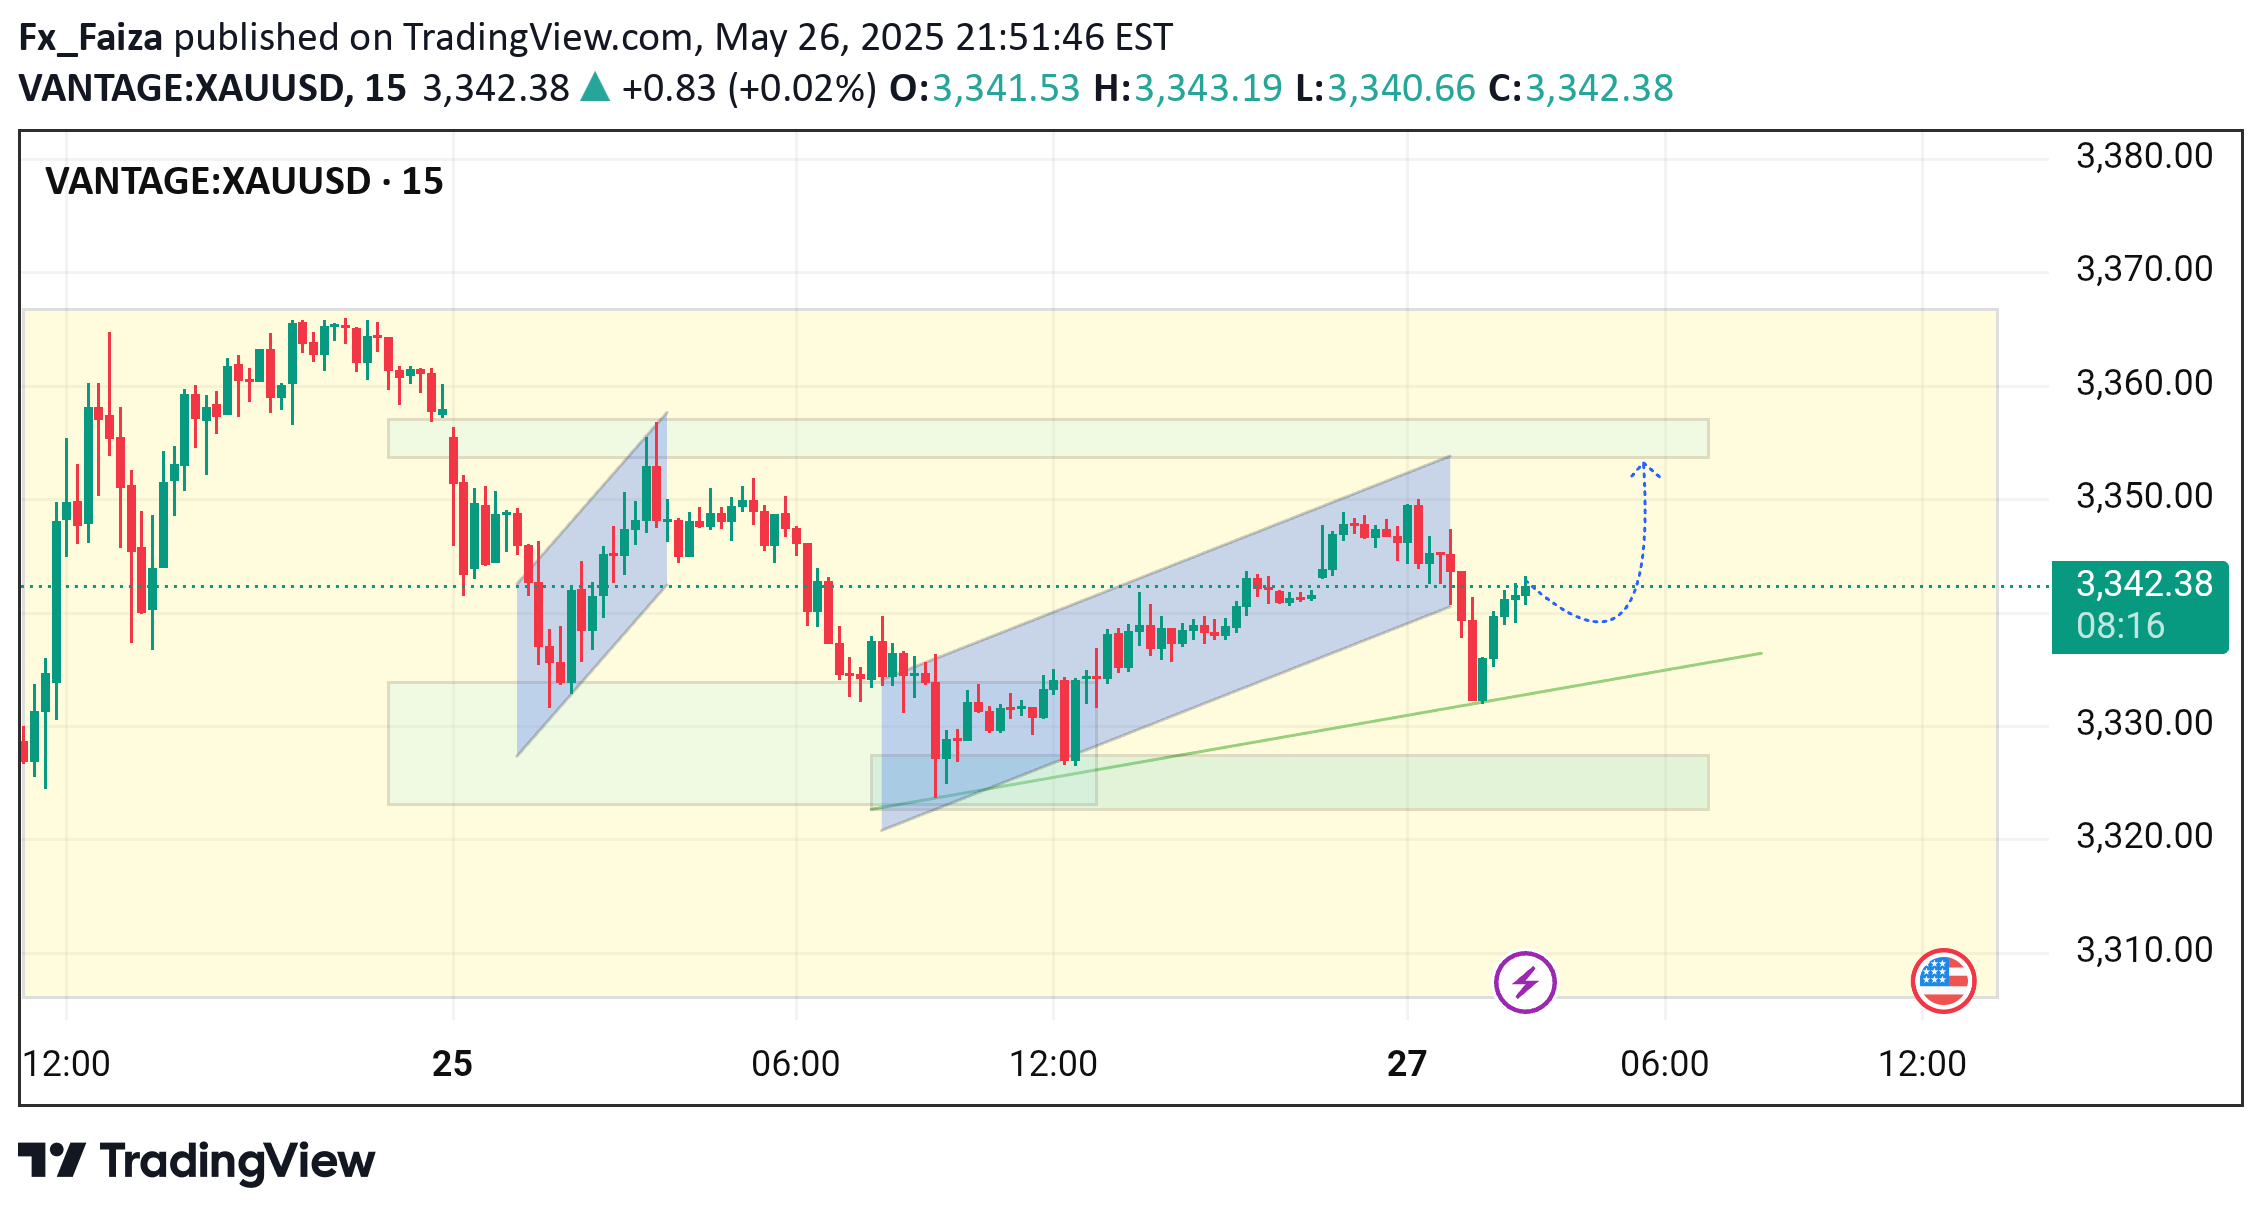
Chart Overview:Instrument: (XAU/USD)Timeframe: 15-minuteCurrent Price: $3,341.07Price Action: Market recently exited a rising channel and is currently consolidating near the upper zone of a prior accumulation range.---Key Technical Observations:1. Rising Channel (Bullish Trend Continuation):A rising channel broke down recently, suggesting short-term weakness.However, price is still holding above the diagonal trendline support (green).2. Support and Demand Zone (Green Box around 3,325 – 3,330):This lower area previously acted as a demand zone where buying interest emerged.Price respected this zone multiple times, reinforcing it as strong short-term support.3. Current Consolidation Near Resistance:Price is consolidating just below a minor resistance zone (~3,350).The dotted blue arrow suggests an anticipated bullish breakout toward the upper resistance band (~3,355–3,360).4. Price Structure Suggests Higher Lows:A series of higher lows is forming, hinting at potential bullish pressure building.5. Indicators Not Visible:No RSI, MACD, or volume are visible in this chart, which would be helpful for confirmation.Based on price action alone, buyers are gaining strength near the trendline support.---Potential Trading Plan:Bullish Scenario:Entry: Upon bullish breakout above ~$3,345–3,348Target: ~$3,355–3,360 (previous supply zone)Stop: Below the trendline or $3,330 to minimize riskBearish Scenario (if support fails):Entry: Break and close below ~$3,330Target: Revisit of lower green zone ~$3,320Stop: Above $3,340
Fx_Faiza
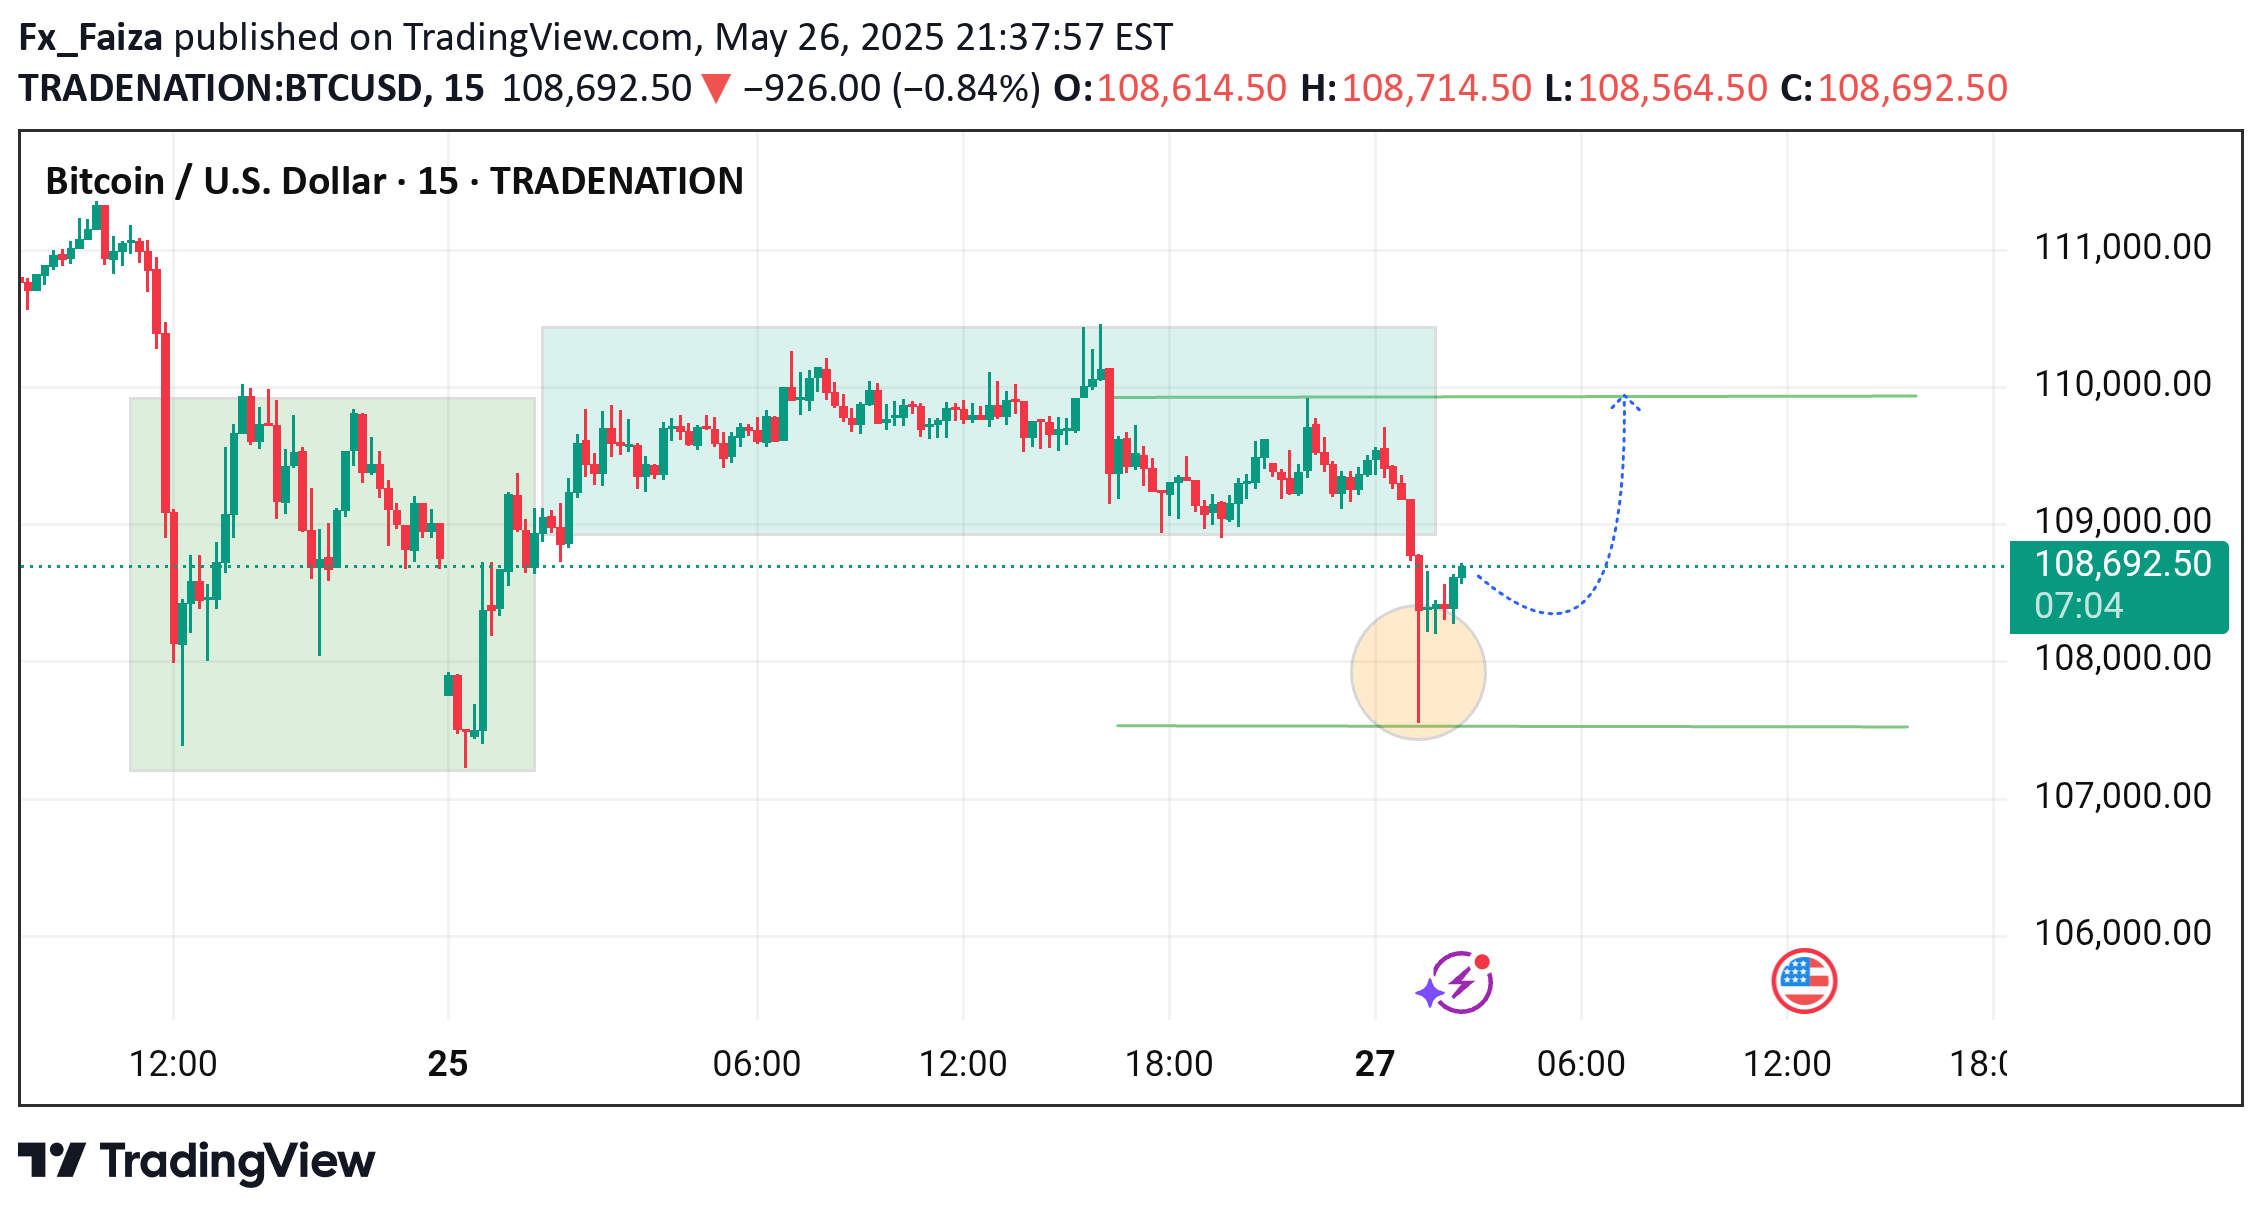
Market Context & Structure:Sideways Range Movement:The chart shows two primary consolidation (range-bound) zones marked with green shaded rectangles. BTC has been trading within these horizontal zones for a considerable period, suggesting indecision or accumulation/distribution phases.Current Breakdown:Recently, BTC broke down from the upper consolidation range (~109,800–110,200 zone) and dipped below, forming a bearish move. This is confirmed by the red candles and the price moving out of the prior horizontal range.---Key Levels:Resistance Zone: ~110,000Marked by the upper green line and previous consolidation highs. This will likely act as resistance if price tries to move up again.Support Zone: ~107,400Marked by the lower green horizontal line. Price touched this area and bounced slightly (as shown by the highlighted circle).---Candlestick Patterns:Bearish Momentum:Multiple red candles indicate selling pressure. However, the recent candle shows a potential hammer-like recovery wick, suggesting some buyer interest near the support.---Projection (Dotted Line with Arrow):The chart includes a bullish recovery scenario illustrated with a blue dotted line. This indicates a possible short-term reversal from the support area with a target to retest the previous resistance around 110,000.---Interpretation:If Price Holds Above Support (107,400):A potential bounce and retest of the 110,000 resistance is possible — a bullish reversal setup.If Support Breaks Decisively:Further downside may be expected, possibly toward 106,000 or lower. Sellers would gain control.---Trading Plan (Not Financial Advice):Long Entry: Near 107,400 if bullish confirmation forms (e.g., bullish engulfing or higher low).Stop Loss: Below 107,000 to limit downside.Target: 109,800–110,200 zone.
Disclaimer
Any content and materials included in Sahmeto's website and official communication channels are a compilation of personal opinions and analyses and are not binding. They do not constitute any recommendation for buying, selling, entering or exiting the stock market and cryptocurrency market. Also, all news and analyses included in the website and channels are merely republished information from official and unofficial domestic and foreign sources, and it is obvious that users of the said content are responsible for following up and ensuring the authenticity and accuracy of the materials. Therefore, while disclaiming responsibility, it is declared that the responsibility for any decision-making, action, and potential profit and loss in the capital market and cryptocurrency market lies with the trader.