Technical analysis by Fx_Faiza about Symbol PAXG: Buy recommendation (5/27/2025)

Fx_Faiza
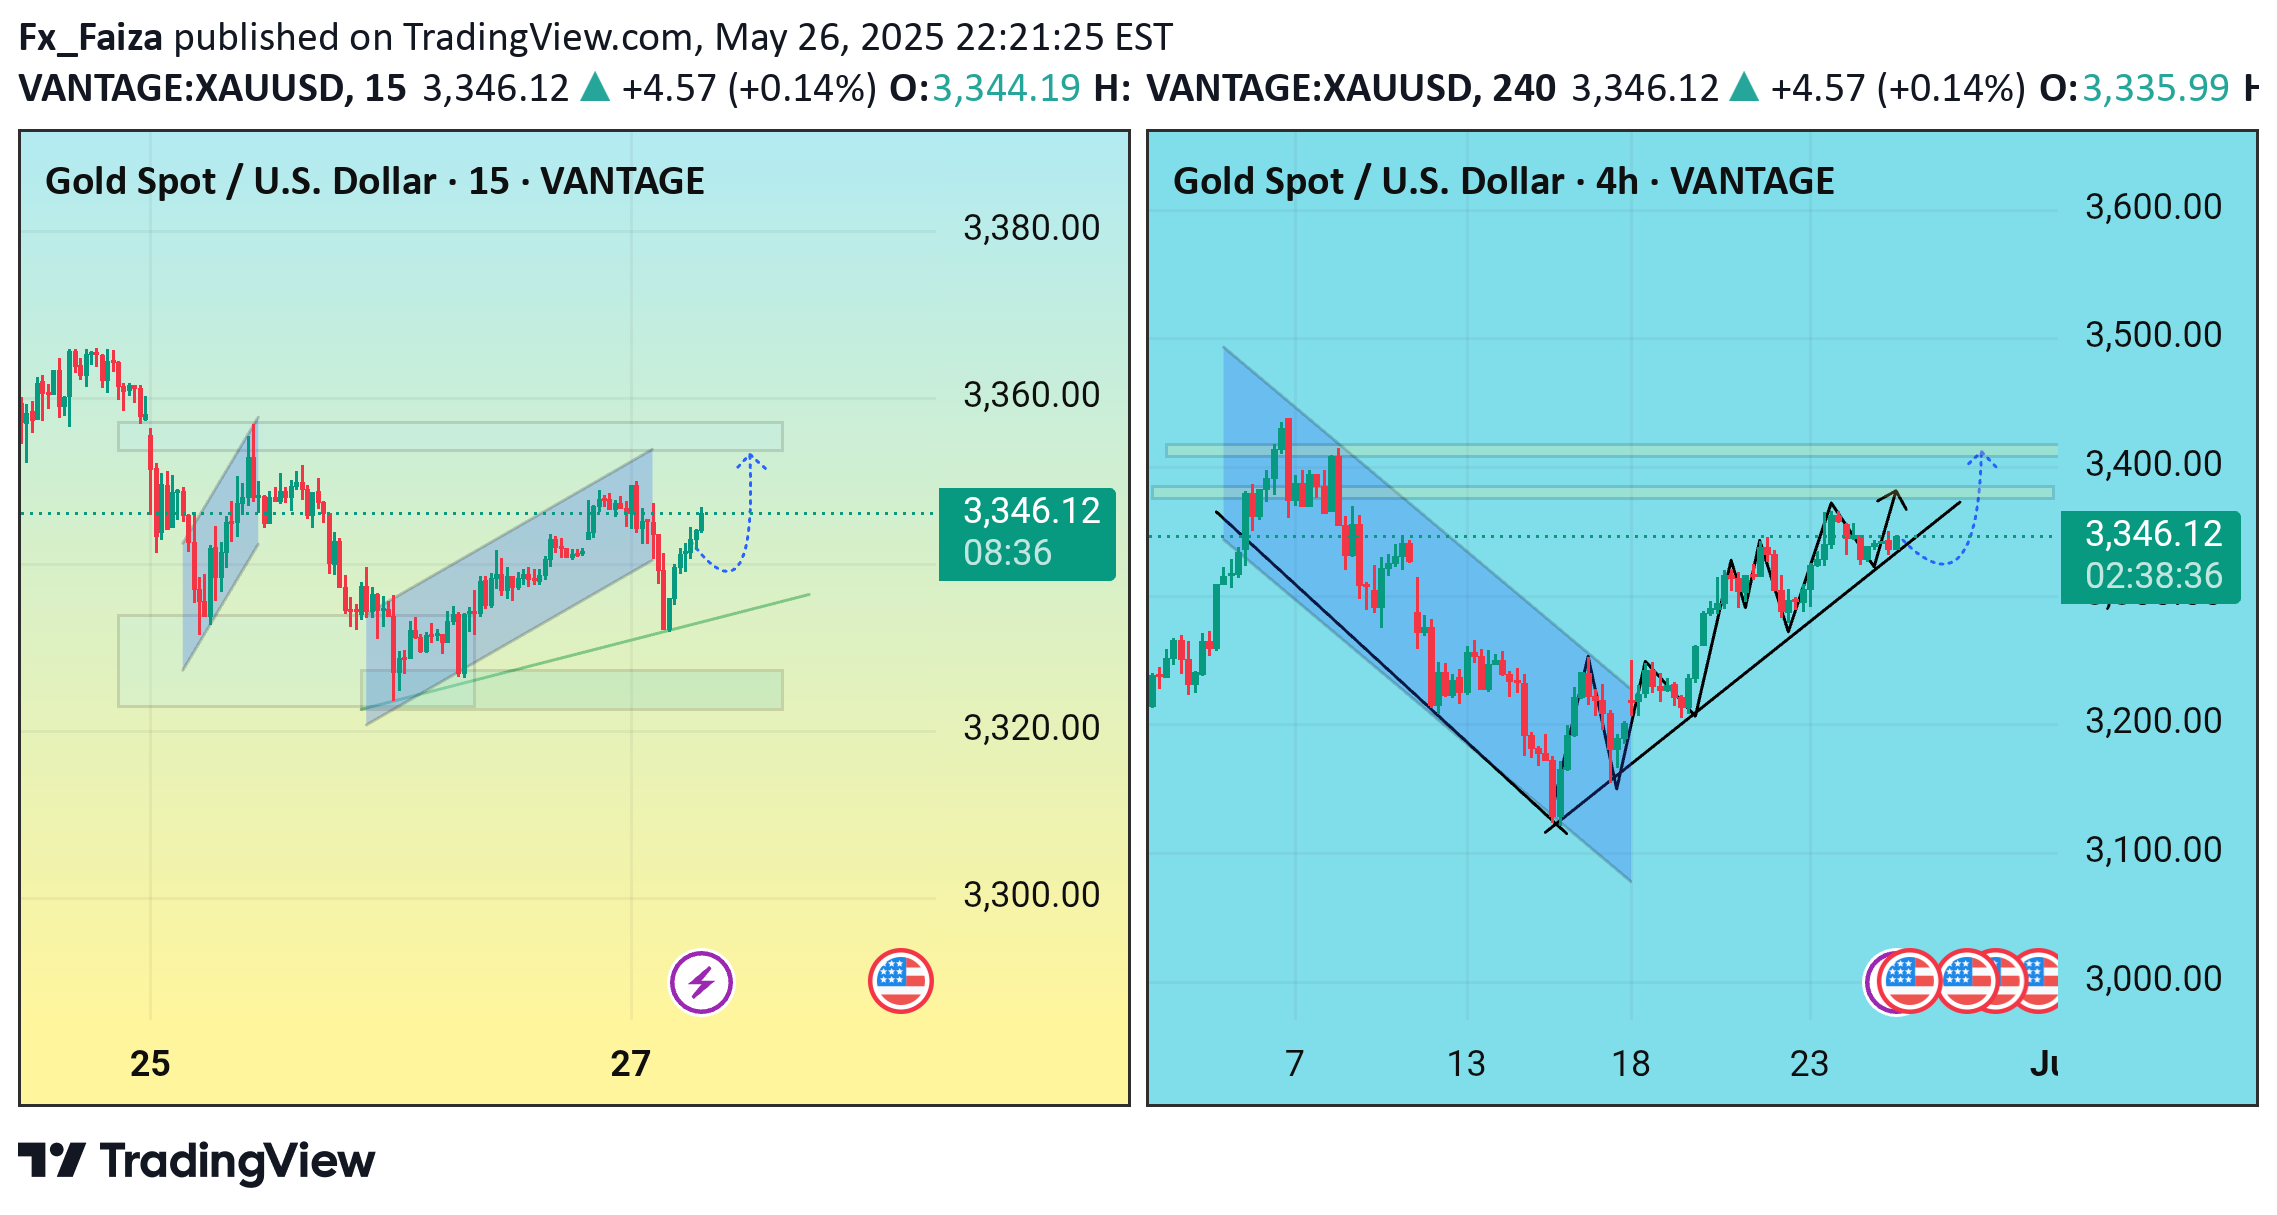
15-Minute Chart (Intraday View)Trend Structure: Price has been trading within a small ascending channel after a prior consolidation.Breakout Anticipation: The recent rejection at the top of the channel followed by a pullback to near the lower trendline suggests a potential bullish continuation. The dashed blue arrow implies a forecast for a bounce off the trendline and a breakout to the upside.Support Zone: There's a visible horizontal demand zone around the 3330–3340 area, acting as a short-term support.Bias: Bullish if price sustains above this support and breaks the local structure high.---4-Hour Chart (Swing/Medium-Term View)Primary Pattern: A falling wedge breakout occurred earlier (bullish reversal pattern), leading to a strong bullish impulse.Ascending Trendline: Price is consistently respecting an upward sloping trendline, indicating bullish market structure with higher lows.Resistance Area: Horizontal resistance between 3340–3400, as shown by the multiple yellow shaded zones.Projected Move: Blue dotted line indicates an expected consolidation or pullback before a continuation move toward 3400+. The solid black arrow suggests a more immediate bullish scenario.---Overall Analysis & OutlookTrend: Bullish on both intraday and swing timeframes.Key Levels:Support: 3320–3340Resistance: 3380–3400Trading Idea:Aggressive Entry: Long from current support zone targeting 3380–3400, with tight stop below 3320.Conservative Entry: Wait for a confirmed breakout above 3380 with a retest for entry.
