Technical analysis by Fx_Faiza about Symbol PAXG: Buy recommendation (5/27/2025)

Fx_Faiza
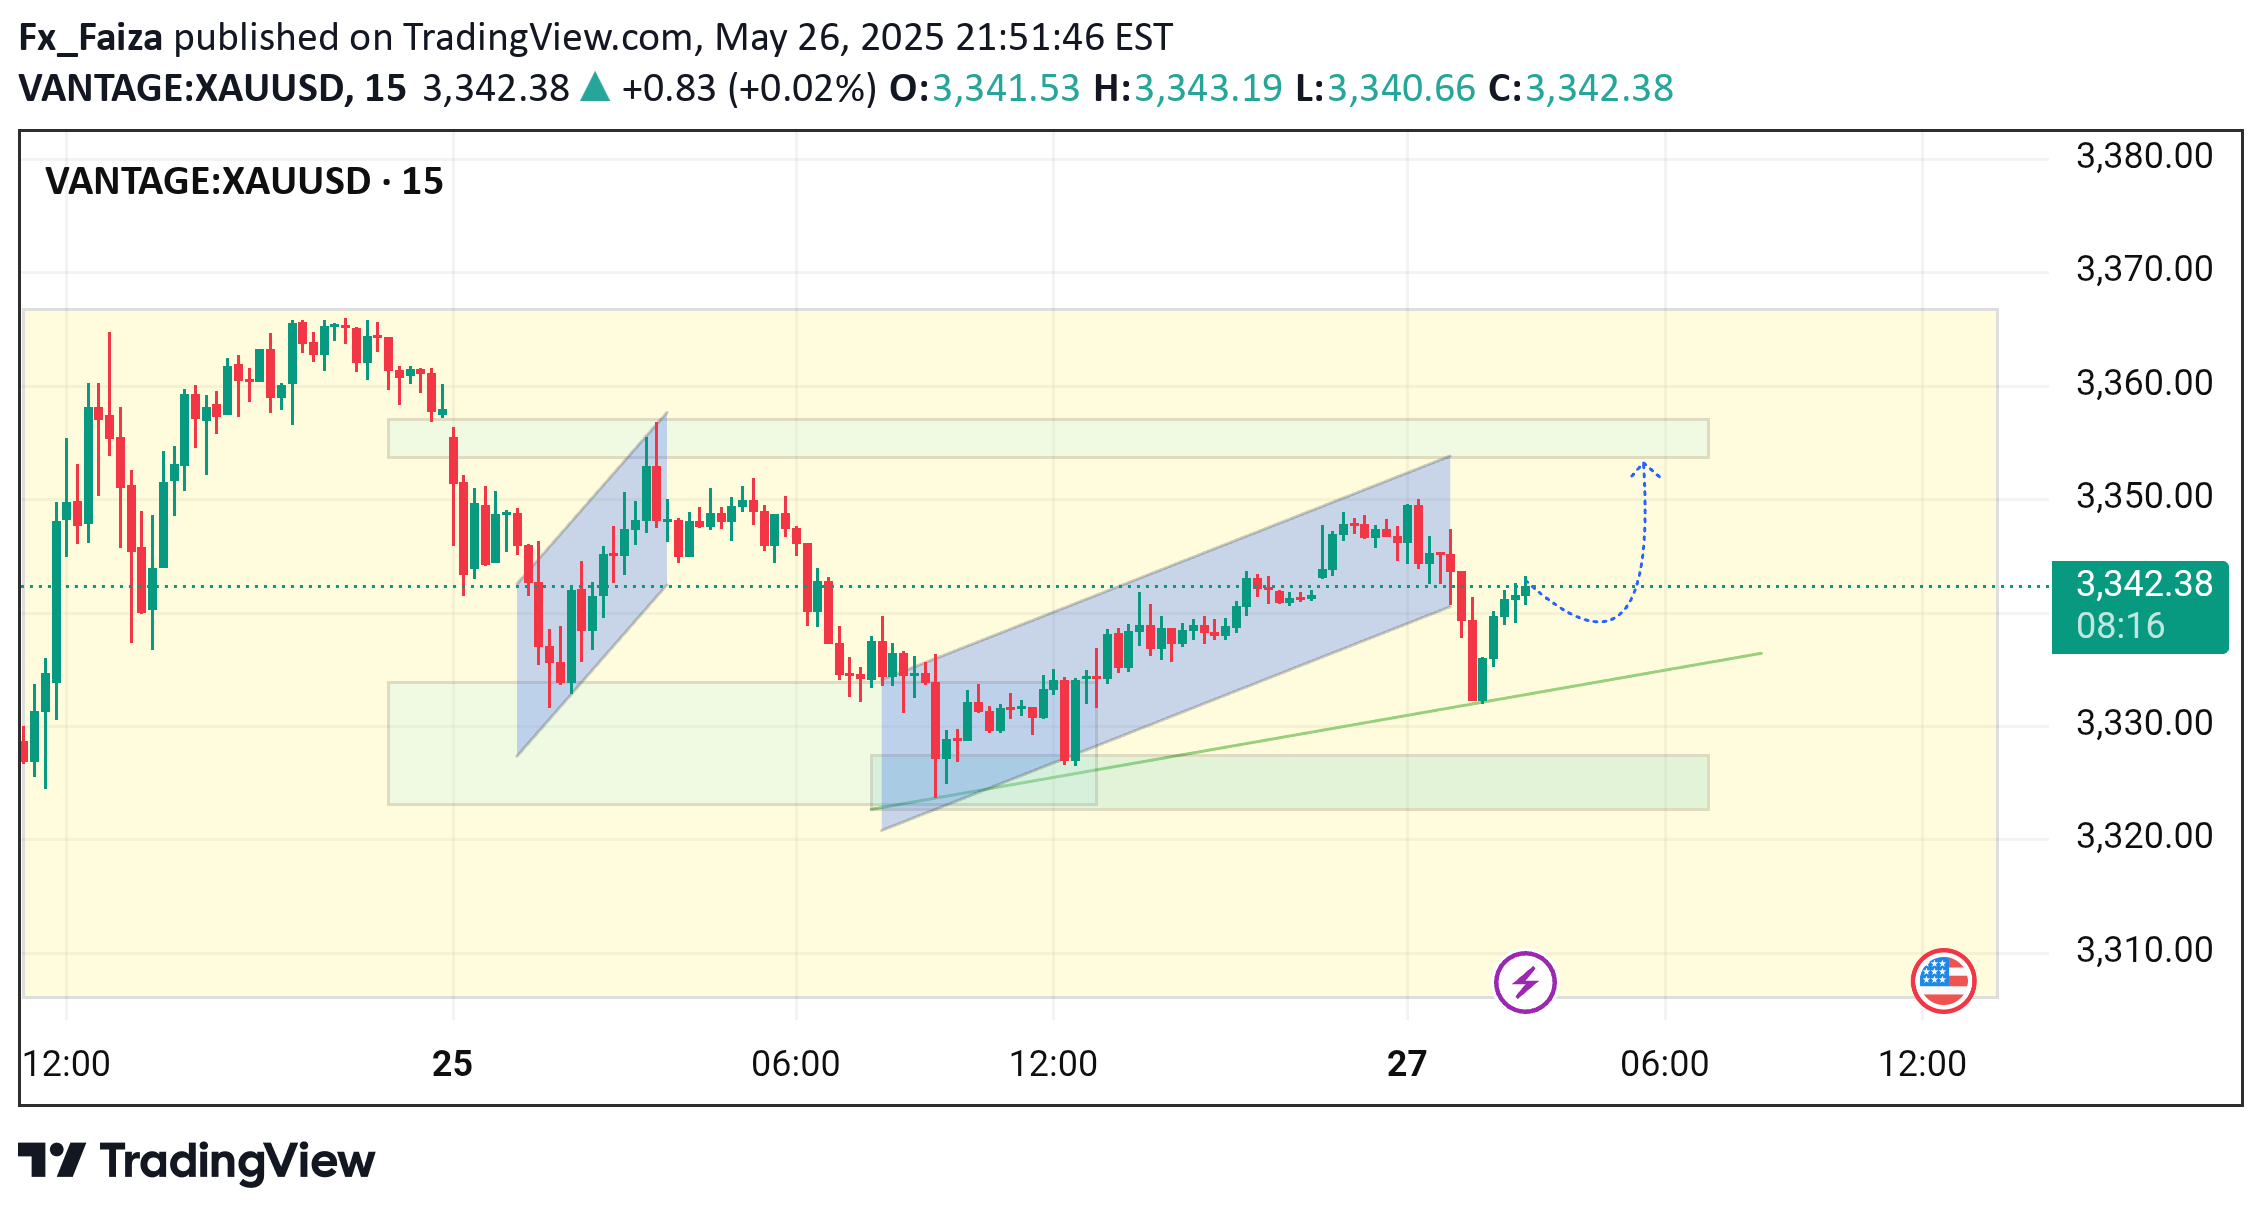
Chart Overview:Instrument: (XAU/USD)Timeframe: 15-minuteCurrent Price: $3,341.07Price Action: Market recently exited a rising channel and is currently consolidating near the upper zone of a prior accumulation range.---Key Technical Observations:1. Rising Channel (Bullish Trend Continuation):A rising channel broke down recently, suggesting short-term weakness.However, price is still holding above the diagonal trendline support (green).2. Support and Demand Zone (Green Box around 3,325 – 3,330):This lower area previously acted as a demand zone where buying interest emerged.Price respected this zone multiple times, reinforcing it as strong short-term support.3. Current Consolidation Near Resistance:Price is consolidating just below a minor resistance zone (~3,350).The dotted blue arrow suggests an anticipated bullish breakout toward the upper resistance band (~3,355–3,360).4. Price Structure Suggests Higher Lows:A series of higher lows is forming, hinting at potential bullish pressure building.5. Indicators Not Visible:No RSI, MACD, or volume are visible in this chart, which would be helpful for confirmation.Based on price action alone, buyers are gaining strength near the trendline support.---Potential Trading Plan:Bullish Scenario:Entry: Upon bullish breakout above ~$3,345–3,348Target: ~$3,355–3,360 (previous supply zone)Stop: Below the trendline or $3,330 to minimize riskBearish Scenario (if support fails):Entry: Break and close below ~$3,330Target: Revisit of lower green zone ~$3,320Stop: Above $3,340
