
Frosty55
@t_Frosty55

What symbols does the trader recommend buying?
Purchase History
پیام های تریدر
Filter
Frosty55
TIA ready for breakout?!

Look at this chart. It seems TIA is ready to break the descending line of resistance..
Frosty55
Radix
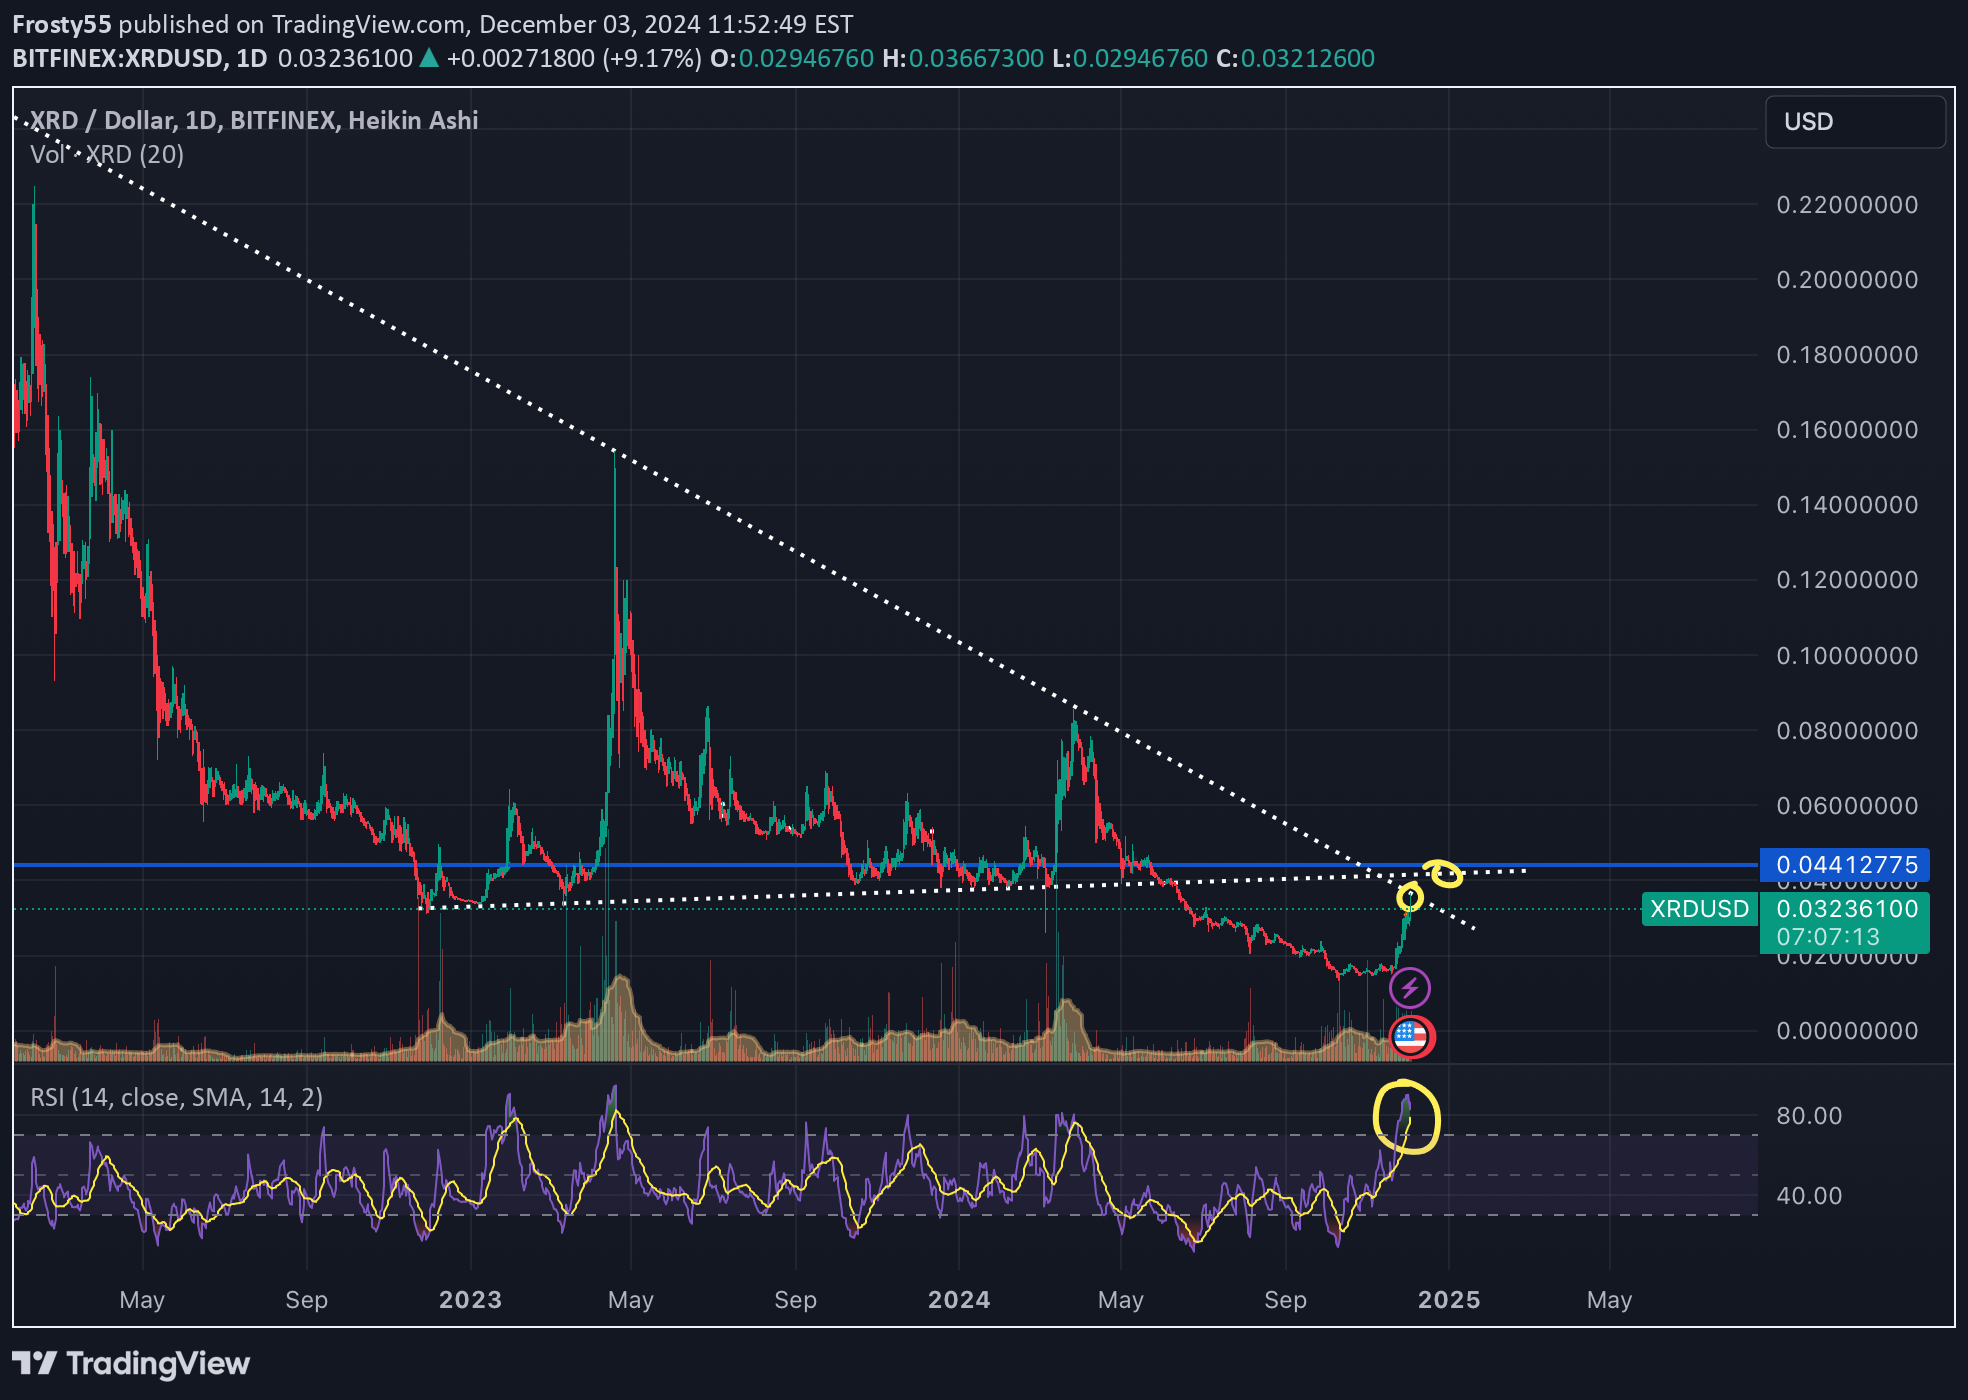
From the 20th of November, Radix has made a nice and strong move upwards. Now it's facing resistance. But look at this huge falling wedge(-ish). If it will break this resistance I expect it will face another resistance (2nd yellow circle). For now I'm expecting a pull back. Also on the RSI it's in overbought area. So take a healthy pullback before it's going higher. Take this opportunity to buy in before going higher. Radix is a great project! DYORAs expected XRDUSD is facing a lot of resistance around the $0.037 when you look at the falling wedge and also the horizontals. Good news on the daily of the lowering of the RSI which was/is overbought
Frosty55
Radix in fallingwedge
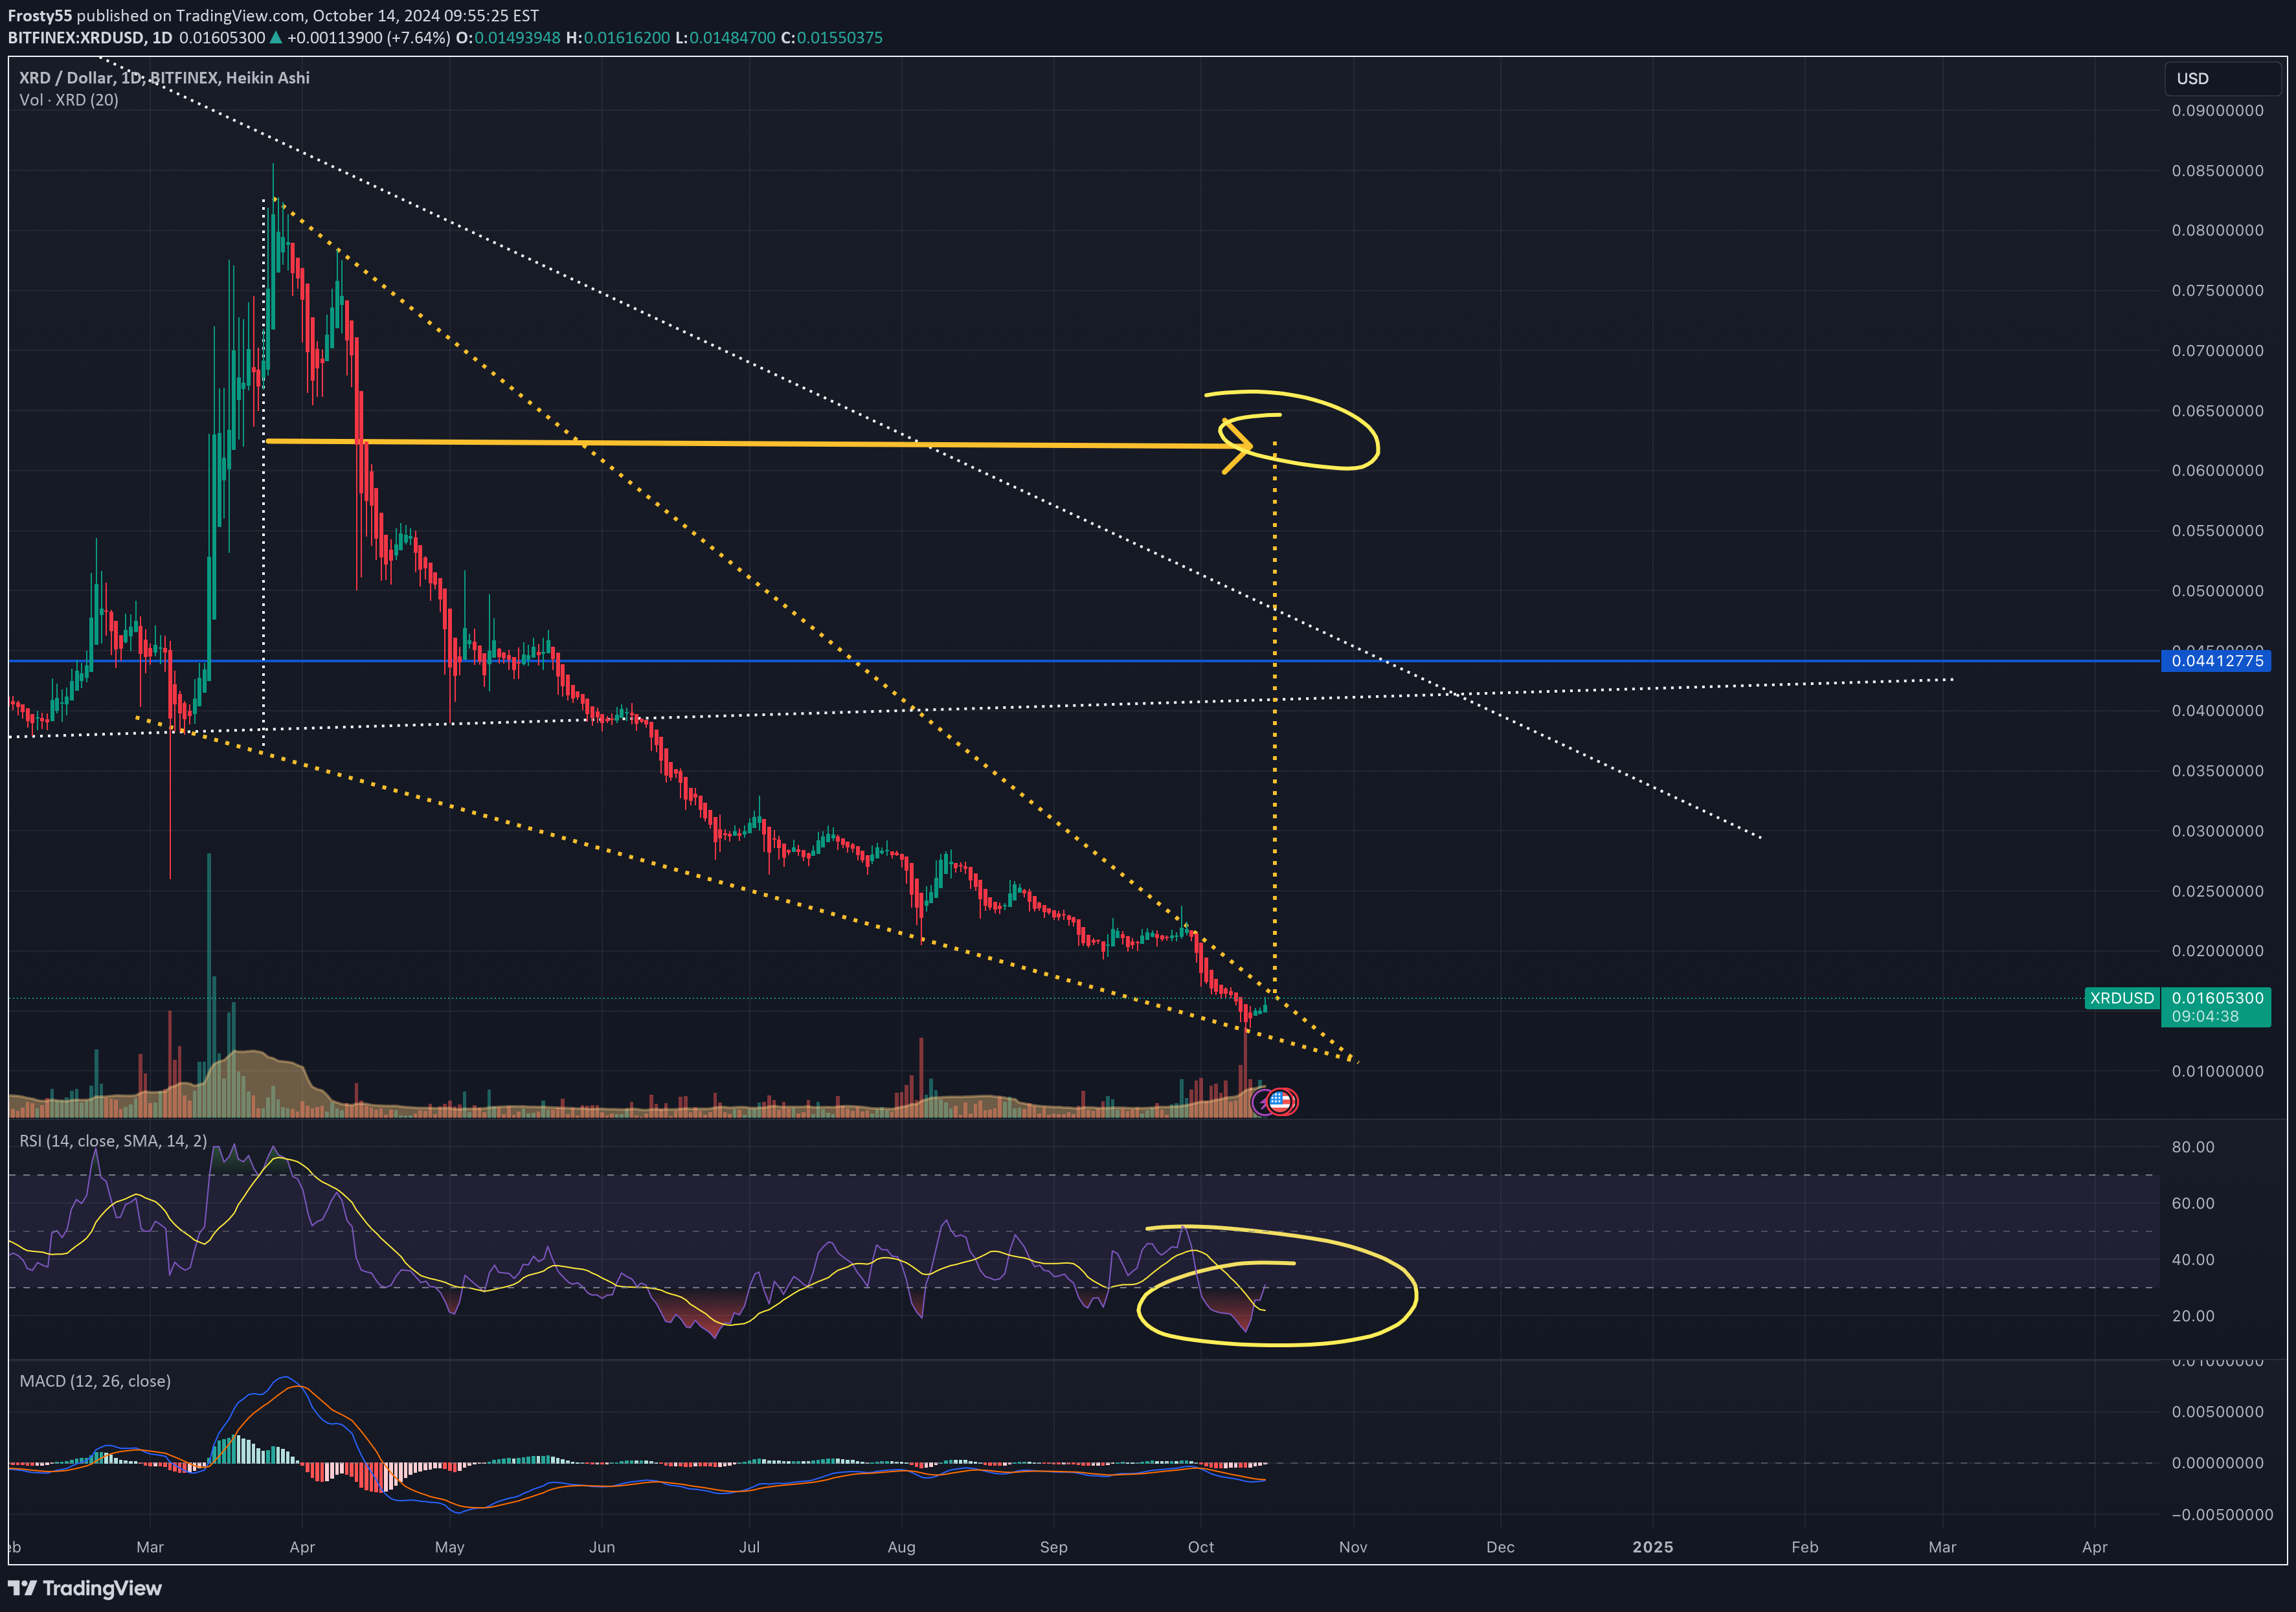
After a long period of oversold the RSI is giving some signs of a reversal. Together with the pattern on the chart there are probably higher pricelevels to achieve.On the 1HR Radix is moving around the lines I draw trying to find supportWhat I said earlier. Radix is trying to go (much) higher. First signs are here. High(er) volume and a try for higher prices:On the 1HR I see a falling wedge pattern which is likely going to break out to the upside:Nice breakout with high volume (as expected) Now lower because of the whole crypto market. Hopefully this level will hold support so we can go higher
Frosty55
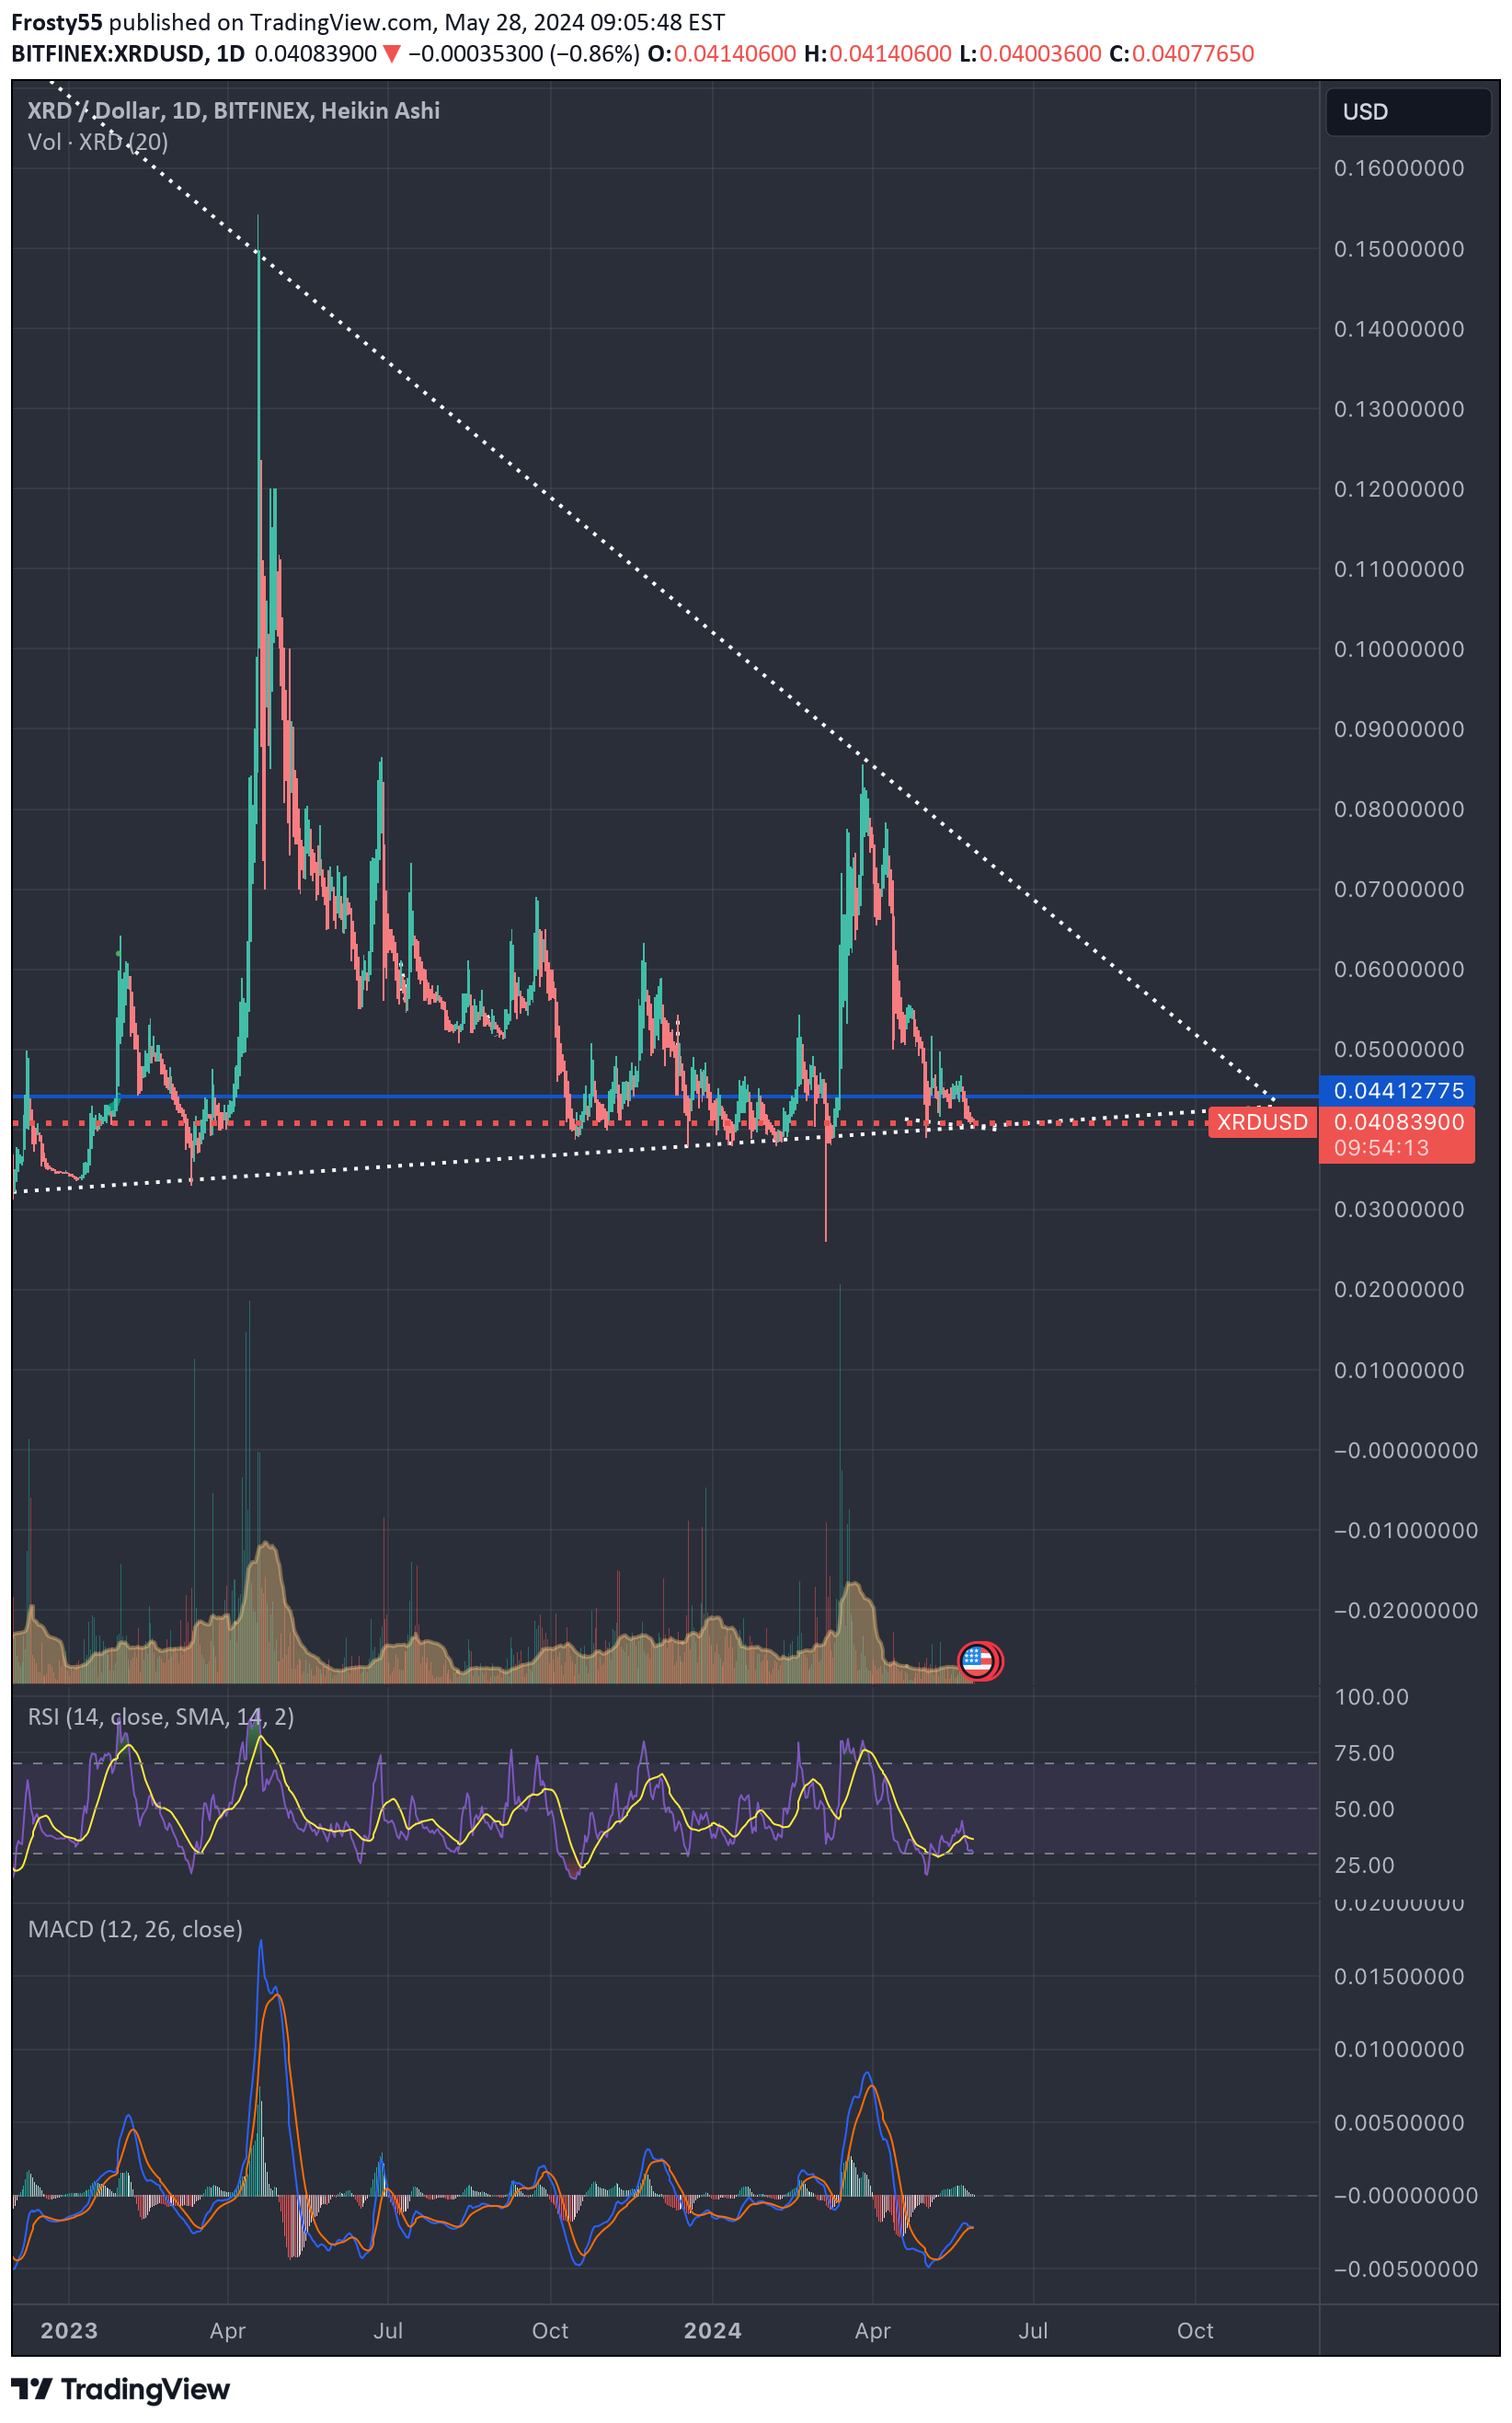
XRD in a downtrend
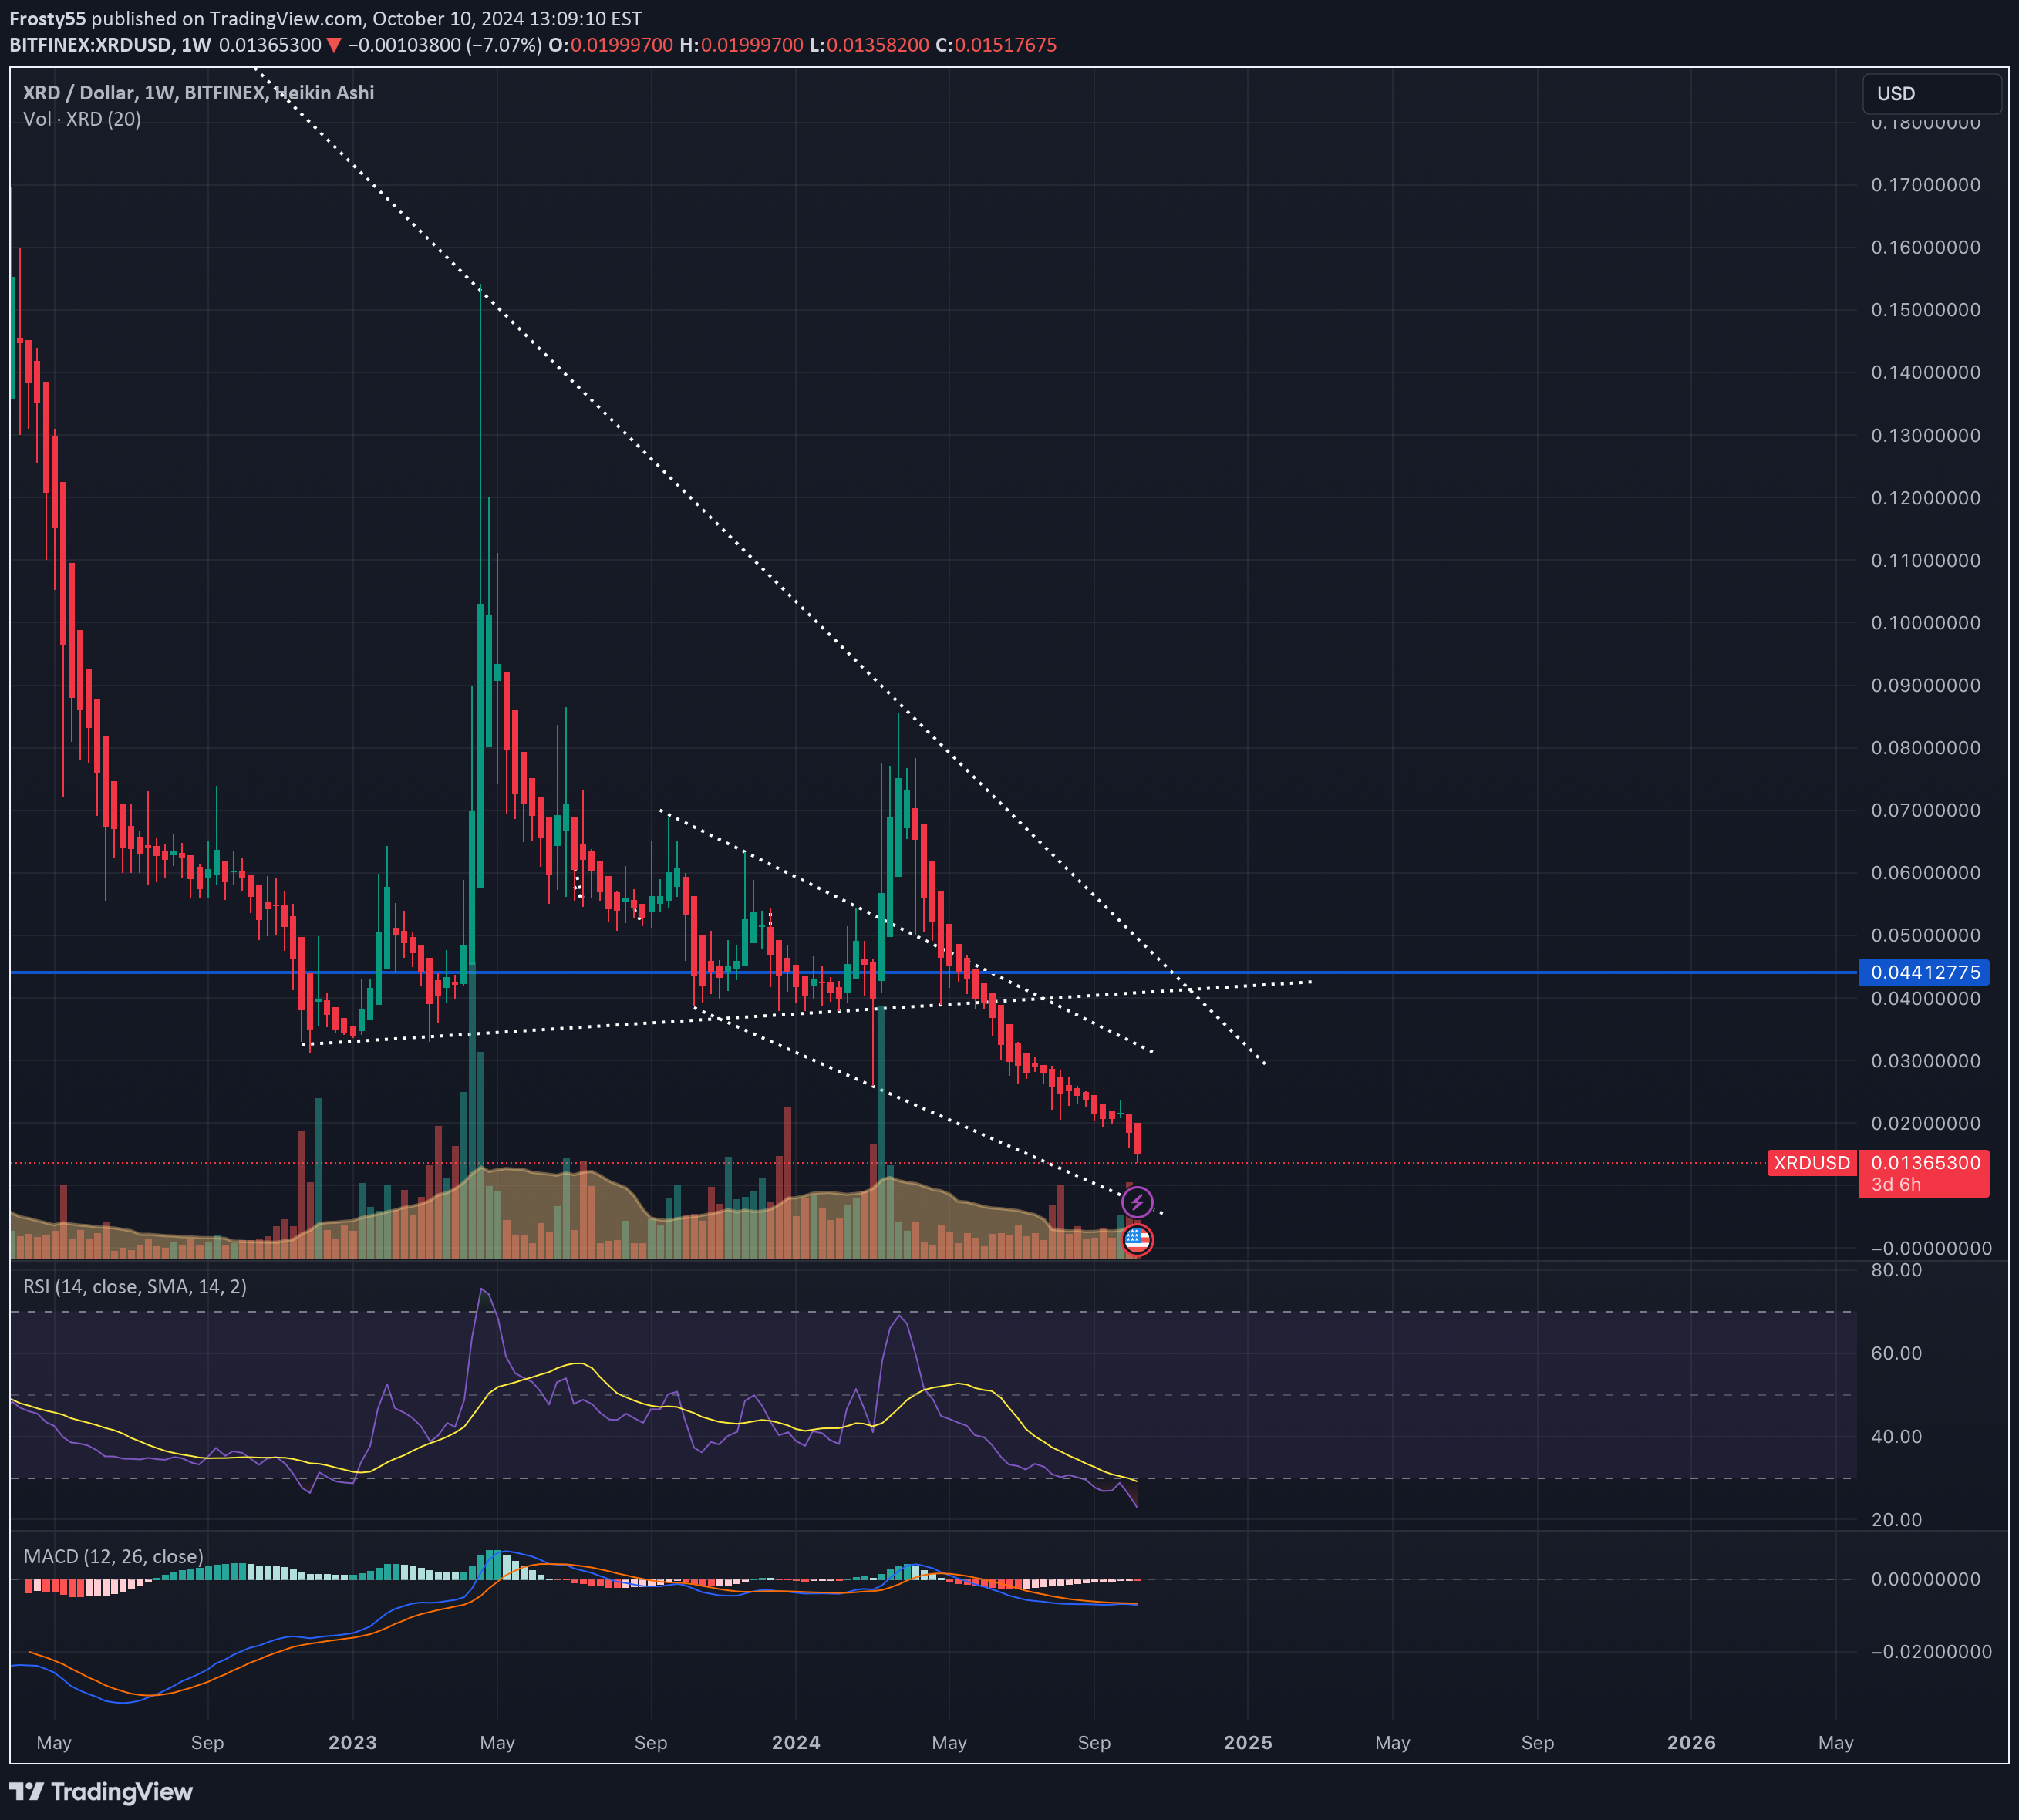
Are we're going to see $0.007 for Radix? The management team of Radix has to do something to pivot the sentimentSee my new analysis about Radix forming a falling wedgeLook for further analysis here:
Frosty55
Radix - Falling wedge
Radix has broke the first resistance of the "tiny falling wedge". Now it's trying to brake the "big falling wedge". The yellow line is the target
Frosty55
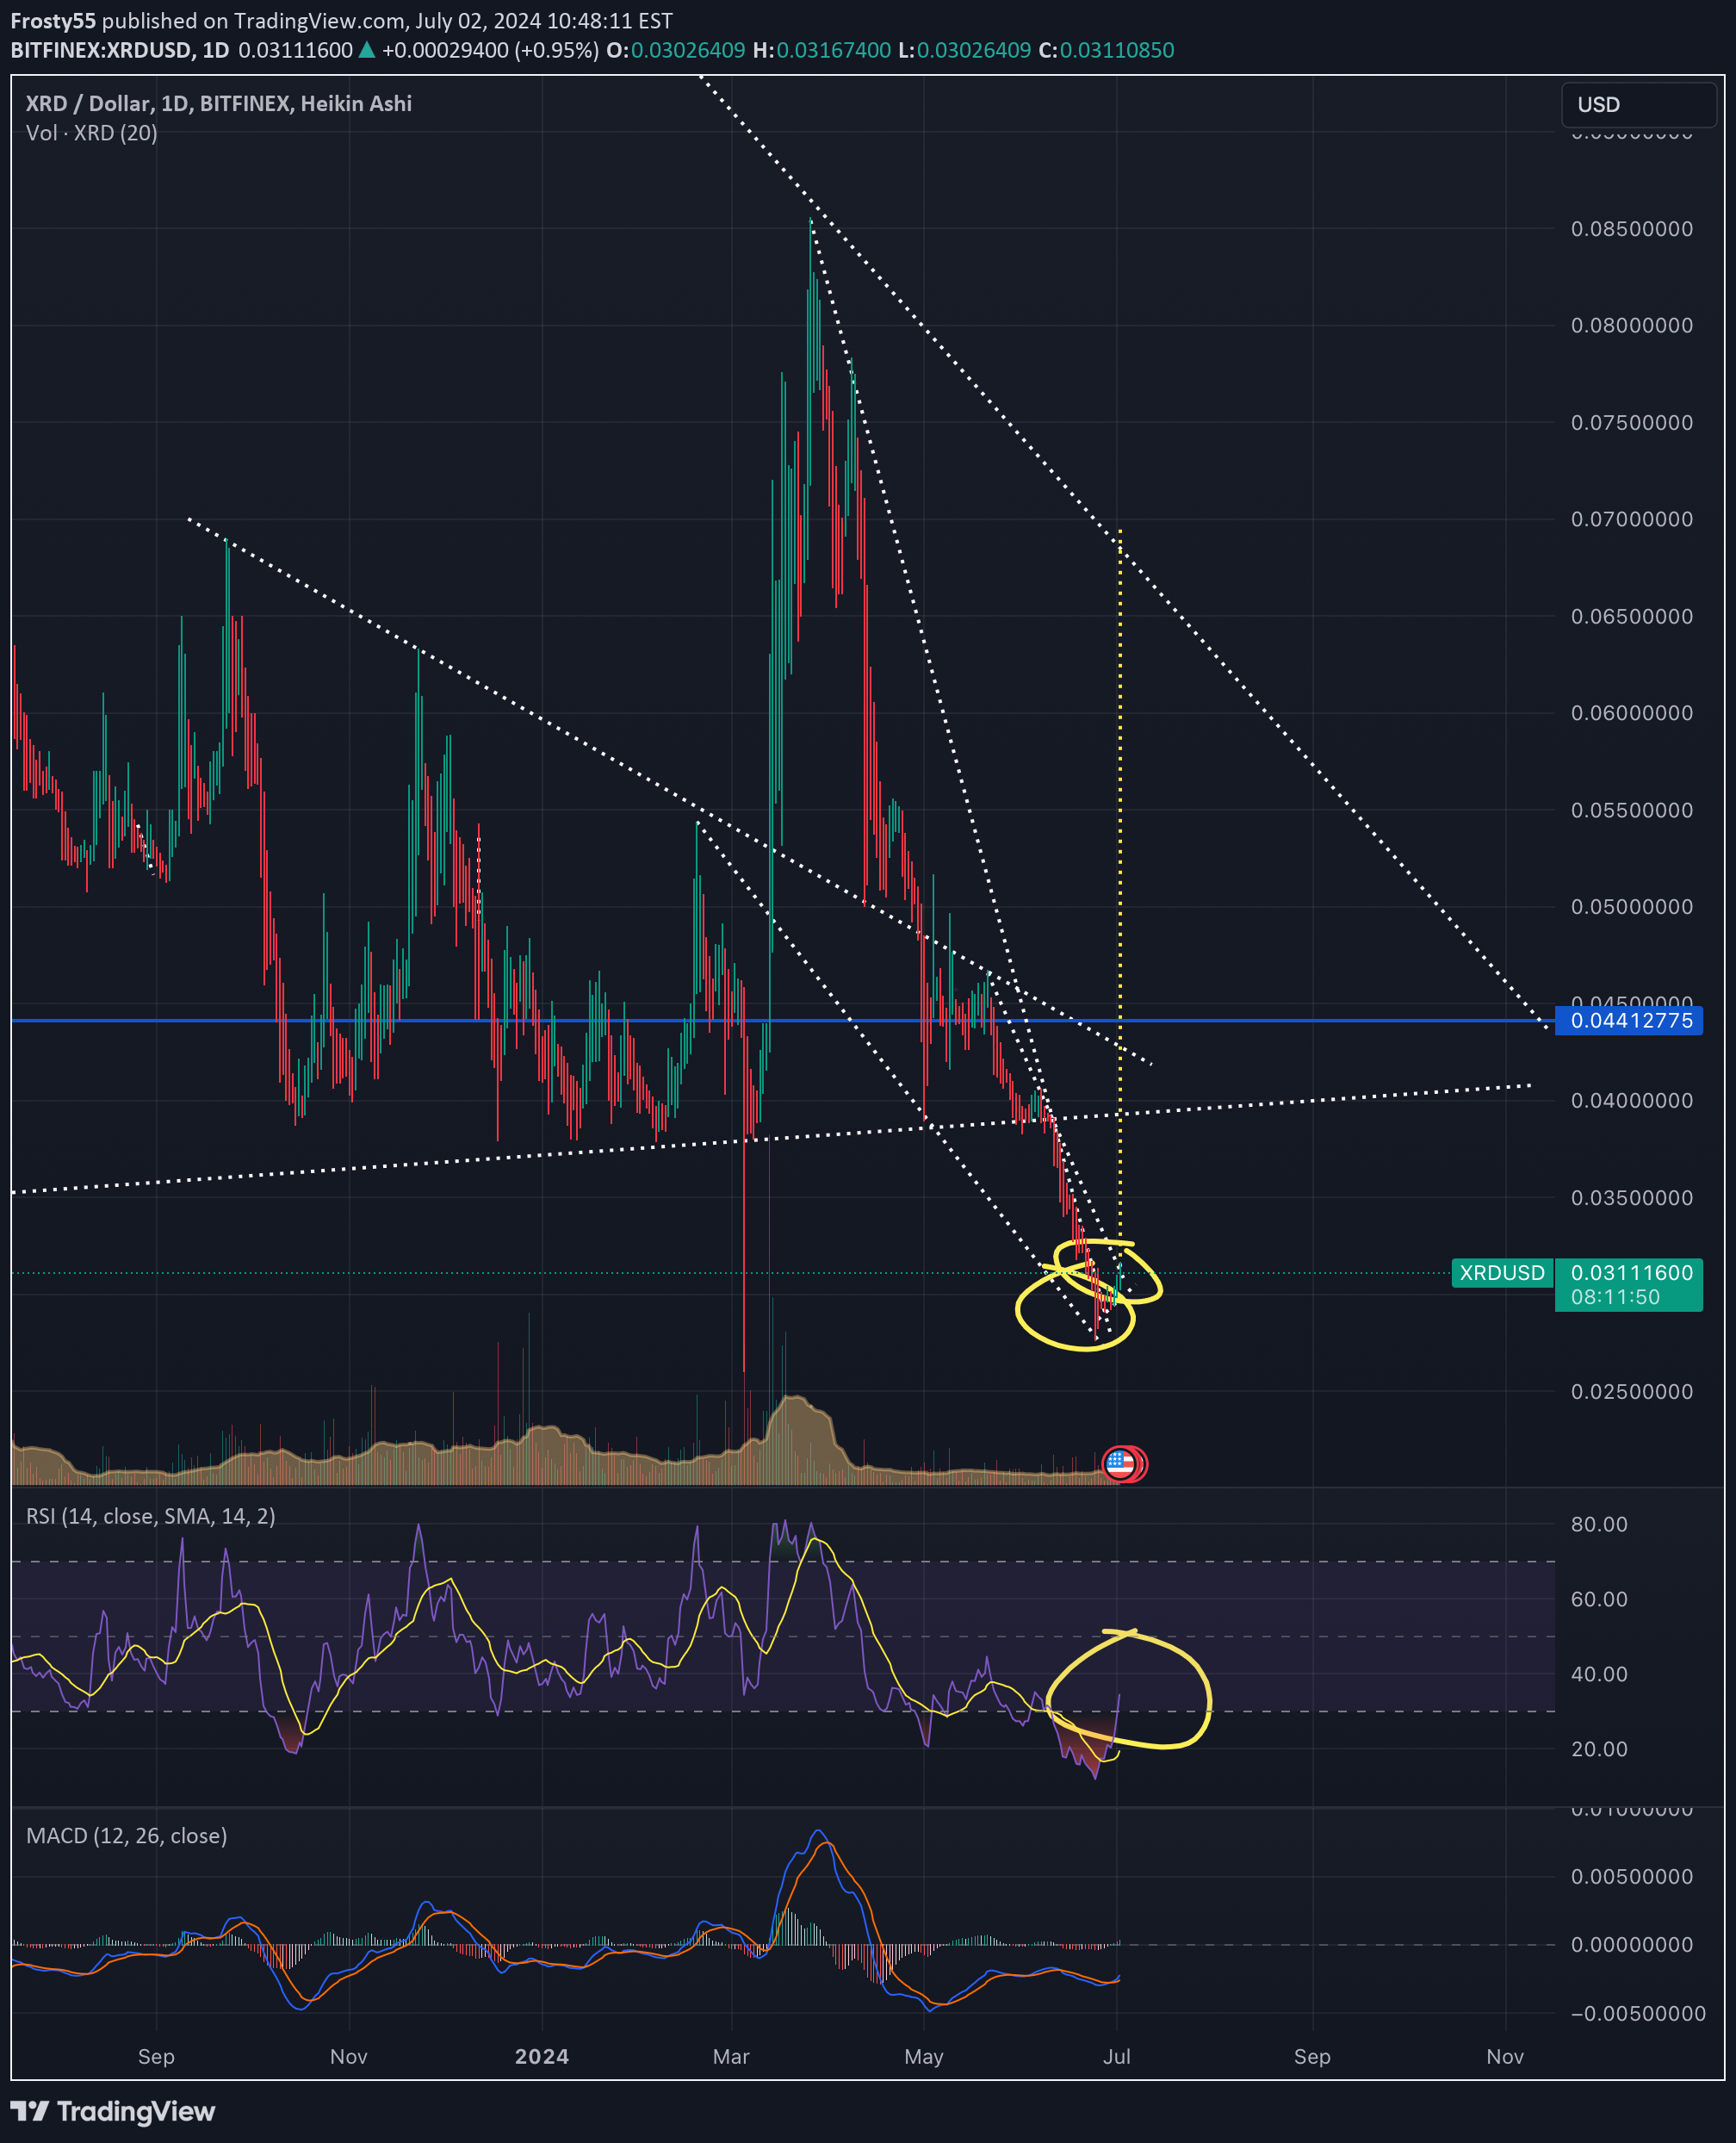
Radix bottoming
There is a hugh triangle forming for XRDUSD. There is also a big line of support. Even on the XRDBTC-pair. XRDBTC is forming a big falling wedge, which is a bullish pattern. Low on the RSI as well.. This all, together with the request from the Radix community for listing the (e)XRD-token on Binance this can be a big opportunity for Radix to go significantly higher. Radix is still great technology and has a relative small market cap..
Frosty55
Radix has formed bottom
With multiple points of support #Radix #XRDUSD seems ready to breakout higher.When we're zooming in you can see higher lows, multiple lines of support and resistanceOn the 1Hr and 4Hr timeframe you can see the price is breaking out of the (first) line of resistance, ready to move up higher1HrEven took a look at Defilama where you can see the TVL has bottomed and the TVL is increasing: defillama.com/chain/Radix Take also in mind the Radix foundation has made steps to list XRD to Binance. Interesting times for Radix if you ask me :-)What's also possible, XRDUSD is in a upside channel see the blue dotted lines:A falling wedge is forming (yellow dotted lines) on the 'Daily':PPff.. what a bloodbath for all the ALTS, so also Radix! XRD highly oversold.. Hopefully it will quick recoverAfter the high's of march this year, XRDUSD is now forming a falling wedge which is a bullish pattern:
Frosty55

Frosty55
BTC in symetrical triangle

Previous highs are supporting the BTC price. Toghether with the lower highs it's forming a symmetrical triangle
Frosty55
Filecoin strong rebound

After a couple of days FIL was in a downtrend, the yellow channel. It's broke out and how there is some resistance, the orange drawings. After FIL breaks this resistance (orange) there will probably a retest before it can go (much) higher. RSI is also lowered a lot, so there's room to go higher imo.Filecoin is busy/trying to break the resistance. I think this will be the path for the next hours/days:FIL went go down a little bit because the whole crypto market went down.. But the previous downwards channel holds support. I'm still bullish for the long term!FIL broke out to the upside as part of the whole crypto market. Now it seems forming a falling wedge (which is a bullish pattern). Much will depend of the price of BTCAfter a couple of days of sell pressure it seems FIL(USD) is prepairing to break out of the fallingwedge(-ish) formation. RSI - stuck in the middle > more room for grow MACD - ending strong sell pressureFIL breakout as analysed in my previous postUpdate. FILUSD is forming a symmetrical triangle
Disclaimer
Any content and materials included in Sahmeto's website and official communication channels are a compilation of personal opinions and analyses and are not binding. They do not constitute any recommendation for buying, selling, entering or exiting the stock market and cryptocurrency market. Also, all news and analyses included in the website and channels are merely republished information from official and unofficial domestic and foreign sources, and it is obvious that users of the said content are responsible for following up and ensuring the authenticity and accuracy of the materials. Therefore, while disclaiming responsibility, it is declared that the responsibility for any decision-making, action, and potential profit and loss in the capital market and cryptocurrency market lies with the trader.