
Feisalbaloch
@t_Feisalbaloch

What symbols does the trader recommend buying?
Purchase History
پیام های تریدر
Filter
Feisalbaloch
AVAX USDT

1. Triangle Formation Currently, AVAX is trading within a triangle pattern, which could potentially be part of a strong weekly trend correction. This pattern suggests a phase of consolidation before the price decides its next significant move. 2. Decreasing Volume on Bearish Candles The decreasing volume on bearish candles indicates that sellers are losing strength. Additionally, we are approaching the end of the triangle, which increases the likelihood of a breakout in the near future. 3. RSI Trendline Confirmation Using an RSI trendline adds further confirmation to this analysis. It provides a stronger basis for predicting potential price movement. However, for safer entries, one could consider entering a trade above the last daily high to confirm the breakout. It’s important to note that these analyses are based on probabilities, and even in the best-case scenario, there is only a 50% chance of them playing out. Therefore, risk and capital management should always remain a top priority.
Feisalbaloch
COMP USDT

This is my analysis of COMP. After breaking out of this triangle pattern, there’s a high probability of seeing a strong upward movement. However, this is conditional upon Bitcoin’s behavior – either it moves upward itself or its dominance drops. It’s important to note that our probability for this scenario is around 50%, so proper risk management is highly recommended .
Feisalbaloch
ETH USDT

With Ethereum’s current weak trend and the expected movement of Bitcoin (either up or down), we can observe a potential “Diamond Pattern” forming. This pattern often signals a significant movement in price, giving us hope for a strong move ahead. What is a Diamond Pattern? The Diamond Pattern is a rare but powerful reversal or continuation pattern that forms when price action creates a symmetrical structure resembling a diamond. It often signals market indecision before a strong breakout in either direction. In this case, the breakout direction will depend on key confirmations. However, despite Ethereum’s weak trend—whether paired with Bitcoin or Tether—a strong move remains a possibility, especially if the market aligns with the breakout signals from the diamond pattern. I’d love to hear your thoughts on this analysis.
Feisalbaloch
TON USDT

Ton usdt, on the weekly timeframe, is currently in a range (reaccumulation zone), and we are now at the bottom of this range. The second observation, which can be seen on the daily timeframe, is that we had a well-known “Three Touch Pattern” in this timeframe, and to some extent, the zone has been faked out, considering the price closed above 5.5. Additionally, on the daily timeframe, we also have a trendline, and breaking it can confirm the bullish move. I’d like to hear your opinion on this.
Feisalbaloch
INJ USDT

I’ve spotted a potential long signal on the INJ chart, forming a classic head and shoulders pattern. This is a well-known reversal pattern, indicating that the trend may change direction. Entry can be considered after the neckline is broken and a confirmation candle closes above it. For better accuracy, combine this setup with proper risk management and additional analysis, such as monitoring Bitcoin’s price movement and market sentiment. If Bitcoin aligns with the bullish trend and its dominance decreases, it could provide further momentum for INJ, potentially allowing us to set higher targets. Always remember to evaluate volume during the breakout and ensure the pattern isn’t invalidated by fakeouts. Keep your stop-loss levels tight to minimize risk, and aim for realistic profit-taking levels while letting the market show its strength.” This version offers more details on how to trade this pattern effectively and includes actionable advice for managing risk. Let me know what you think! FEISAL BALOCH
Feisalbaloch
BTCUSDT
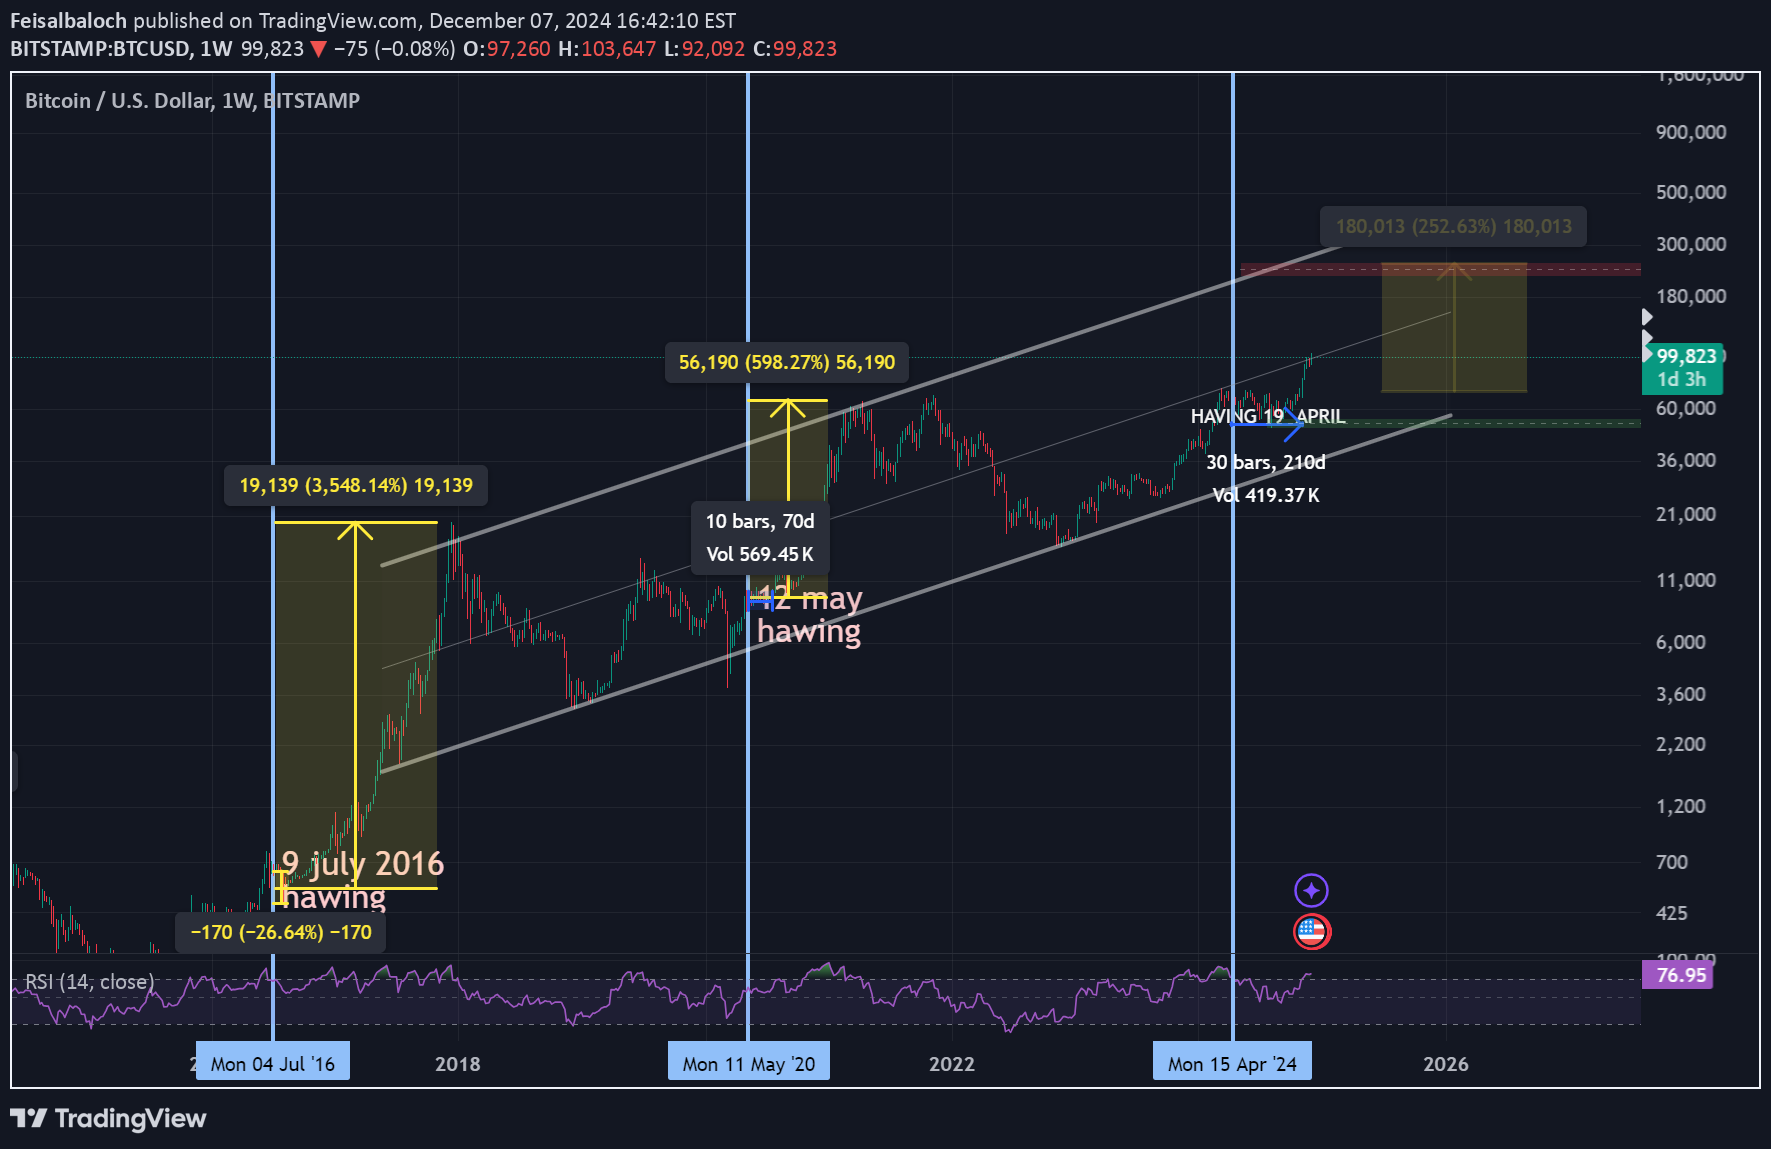
Based on Bitcoin’s previous cycles and bull run timelines, I was able to identify some price targets for Bitcoin (the dotted lines). The ultimate target I have in mind is the yellow zone. I hope you find this helpful. Thank you, Faisal Baloch
Feisalbaloch

Feisalbaloch
BTCusdt

BTC USDT 4 H NEXT MOVMENST In my mind bitcoin will be range in 68k - 60 box at list until hawing and i think if we go to upside of that box next movement will be bearish and if we just rang in 60k to 63k i think we have a small bullish movement to 80-85 k then we see the retracement of monthly bullish wave thank you
Feisalbaloch

Feisalbaloch

Disclaimer
Any content and materials included in Sahmeto's website and official communication channels are a compilation of personal opinions and analyses and are not binding. They do not constitute any recommendation for buying, selling, entering or exiting the stock market and cryptocurrency market. Also, all news and analyses included in the website and channels are merely republished information from official and unofficial domestic and foreign sources, and it is obvious that users of the said content are responsible for following up and ensuring the authenticity and accuracy of the materials. Therefore, while disclaiming responsibility, it is declared that the responsibility for any decision-making, action, and potential profit and loss in the capital market and cryptocurrency market lies with the trader.