
EdgarTigranyan
@t_EdgarTigranyan

What symbols does the trader recommend buying?
Purchase History
پیام های تریدر
Filter
Day trading Bitcoin

Hello all, Will keep it very simple and day trade BTCUSD for a month. For the first trade we will wait for the price to hit 27,500. Looking to sell at $31,800 with 15%.
Bitcoin holding critical support 23k.

Hello all and welcome to my channel. Looking at BTCUSD on the weekly timeframe we see that the price of BTC is at very critical support at 23k. For the price to get really bearish the price must break 23k, 21k, 20k, and then the Fixed Range Volume Profile point of control and the greater support which sits at 19k . Also Keep an eye on the stock market, and especially the DXY to maintain the $105 level and hopefully the Double top on daily doesn’t play out. On a Bullish side, the 200 Cm_Ultimate indicator is flashing a buying signal. Shall this 23k level hold and be a strong support, we can see a price surge. Lets see what this week unfolds. Thanks and stay tuned. Enjoy, and comment below.
Ethereum: Updated price action and where can it go.

Hello and welcome to my channel. Looking at ETHUSD on the weekly timeframe we see that the price of ETH is inside an ascending channel and currently trading above the weekly descending resistance. To confirm this bullish price action I want to see the weekly candle close above the 200 week EMA (sitting at $1380) and above the descending weekly resistance (sitting at $1420). Afterwards, we have our resistance of the ascending channel sitting at $2070 and the fib golden ratio at $2575-$2654. Although the CM ultimate is giving us a green signal on the daily timeframe, the daily RSI provides us an overbought valuation. We are also keeping an eye on BTC price action which is currently inside a descending channel and testing the resistance line of the channel which sits at a major psychological price level of 20k. Thanks for reading, and Stay tuned. Thoughts and comments are appreciated.Love to see ETH pumping but must give you all a possible pullback warning NOW.Once we break this $1670 level, $2020 will be our next target.Very quick 22% bounce from the 200 Daily EMA.Will 1765 break this time ? Lets see.Eth big move towards the upside. Obviously this break out can be the ultimate run for the 2400 target.
Ethereum: $880 soon again?

Hello all and feliz sabado. Looking at ETHUSD on the weekly timeframe we see that the price of ethereum trades below the (yellow) long ascending line of support. More importantly the price currently trades below the 200 week MA, and the daily RSI is in the oversold territory. The price is also below the 2018 all time high price of $1400. If this breakout is confirmed and the candle closes below the yellow line, then it will be a matter of not “if” but “when” we will revisit the $880 price. The $880 level is the lower low from the previous price drop and also a historical level of support since December 2020. Coincidentally this level of support is also the support of the descending symmetrical channel (orange lines) where the bottom sits at exactly $880. Hope this helps those who are thinking to buy ETH now. I strongly recommend to wait and buy around $850-$880. Learn on my mistakes. Cheers. Thanks for reading and stay tuned. Disfrútala.Watch the symmetrical triangle break soon. The price is reaching the apex. Don't have the pattern on this chart. Just draw an ascending line on this same weekly timeframe, leave on the top channel and watch it closely.
Solana: Latest updates and what to do.

Hello all and welcome. I was asked to give my opinion on SOL so lets get straight to the point. Things are looking extremely bad and I recommend selling whatever is left in the bag and forgetting about SOL. Why? Looking at coin market cap, the 24 hr trading volume is recorded to be $4,063,992,273. Secondly, Nearly $1 billion of solana is set to be unstaked today. This is very bearish (link below). And lastly, Alameda research which holds about 800 M worth of SOL, is getting ready to sell it all after the “epoch 370” event. This will only cause further drop and most likely below $5 prices for SOL. Unless you are ready to hold and not a leverage trader, it is okay to keep your positions open hoping for a recovery in the future. But make sure you transfer your Tokens from FTX to Binance at least. Personally I will not even buy the drop. Not SOL and not FTT. Hope this helps. Thanks for reading, and stay tuned.
Ethereum: Update on the 25% rally and what is next.

Hello all and happy Sunday. Looking at ETHUSD on the daily timeframe, we see that the price of Ethereum has reached a resistance at 23. 6% fib retracement level at $1651. Indeed, it was interesting to see the price to break bullish out of the symmetrical triangle, instead of seeing a bloodier drop if the bear flag pattern was to play out. It is possible that we see another pump towards the next resistance level at $1700. This is where the 200 day MA and the long descending line of resistance are. After we saw a 25% pump towards the upside, I believe that this relief rally is almost over if not already over. Hence, the levels to watch for retracement are the fib 50% at $1490 and the 65% fib level at $1400. Lets keep an eye on the top descending channel line (orange color) which currently flipped into support, and also the 20 day MA which is also at $1400. If we break below the $1400 level, I still believe that we can see 3 digit numbers yet again. Our previous ethereum char analysis and trade set up can be found below. Thanks for reading, and stay tuned. Enjoy .Happy Saturday all. Erase all my lines or open your chart and put on the daily terminal. Now look closely and you will see a perfect cup and handle pattern. Now draw a line from the Sep 12th candle to the oct 26 candle. We get a very important support sitting at $1620. we need to hold above this level on the daily for this pattern to play out. The measured target for this pattern is approximately at 2k. Keep an eye on this and be well. Cheers.Adjust the orange descending channel and keep an aye on that pattern. The price hit the bottom of the channel at $1076 and bounce 25%. Top of the channel sits at $1576 which is a potential 50% (measured from $1076. Daily RSI is oversold and looks bullish.
BItcoin: Importnat levels to watch before this date!
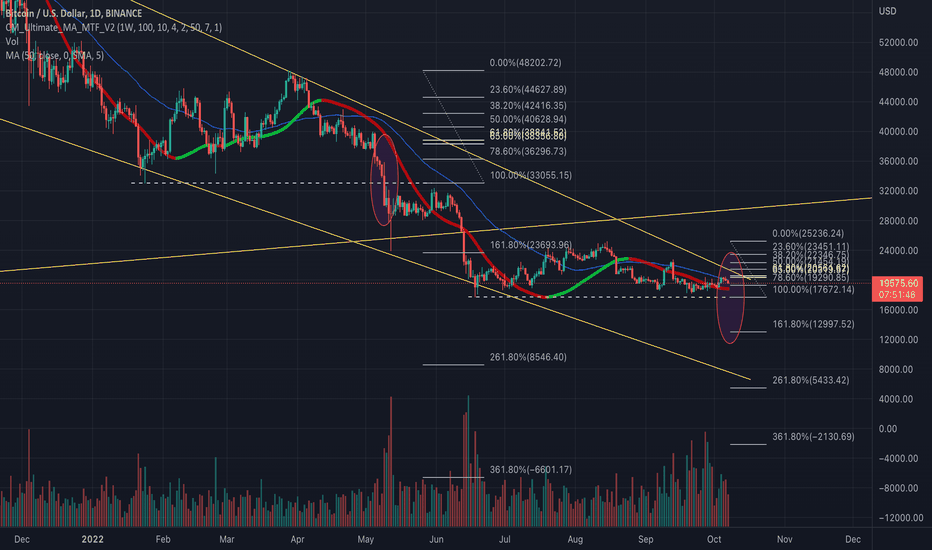
Hello all and thanks for your continuous support. Looking at BTCUSD on the daily timeframe, we see that BTC is still trading inside this big falling wedge channel , but more importantly, the price is now coming very close to the resistance of this channel, which I see as the apex of a descending triangle pattern. If we take a look at may 9th 2022 price action, we can find similarities between then and what the price is doing now. As such, I believe that within the next 10 days, BTC will have its major move either towards the upside or downside. $18,600 level has already provided support for numerous times and this is an important support level to keep an eye on. If the price breaks below this level, my next bearish target will be the next psychological level, $13,000. This corresponds with the fib 161.80%. extrapolate a measured move for this bear flag pattern, we get a bearish target at around $811. This bearish target also corresponds with the fibonacci 161.8% level. And if this level also doesn’t hold then we can go to the bottom of the falling wedge pattern which sits at around $7000. It is interesting to watch if BTC can break above the $20,500 level and if yes, we will go to the 50% fibonacci level which is at $21454. One way or another bitcoin gan go approximately 50% up or down within the next 10 days. I think before October 20th we will see the major move we all been waiting for. Thanks for reading, and stay tuned. Enjoy.4 or 8 hr chart has formed a symmetrical triangle. the measured bullish move for this pattern gives us a price target at 23k per BTC. Update this on your charts.Price found resistance at the Fib golden pocket and the RSI is in the overbought territory.
Ethereum: Another 40% drop and low $800's? Important pattern.

Hello all and thanks for your continuous support. Looking at ETHUSD on the daily timeframe, we see that ETH is still trading inside a descending channel , but more importantly, the price is now trapped inside a symmetrical pattern which I see as part of a bear flag pattern. If we extrapolate a measured move for this bear flag pattern, we get a bearish target at around $811. This bearish target also corresponds with the fibonacci 161.8% level. However, before we see this much more downside, which will be another 40% drop from the current price, there are two important resistance levels to keep an eye on. Our first (technical) resistance sits at around $1100, which is the bottom of the descending channel and where the long (yellow) ascending line is. Our second (fundamental) resistance is the $970-$870 levels. It is interesting to watch if ETH can break above the $1350 level and if yes we will go to the fibonacci golden pocket which is at $1419-$1438. Thanks for reading, and stay tuned. Enjoy.Eth broke bullish out of this symmetrical triangle. measured target is around $1500.
Polkadot: 22% drop or $7 retest ?

Hello all and thanks for your continuous support. As the entire market, so does polkadot headed south today. Currently trading inside a falling wedge pattern, the chances for breaking bullish out of this pattern are very little. As such, my bearish price target for this pattern formation is $4.70. This is our 161.8% fibonacci retracement level. The $4.7 is the lowest horizontal support level since December 2020. Keep an eye on the descending line of support of this falling wedge pattern sitting at $6. If we loose this level we are going to $4.7. This will be another 22% drop. If the price successfully breaks above the fib golden pocket we have a chance of retesting the $7. Thanks for reading, and stay tuned. Enjoy.
Etherium: 12 hours before the MERGE!!!

Hello all and thanks for your continuous support. Looking at ETHUSD on the daily timeframe, we see the price of ETH has reached the apex of the symmetrical triangle. As such if the price breaks towards the upside, I expect that we will see the price going up at least 65%, which is the top of this pattern and the $3000 level. We can expect some resistance and a pull back at the fib golden pocket level. We should keep an eye on the ascending line of support, and the $1500 Level. In the event the price breaks below $1500, we will head towards lower prices, $1400 then $1000. Next we must hold the long (yellow) ascending line of support or else we will see three digit prices for ETH. Definitely interesting time to be trading the market. Thanks for reading, and stay tuned. Enjoy.16 minutes before the US core inflation rate. Keep an eye on the $1330 / fib golden pocket level.And very bad news. we broke bearish out of the symmetrical triangle. This pattern's measured move suggests that we are going to $1000-$880If we lose this $1270 level, we shall go to $500. Technically speaking.This sideways move means we are about to see a big move either up or down. But it is about to happen.
Disclaimer
Any content and materials included in Sahmeto's website and official communication channels are a compilation of personal opinions and analyses and are not binding. They do not constitute any recommendation for buying, selling, entering or exiting the stock market and cryptocurrency market. Also, all news and analyses included in the website and channels are merely republished information from official and unofficial domestic and foreign sources, and it is obvious that users of the said content are responsible for following up and ensuring the authenticity and accuracy of the materials. Therefore, while disclaiming responsibility, it is declared that the responsibility for any decision-making, action, and potential profit and loss in the capital market and cryptocurrency market lies with the trader.