Delzeyne
@t_Delzeyne

What symbols does the trader recommend buying?
Purchase History
پیام های تریدر
Filter
Signal Type
Delzeyne
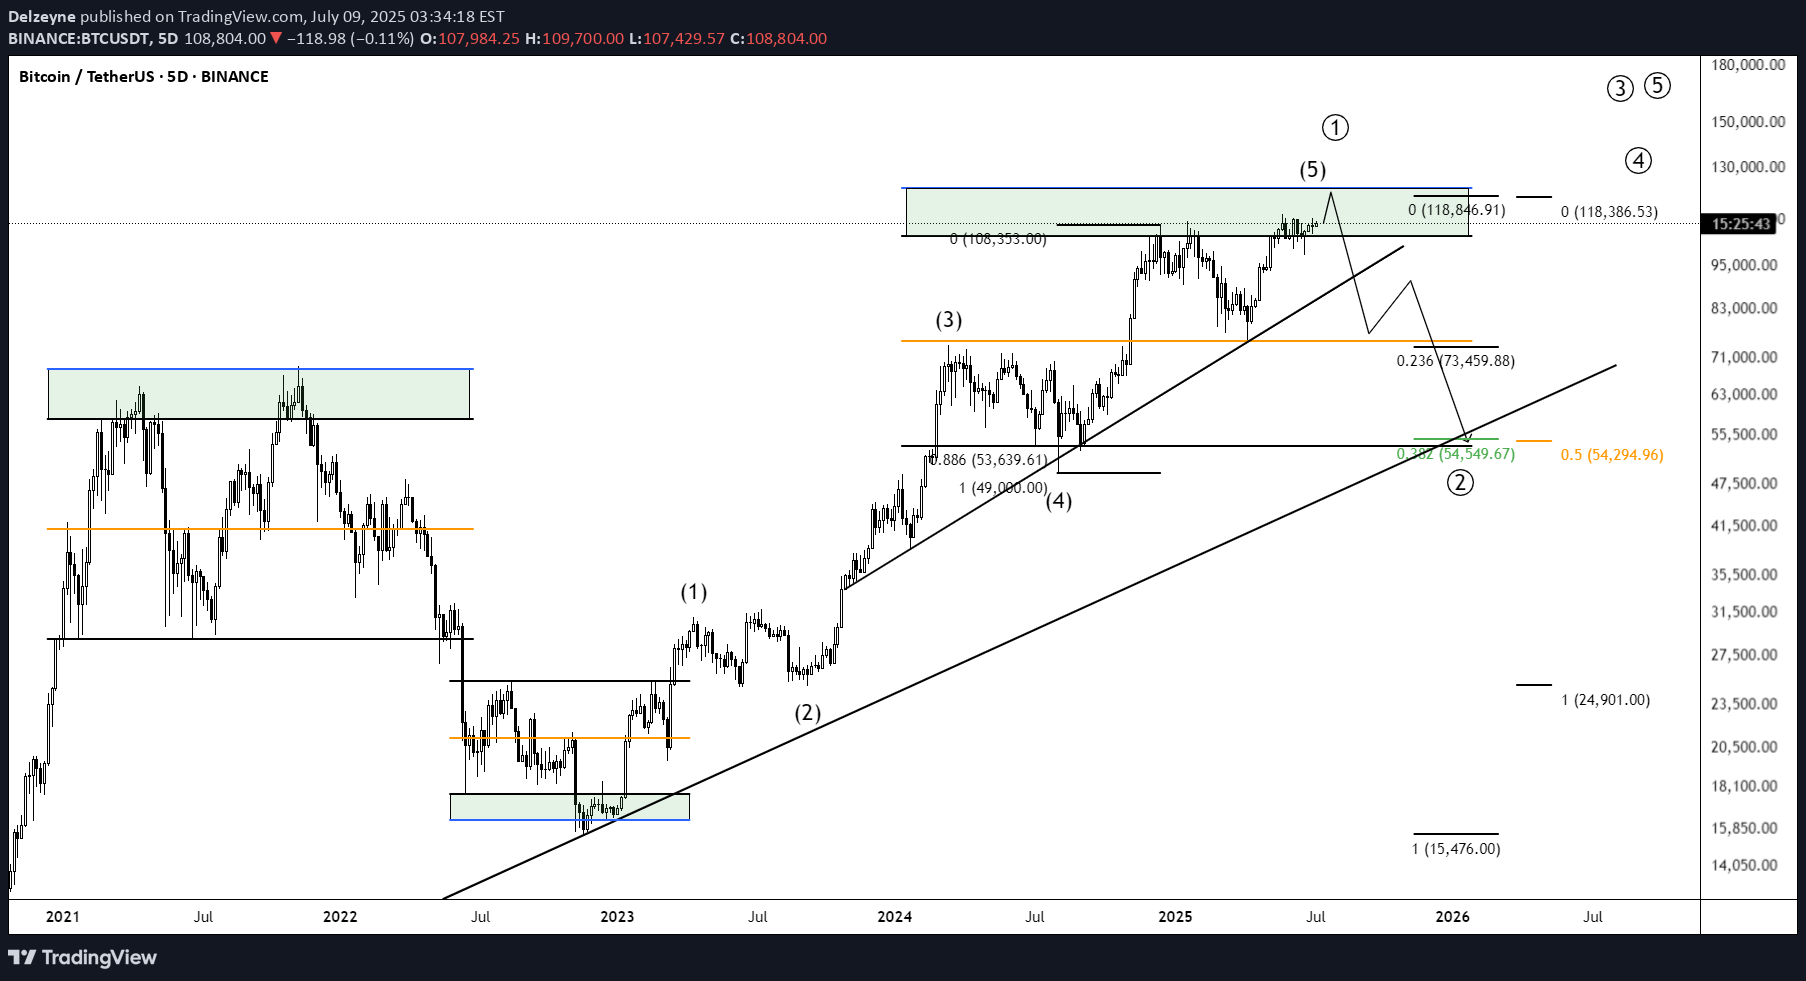
Bitcoin made an yearly high of 20% after 6 months in on the yearly candle This does not make me feel great about the rest of the year a clear sell signal would be an higher timeframe close under 100k after an upthrust to new ath around 110k - 120k around 50k-54k for me is an good buy level to build an longterm position: 0.382 fib retracement for an primary 1-2 wave 0.500 fib retracement from the 25k low 0.886 fib retracement from 49k low 50% pullback from current high to projected low where will bitcoin go ? i don't know, but i do know where i want to buy and when i want to sellalternative count, the top could be already in for this year at +- 120kcould have one more push en wick trough 120k supply if 0.50 fib holds at 113800 usd
Delzeyne
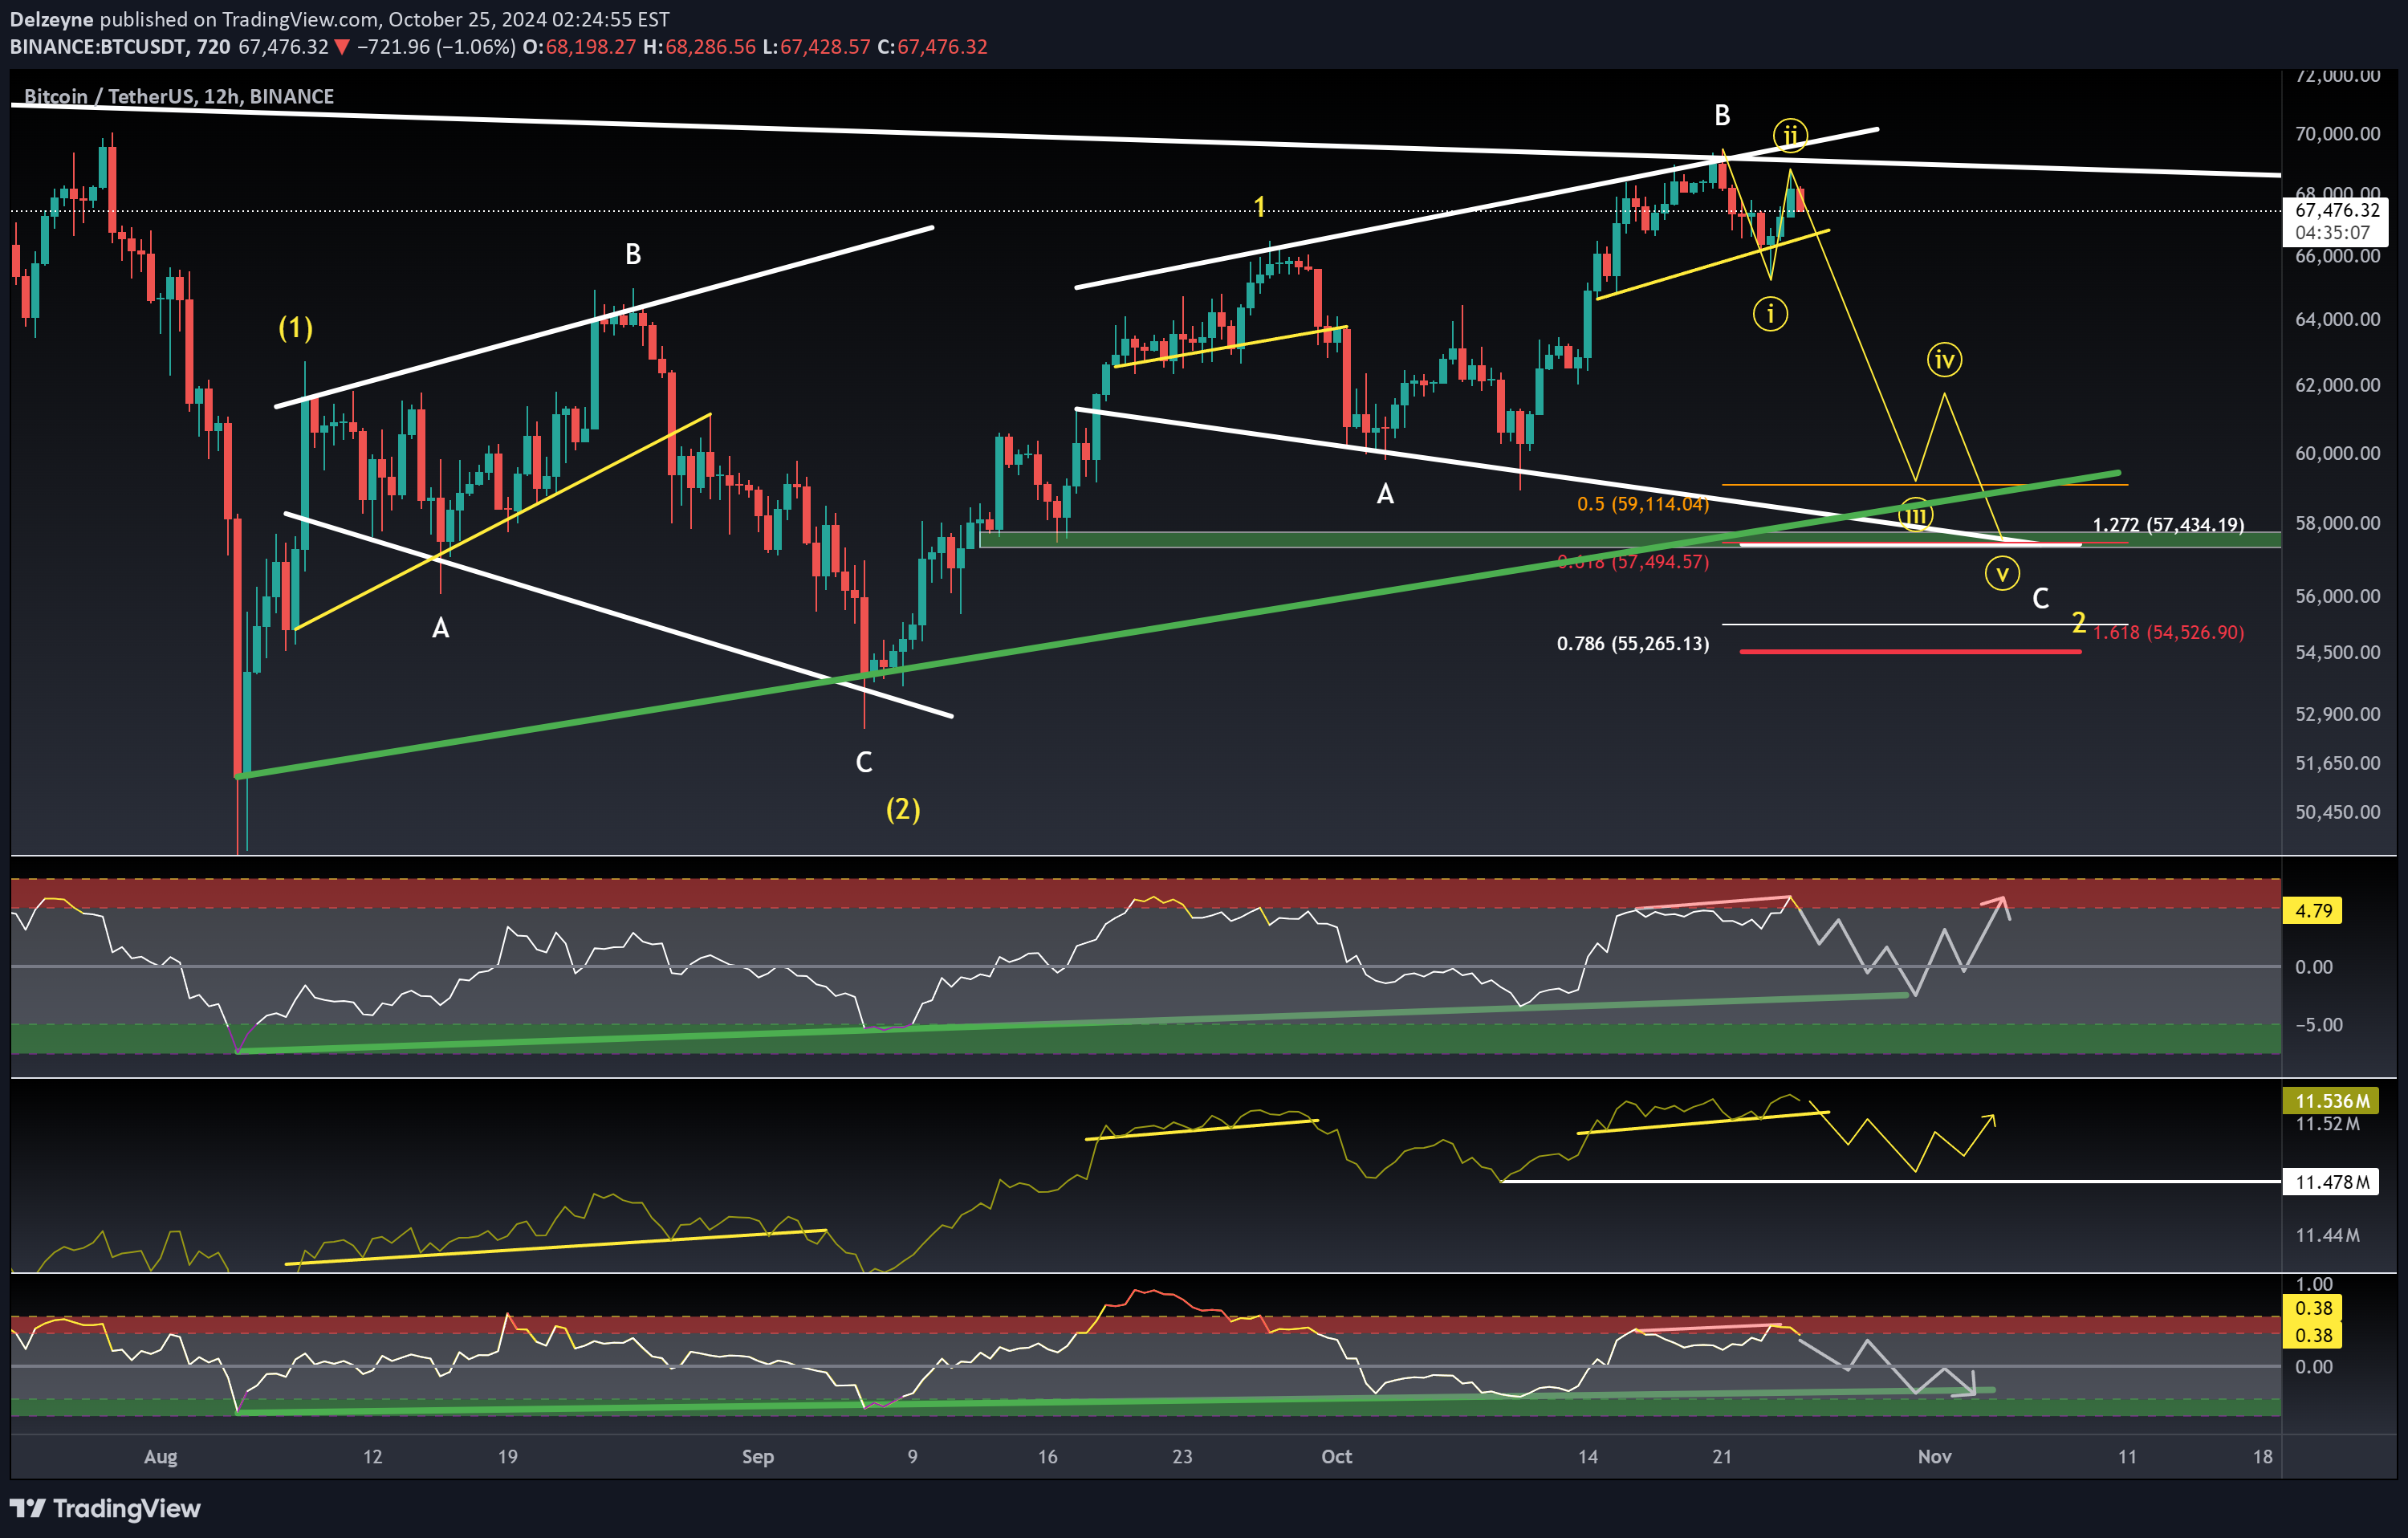
Introduction Bitcoin ended an impulsive wave last week, into mid term resistance piercing trough it and testing it as support. Inflows are increasing with these higher prices , giving liquidity to the market. If bitcoins manages to break last local low, the probability increases of trapping early longs in a false breakout to new all time highs Analyzing the 12h chart Accumulation / Distribution indicator showing an head and shoulders pattern and hidden bearish divergence with current priceaction The rate of change of the ATR and Accumulation/Distribution indicator showing overbought signals at high valuations, if these indicators can cool of on sideways priceaction bitcoin can be worth a buy again, otherwise priceation will follow these indicators to the downside Possible elliot wave count indicating a deep retracement as previous 1-2 count Riskmanagement Price should not go above the beginning wave 1 = Stoploss If price goes under the end of wave 1 = stoploss at wave 2 Targets 50% / 61,8% / 78,6% Fib retracements Green diagonal support Green rectangle boxThe high was teken yesterday, invalidating an bigger expanded flat Idea now updated for an triple 1-2 and expanded flat in last 1-2 the rate of change of the atr still needs some cooling off back to green support Several bearish divergence now building up another test of resistance into support could be needed for fuel to the upside
Delzeyne
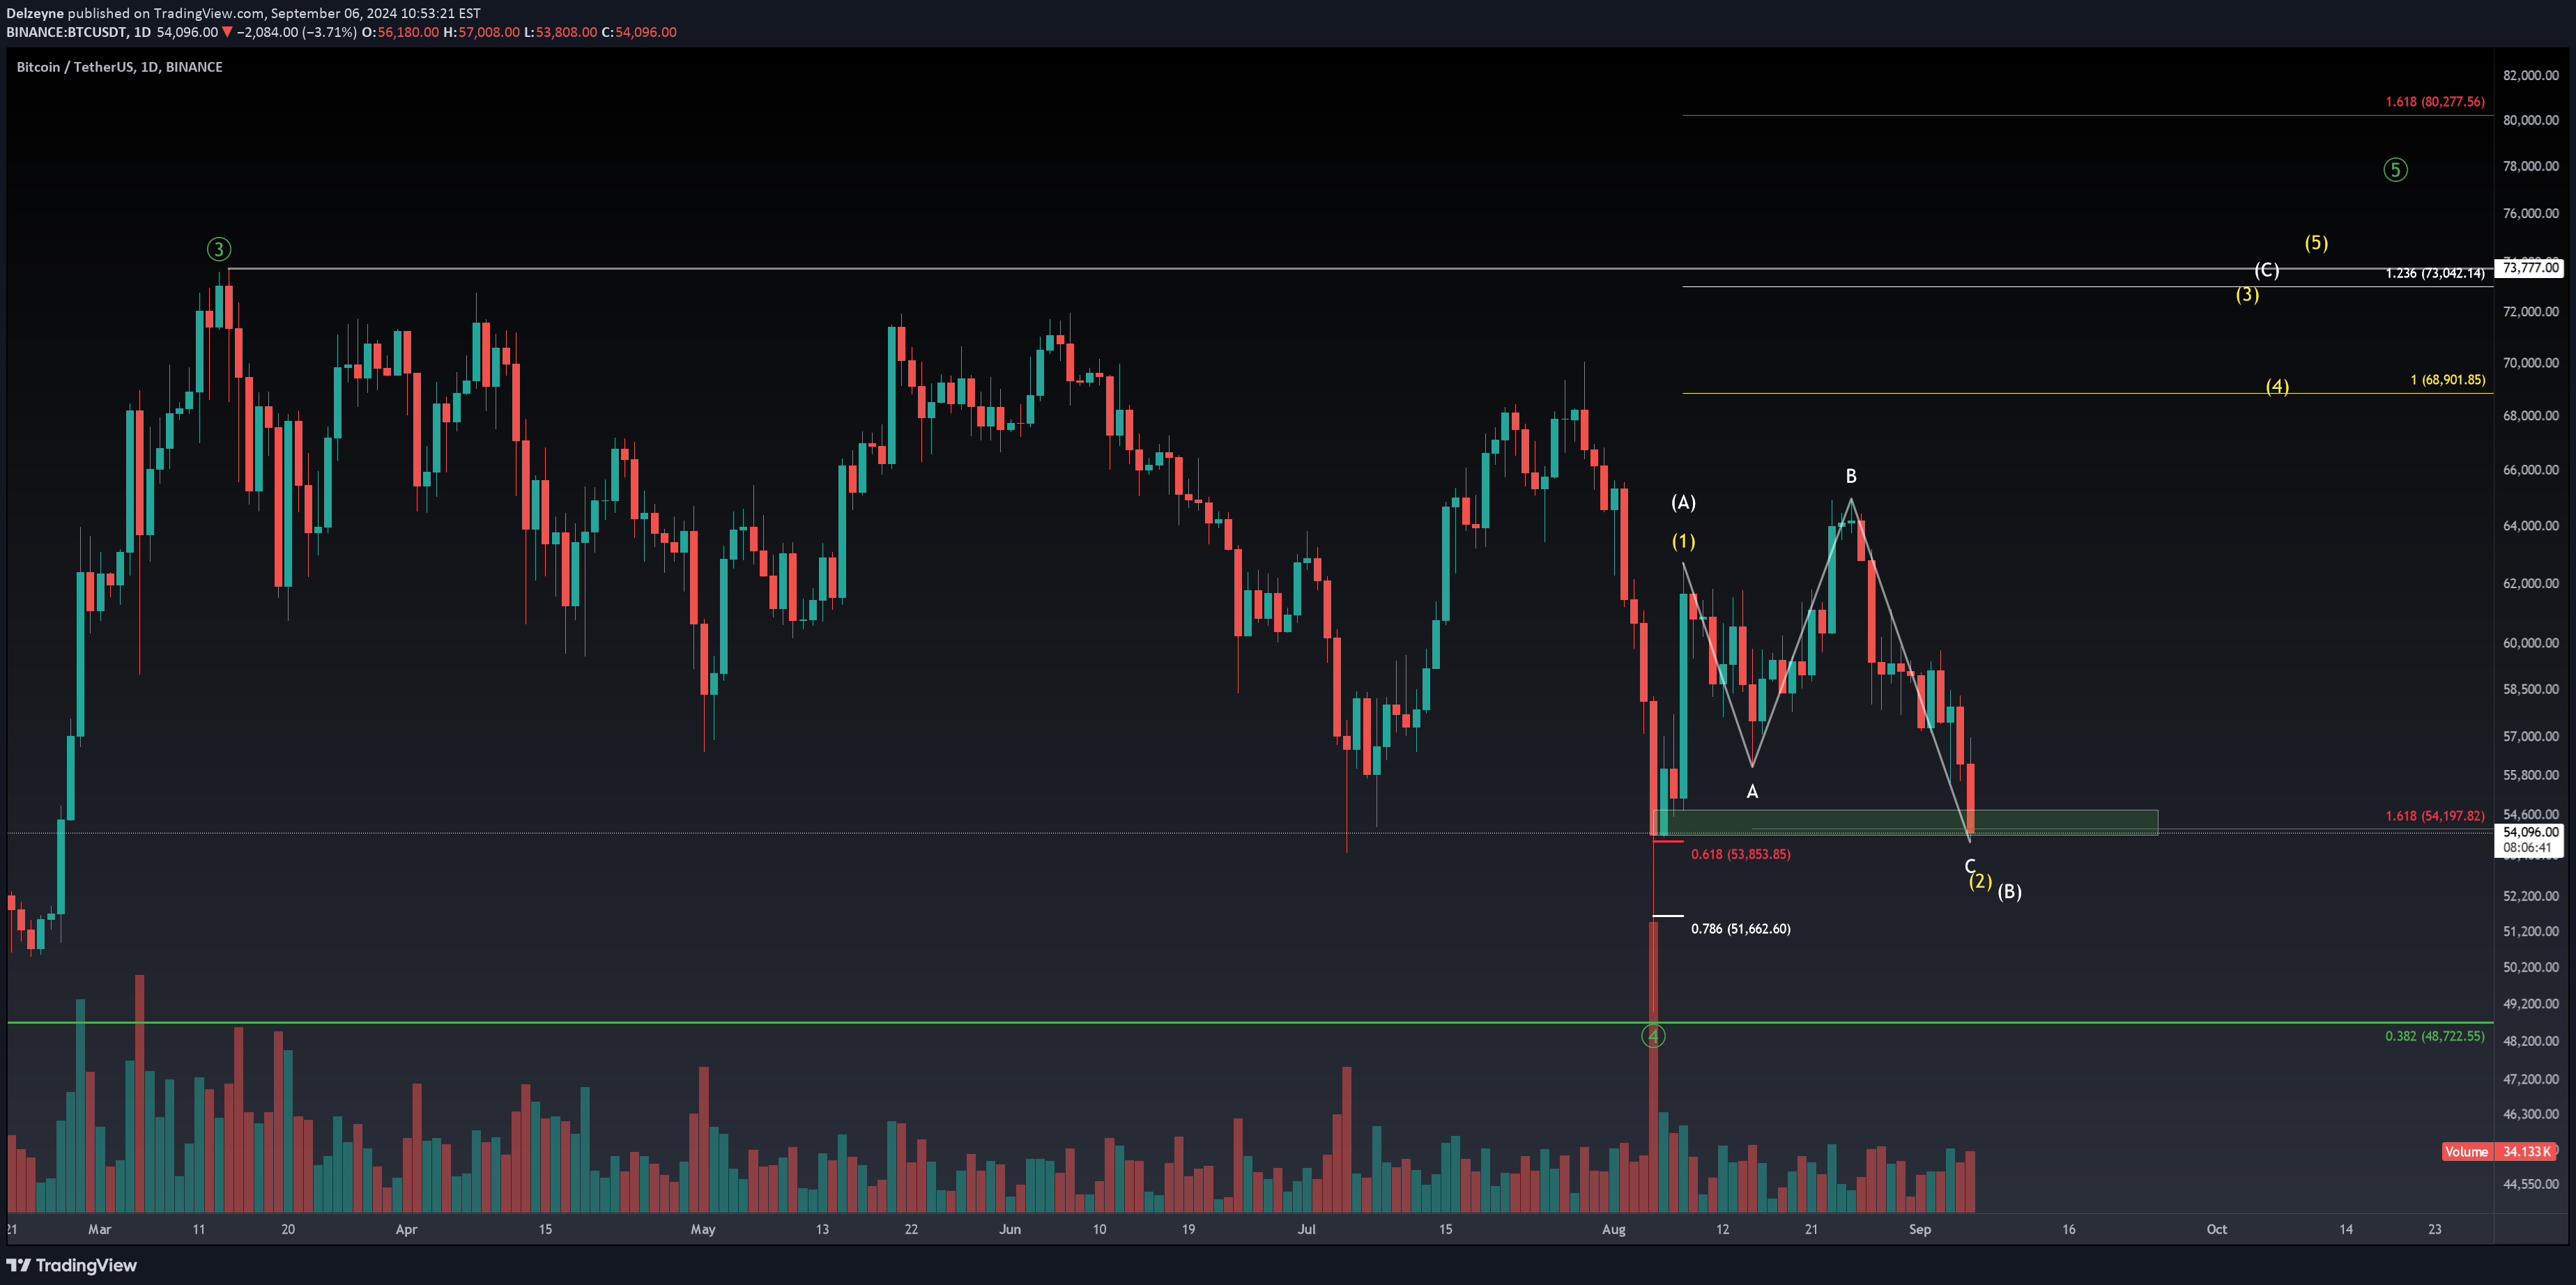
If price can hold the green support/ 0.618 Fib retracement / 1.618 Fib extensionthere is a chance for an next impulse in either wave C (wave 4 not complete)or an wave 3 (wave 4 complete)if the next impulse reaches the 1.236 fib extension the highs will be in reach a large candle or short squeeze above the highs will indicate it will be an wave 3 intermediate and wave 5 primary has already startedfor the long term count wave 5 could be extended like in the 2017 bullrunlook for my older post for the extended wave 5 possibility for more details
Delzeyne
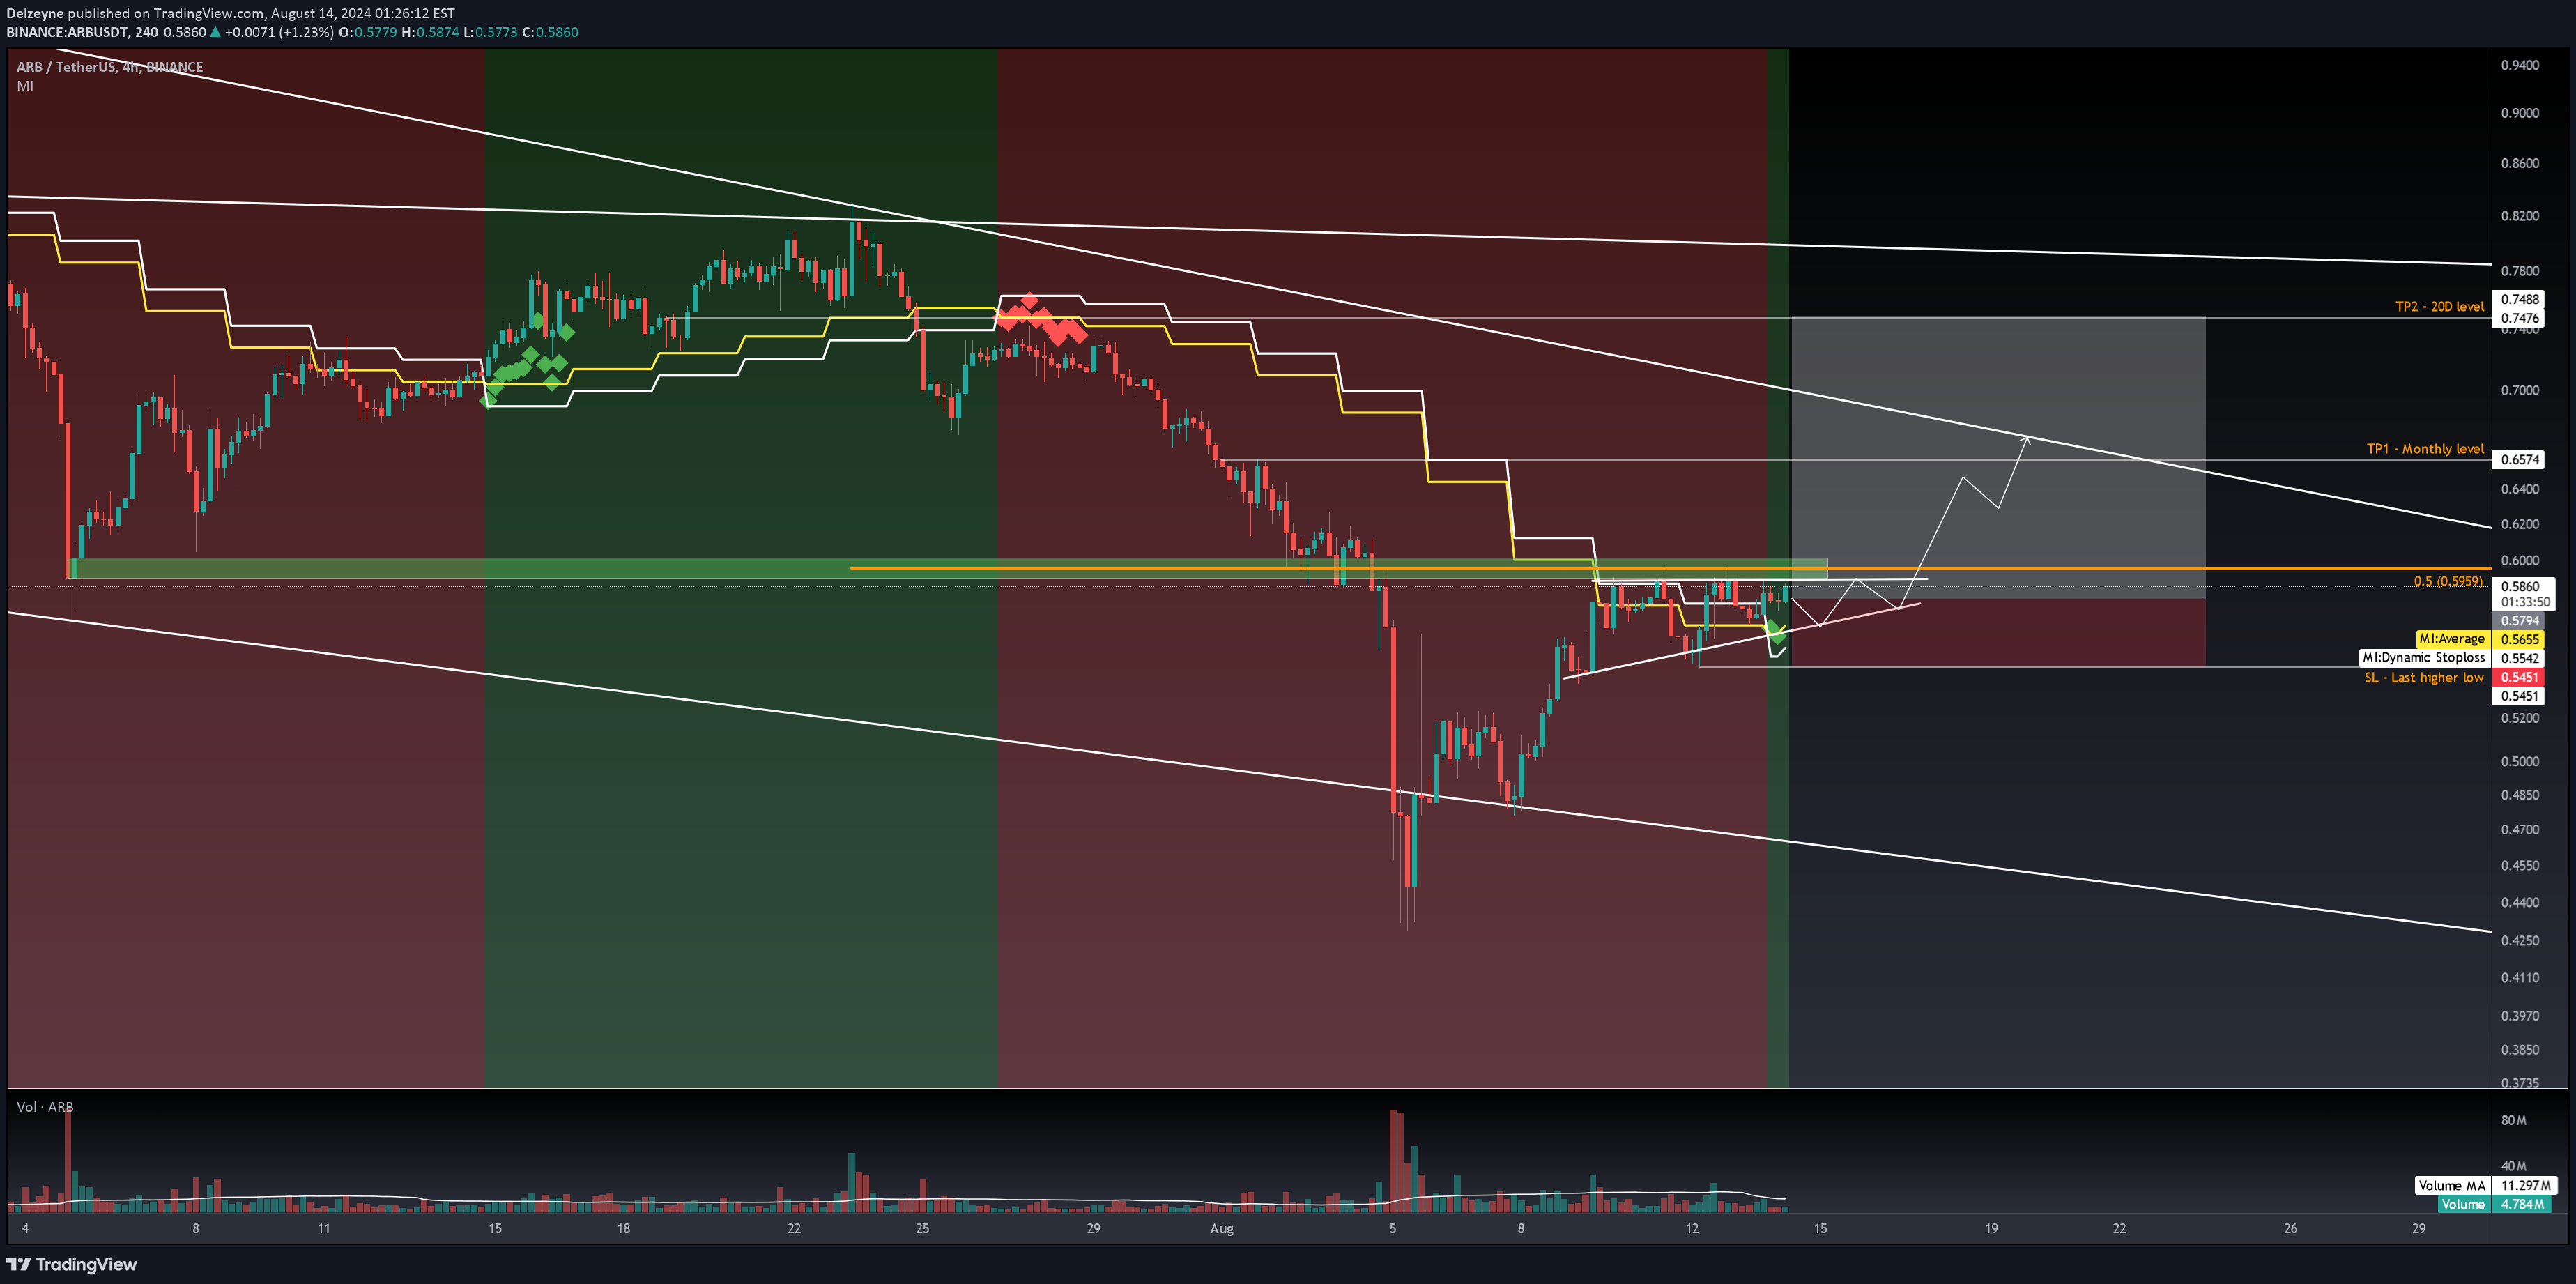
Current price actionSince august 5 arbitrum made an new all time low Series of higher lows and higher high since that bottomConsolidating under 0.5 Fib retracement wich currently act as resistanceMomentum indicatorPersonal indicator wich gives buy or sell signal based on 2 day timeframe momentum The average price act as support in the direction of the giving signalDynamic stoploss acts as an trailing stoploss wich follow the average priceBuy signal confirmed this morningTradeEntry Market price(0.5820), Average price (0.5651) or wick trough dynamic stoploss (0.5539)Break above the 0.5 Fib retracement (0.5959)RiskLast higher low (0.5451)Take profitMonthly level (0.6574) and 20D level (0.7476)Overview 2D chart and signals this strategy profibality depends on the duration of the trend in one direction False signals and small bounces is the cost of trading in this strategy
Delzeyne
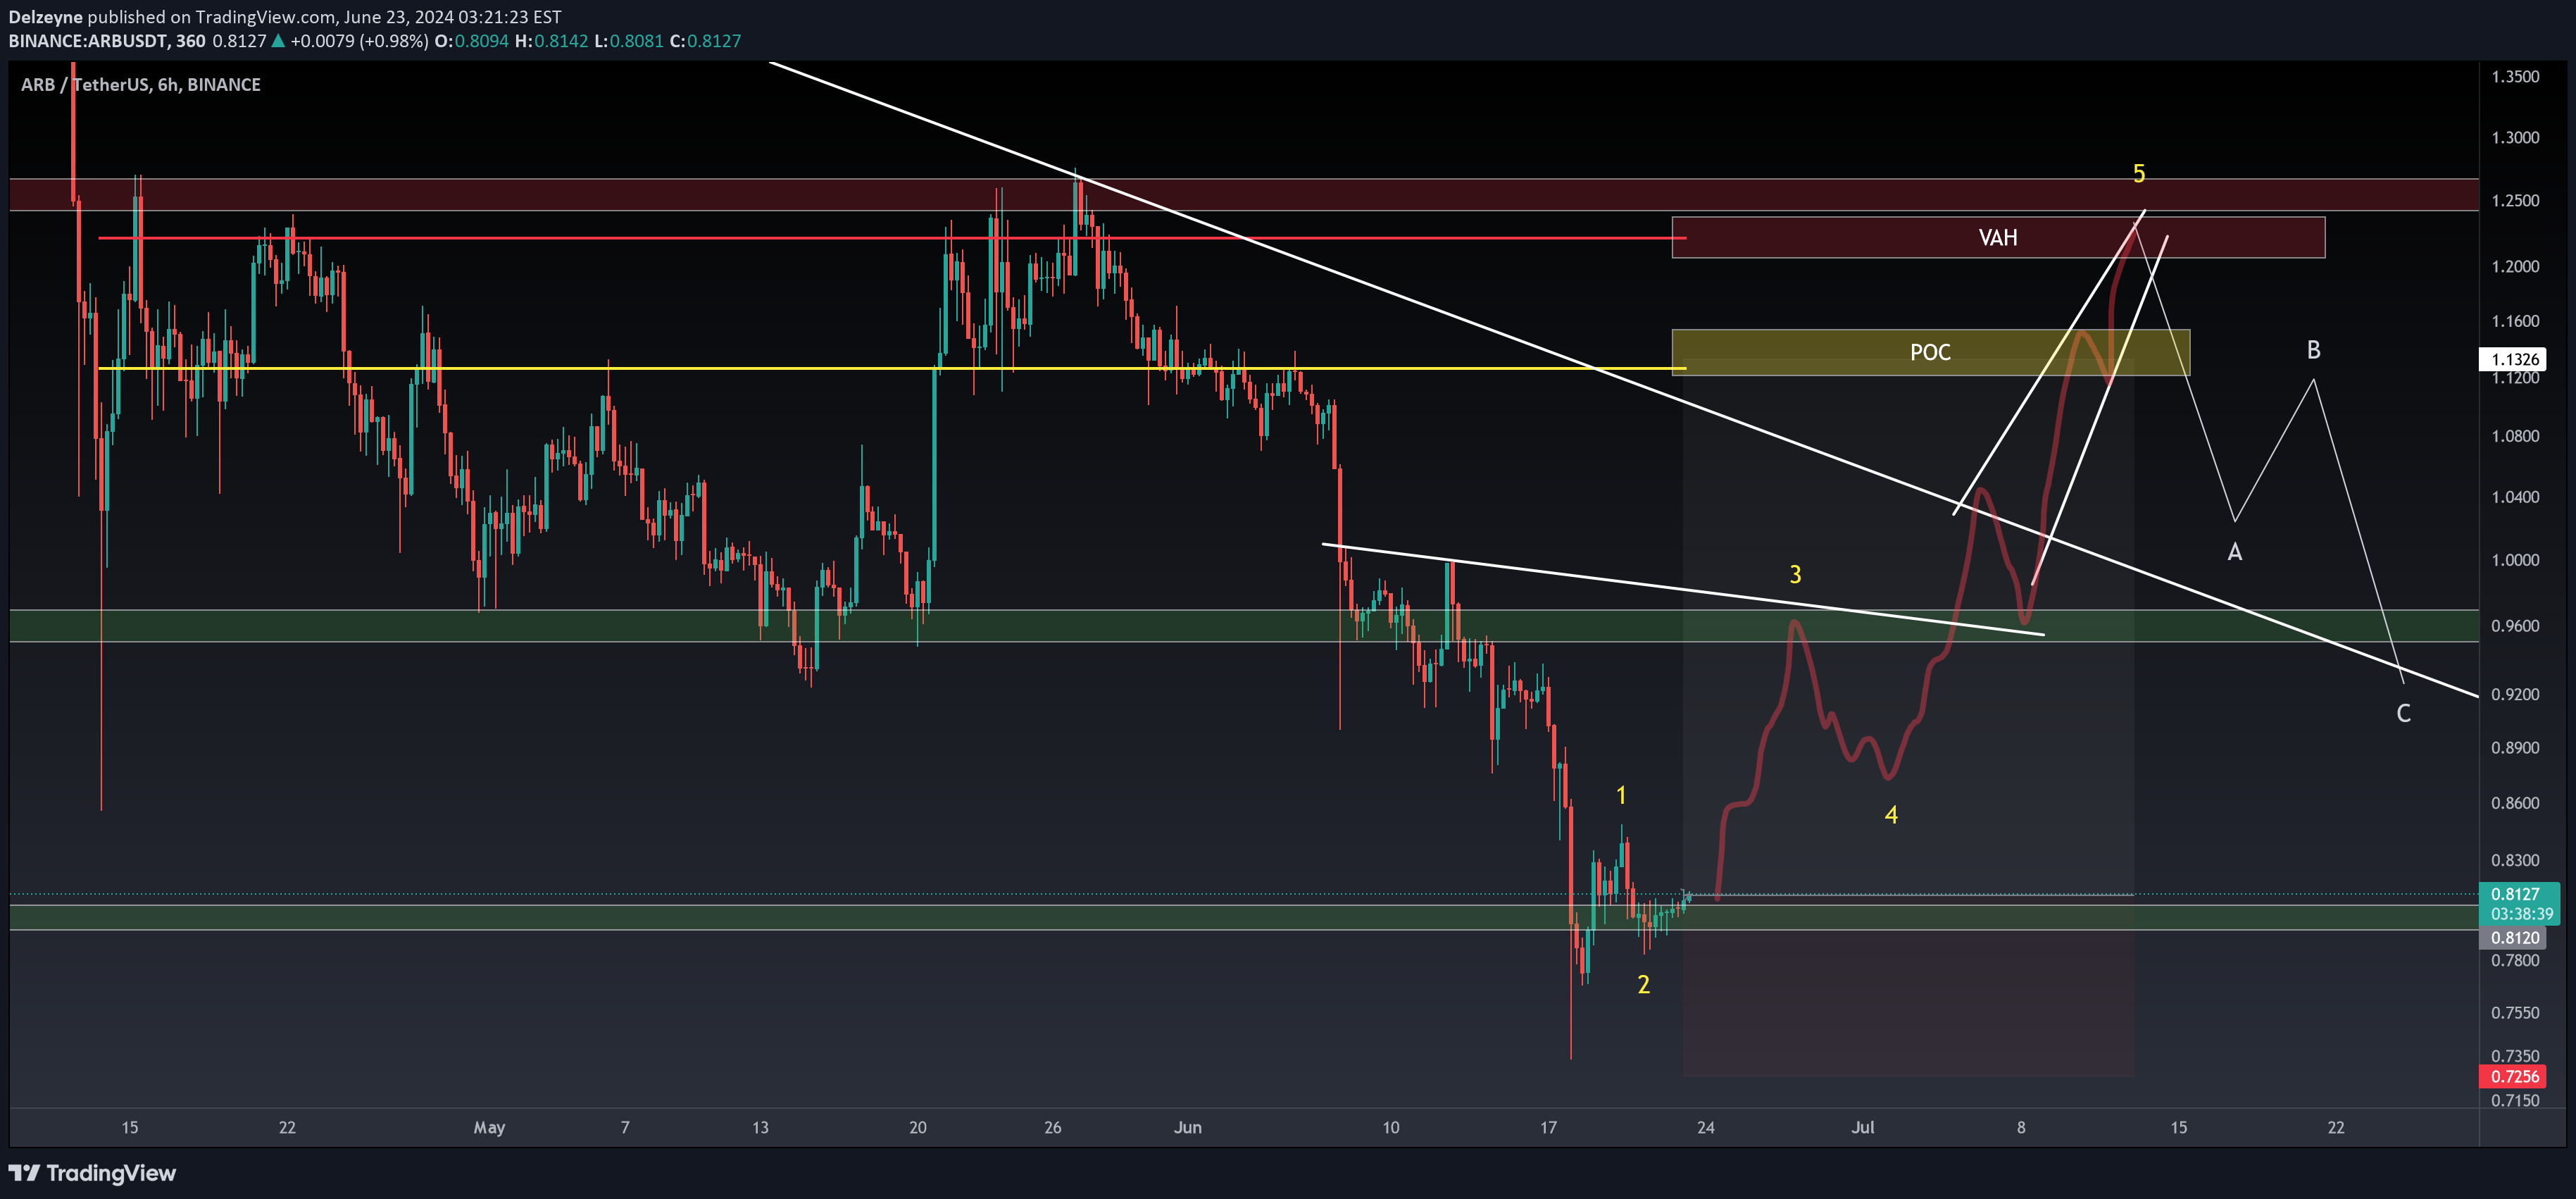
2Day Timeframe + elliot wave count + support and resistances 12h Timeframe + support and resistances Suspecting the correction is finished and the low is in Every pullback is an buy opportunity until we break the last high around 2,40 dollar or make an complete 5 wave move to complete wave 3 primary On the 6h chart looking to enter back in previous rang in a 5 wave move target is point of control around 1,13 dollar or a possible fake out to the value area high around 1,21 dollar Stop loss beneath the low in the elliot wave count, otherwise the downtrend continues in wave 5 of wave C on the 2Day chartComment: Bouncing off the 0.618 Fib retracement and 0.618 Fib extension target for wave C Market structure holding the higher low, wave 3 should begin nextComment: bounced another time from the 2h green support from previous chart alternative scenario for the 5 wave move up
Delzeyne
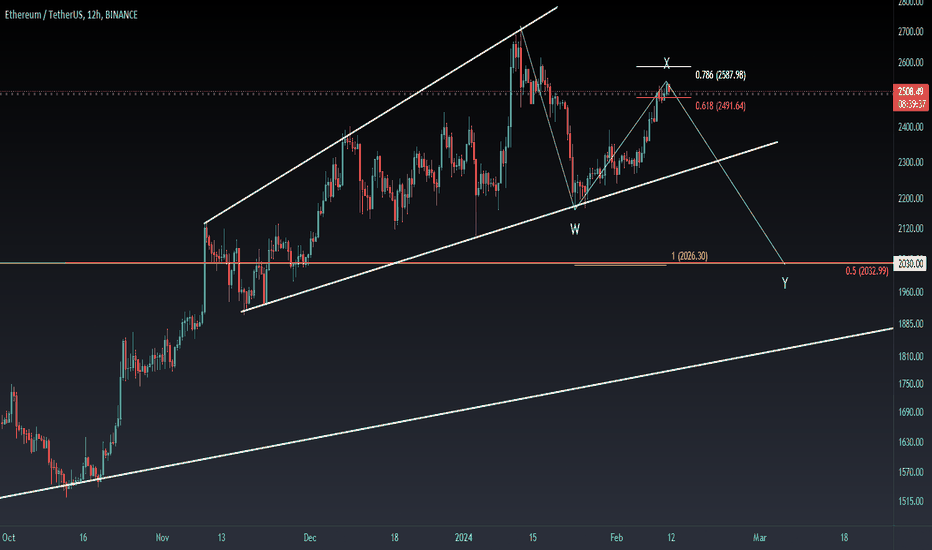
Looking for an 2nd leg down in Y If X is finished, the target is around 2030 dollar in confluence with the 1.0 Fib extension of W and 0.5 Fib retracement of the move up in november This would also count als a bullish retest of the august 2022 high
Delzeyne
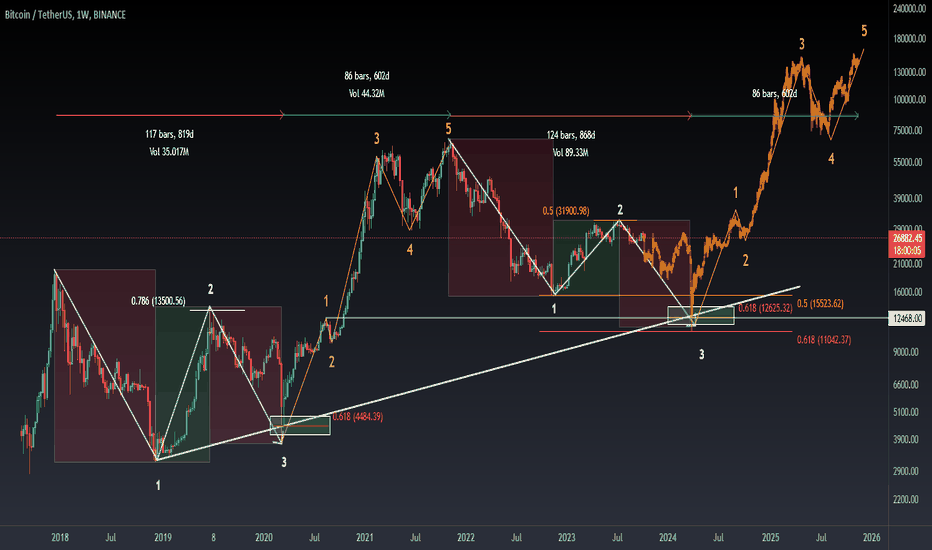
BTC: Fractal Bearmarket - 3 Down, 5 Up Looking at previous halving cycle Bitcoin had an 819 day bearmarket before an clear complete elliot wave count to the upside Comparing this to current cycle, i believe it wil take some months more to complete the downcorrection And have an similar duration to the upside around 600 days Previous cycle we went back to the 0.786 Fib retracement comparing now only the 0.5 Fib retracement This does make the possibilty to take the low, higher compared to the higher low previous cycle If you take the fib extension of the first move down of previous cycle, bitcoin went back to the 0.618 Fib extension In this cycle we could also go back to the 0.618 Fib extension, wich would bring bitcoin to 12k and take the low, afther that a jump on steroids to the upside for the impulsive move If bitcoin rhymes with previous cycle, this is an possibility to take in account
Delzeyne
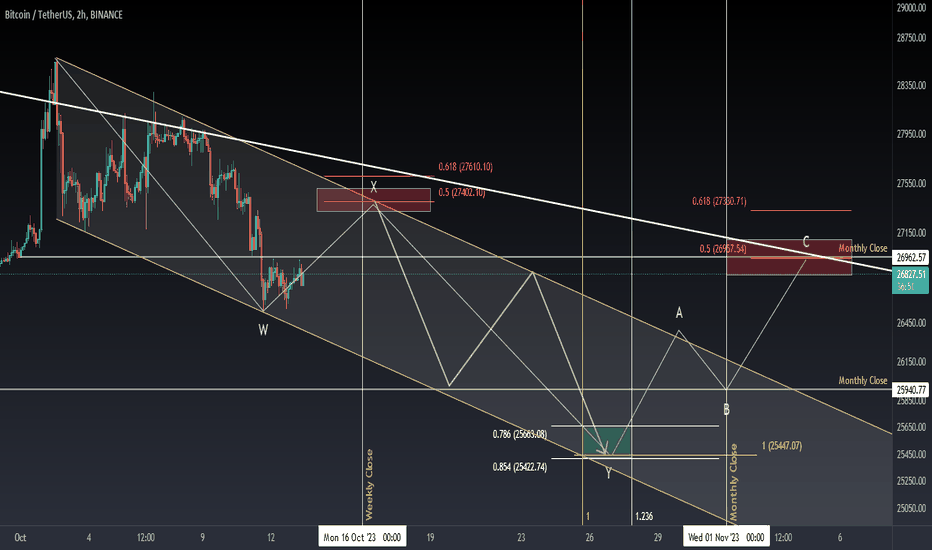
BTC: Back to September openingprice (WXY-Correction) Looking at the daily chart, you can see an series of lower highs and recent swing failure since the yearly high from july If you connect the yearly high with recent swingfailure with the candle closes, you get an downtrendline The trend is your friend, so i expect the price of bitcoin to continue down The price-action of the swingfailure you could recognize as an small WXY-correction Around the weekly close wave X could be finished around the 0.5 Fib or 0.618 Fib retracement To project an wave Y, i expect it to end around the 1.0 Fib to 1.236 Time fib extension And price-wise around the 1.0 Fib extension and 0.786 Fib/0.854 Fib retracement around the monthly opening of september Then an small correction to the upside to the opening-price of october also around the monthly close of october
Delzeyne
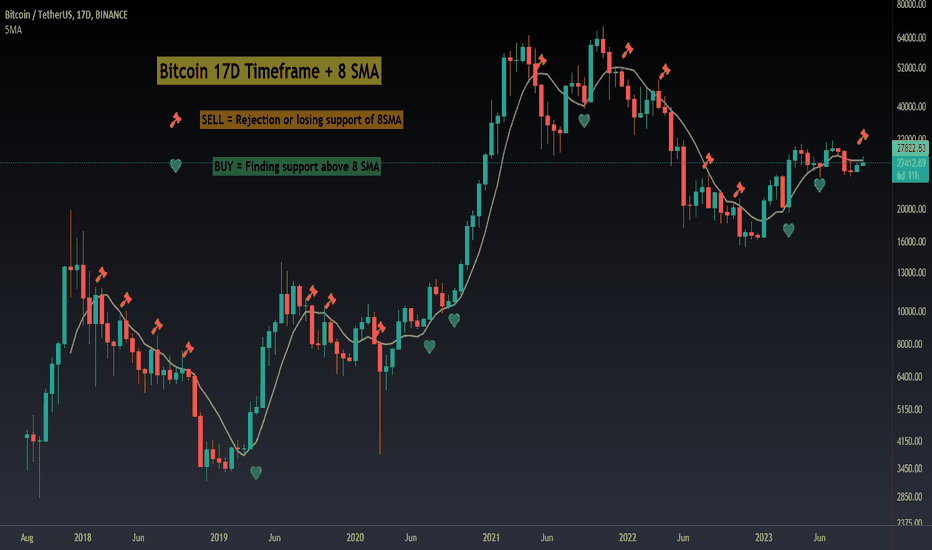
BTC: a simple swing trade strategy Day traders lose 90% of the time in a certain amount of time, i always heared The probabilty in exceeding is than 1/10, or risking 90% to earn maybe 10% That doesn't seem a good strategy for beginners Certainly if you are highly senstive or emotional like me, the odds of exceeding even go further down So my advice, and my personal type of trading is swingtrading The emotions of a 15minute chart dropping a candle to the bottom of your screen can be very impressive When zooming out your timeframe and the necessisty to look at the chart goes drastically down You have more time to make a decision, if its not clear, you just wait another day for more clarity Sure the potential profit goes down, but you need to make an decision for yourself Do i want more potential profits but a lot of risk or dou you want give up greed and lower your expectations for far less risk, time invested and stress & emotions For me its clear, i have patience, wait some weeks for an trade and its boring, but slowly progress In the meantime i do practice daytrading with the paper tradingsystem of tradingview Am i ashamed of that? No and you should not be either, it's a personal journey of progress Until you can double you're account on a papertradingsystem without leverage i advice to swingtrade Tradingview has this built in and works fine, a recommendation to use this if you still wan't to try daytrading Now to give an example of a simple swing trading strategy, it doesn't have to be complex 17 day - Timeframe + 8 Simple Moving Average Buy signal = Breaking above the 8 sma and find support on it Sell signal = Losing support on the 8 sma or rejection of the 8 sma as resistance Signals are to be looked at the candle close So every 17 day you look at price where it is Next close is in 6 days and 12h If the price closes under 8sma you could go short
Delzeyne
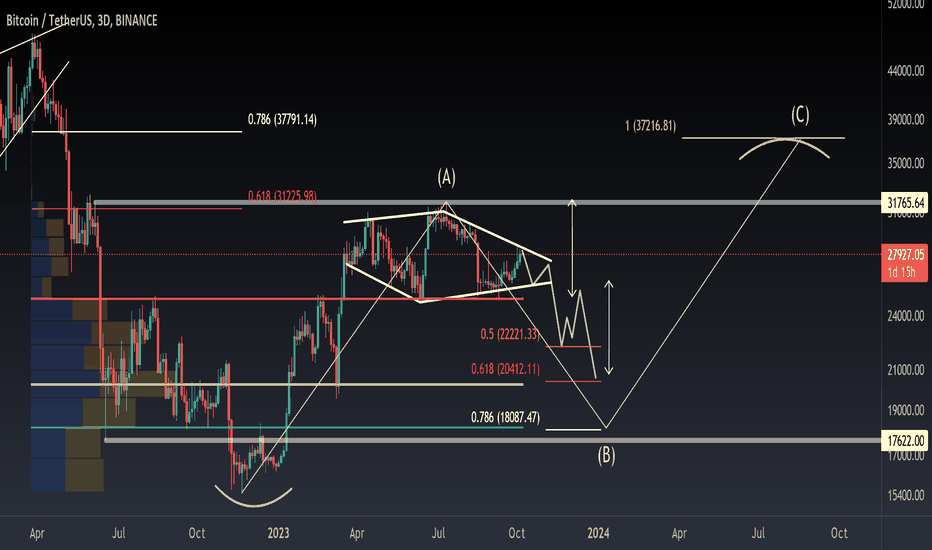
BTC: Diamond pattern + Range-Trading April 2022, bitcoin dropped from 49k to 15kand marked the bottom and selling climax Since the bottom bitcoin made an countertrend move to the 0.618 Fib Retracement of this drop When reaching this level, bitcoin went sideways for some time indicating distribution-behaviour and resistance Now we have a clear support and resistance or range we can trade off 32k and 0.618 Fib retracement acting as the resistance of the range And 18k marking the support of the range with the bottom at 15k as a deviation under the range Because months of distribution is in the past, price-action is forming multiple bearish patterns One of these patterns you can see on the chart, a diamond bearish pattern (See my other idea for bearflag-continuation pattern target 22k) Target of this pattern is to the 0.618 Fib retracement from 15k to 32k at 20k This in confluence with the point of control from the 49k dorp untill now This is a decent target to get back in the market but i dont exclude we could have a wick-event to the 0.786 Fib retracement and Value are low at 18k Don't expect it to go in a straight line down 25k was a big support last months so i expect first a move to 22k to then backtest the 25k as resistance before reaching the target of the diamond pattern Duration can be untill end of the year, not knowing if the possible wick to 18k wil happen before or after the yearly close After newyear i expect an halving relief rally and alt-season when bitcoin tries to get back to the high of the range If the the current move is an ABC-correction to the upside i expect it to reach the 1.0 Fib extension at 38k an have an deviation at resistance of the range to come back in the range for an last drop before the impulsive move, probably not back the low of the range but midpoint at 20-22k
Disclaimer
Any content and materials included in Sahmeto's website and official communication channels are a compilation of personal opinions and analyses and are not binding. They do not constitute any recommendation for buying, selling, entering or exiting the stock market and cryptocurrency market. Also, all news and analyses included in the website and channels are merely republished information from official and unofficial domestic and foreign sources, and it is obvious that users of the said content are responsible for following up and ensuring the authenticity and accuracy of the materials. Therefore, while disclaiming responsibility, it is declared that the responsibility for any decision-making, action, and potential profit and loss in the capital market and cryptocurrency market lies with the trader.