Technical analysis by Delzeyne about Symbol BTC: Sell recommendation (10/25/2024)

Delzeyne
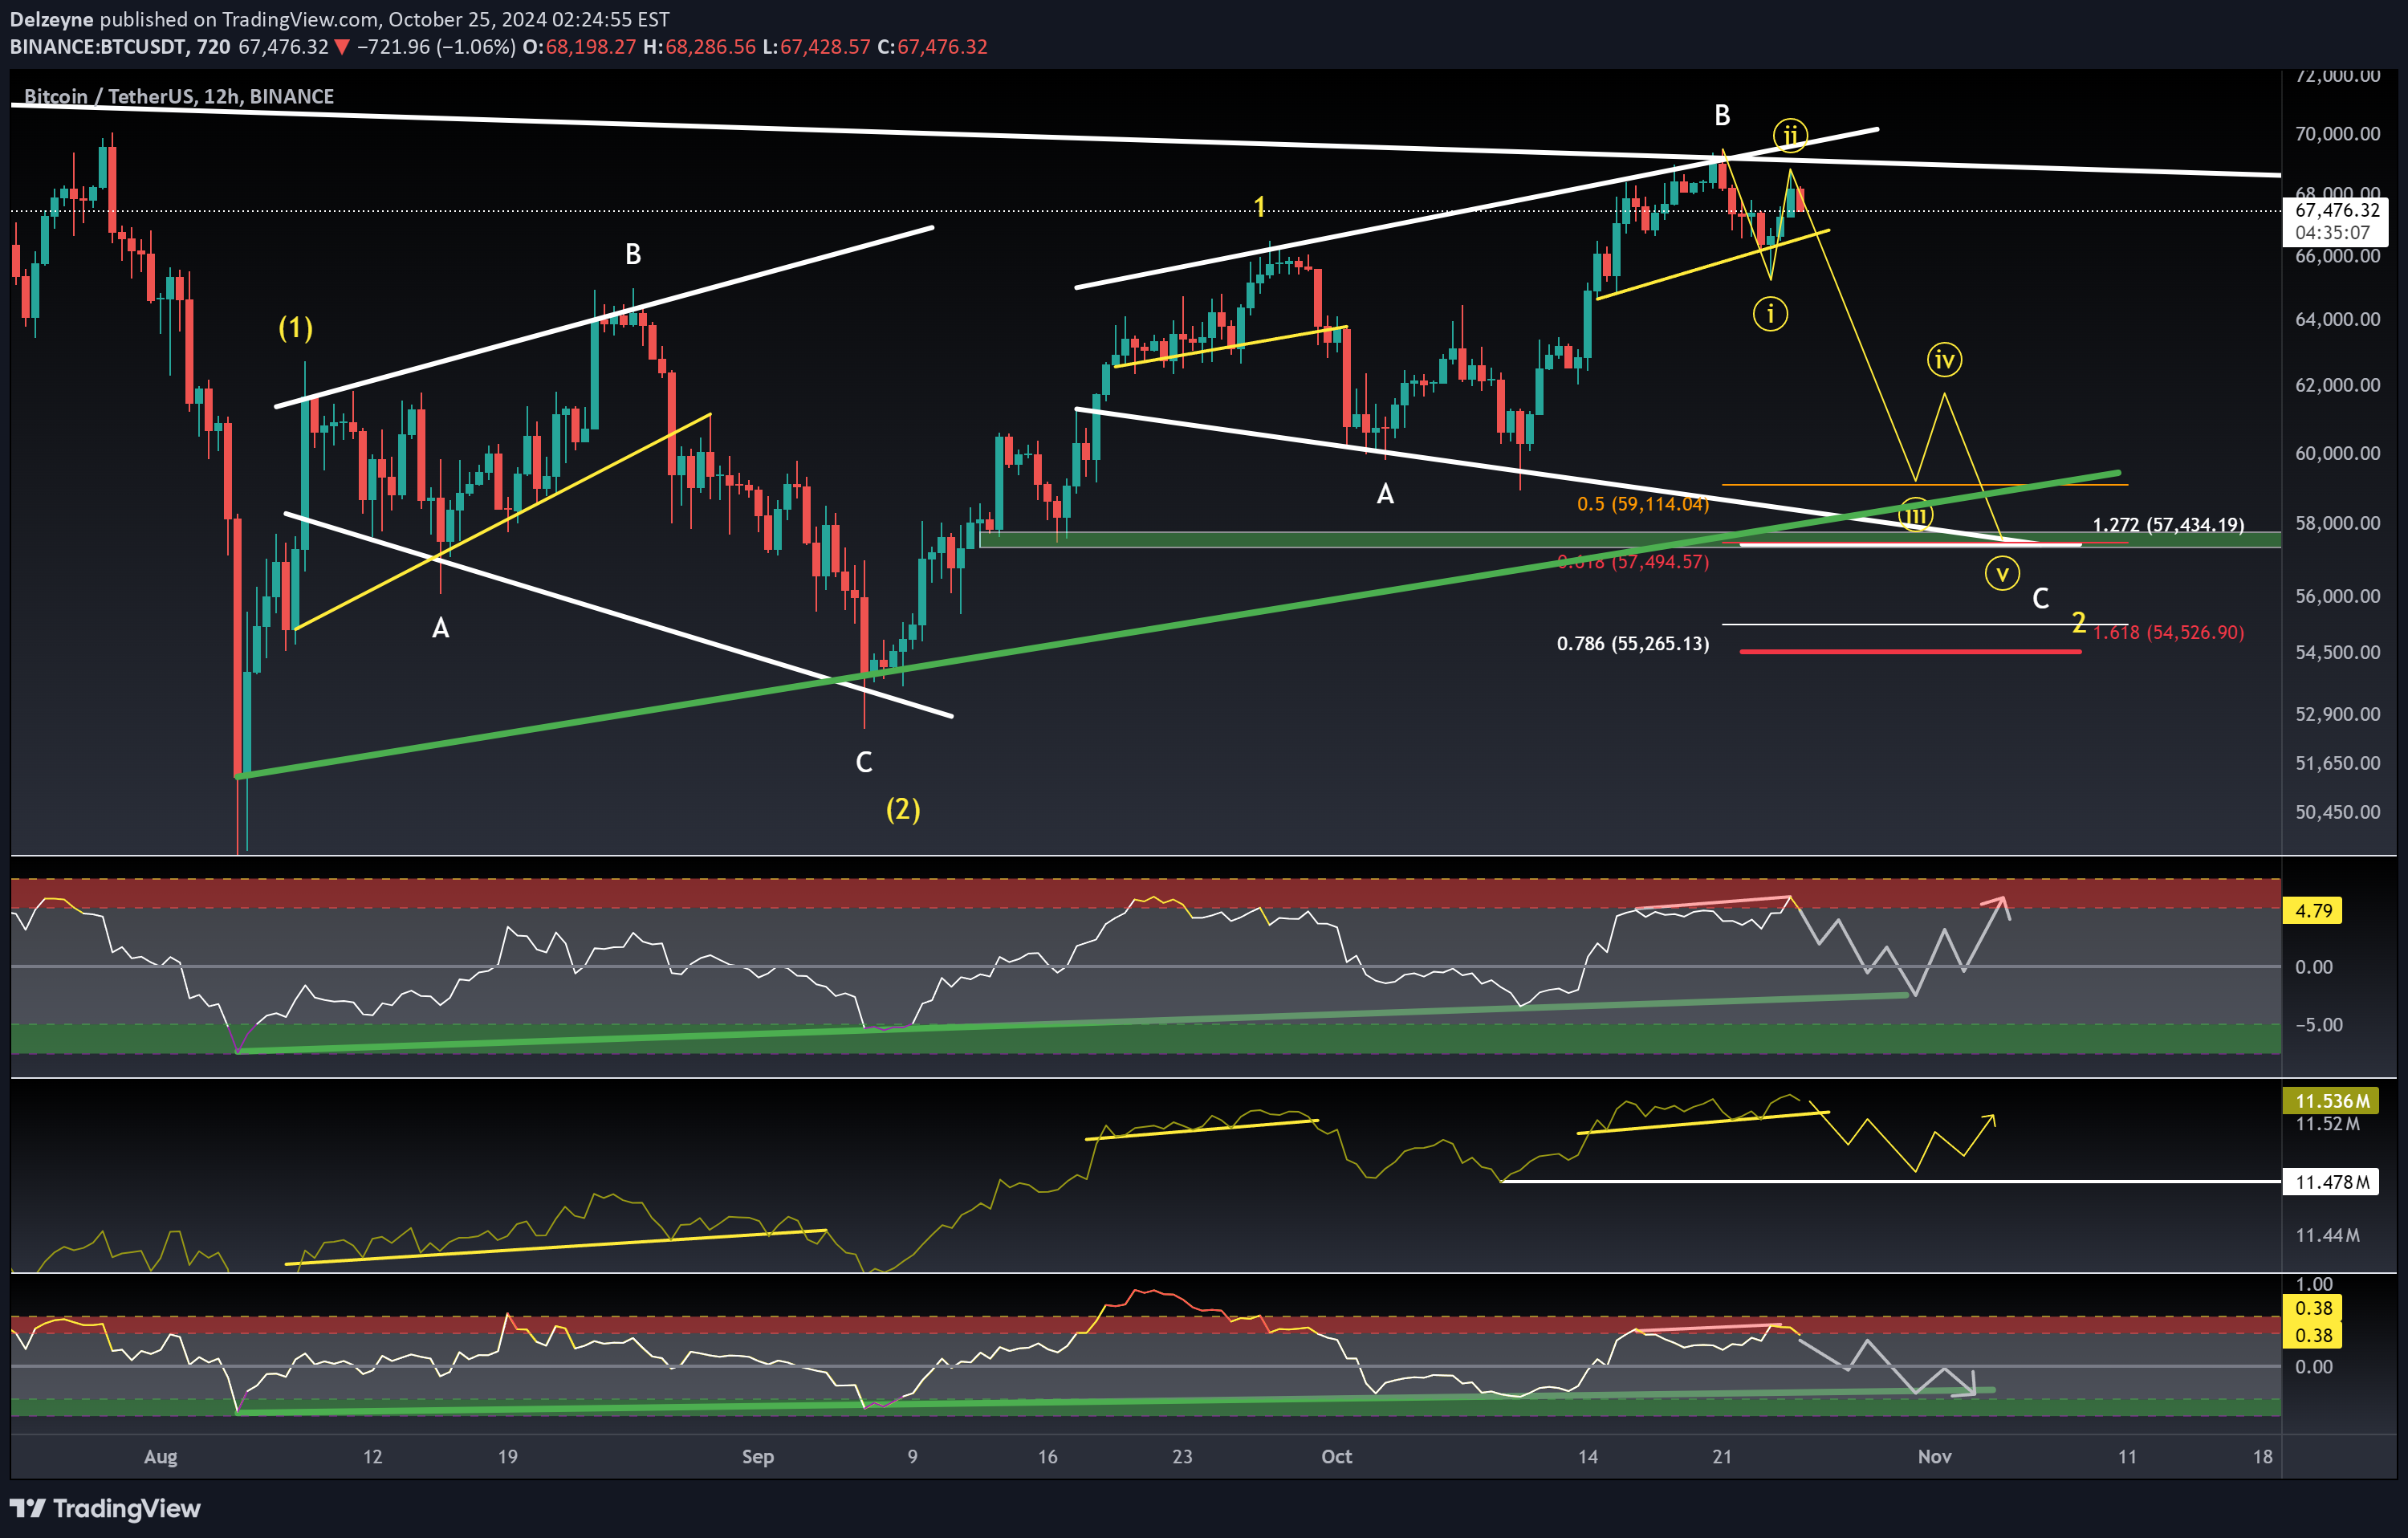
Introduction Bitcoin ended an impulsive wave last week, into mid term resistance piercing trough it and testing it as support. Inflows are increasing with these higher prices , giving liquidity to the market. If bitcoins manages to break last local low, the probability increases of trapping early longs in a false breakout to new all time highs Analyzing the 12h chart Accumulation / Distribution indicator showing an head and shoulders pattern and hidden bearish divergence with current priceaction The rate of change of the ATR and Accumulation/Distribution indicator showing overbought signals at high valuations, if these indicators can cool of on sideways priceaction bitcoin can be worth a buy again, otherwise priceation will follow these indicators to the downside Possible elliot wave count indicating a deep retracement as previous 1-2 count Riskmanagement Price should not go above the beginning wave 1 = Stoploss If price goes under the end of wave 1 = stoploss at wave 2 Targets 50% / 61,8% / 78,6% Fib retracements Green diagonal support Green rectangle boxThe high was teken yesterday, invalidating an bigger expanded flat Idea now updated for an triple 1-2 and expanded flat in last 1-2 the rate of change of the atr still needs some cooling off back to green support Several bearish divergence now building up another test of resistance into support could be needed for fuel to the upside
