
Degen-Dynasty
@t_Degen-Dynasty

What symbols does the trader recommend buying?
Purchase History
پیام های تریدر
Filter
Degen-Dynasty
سولانا در آستانه صعود نجومی یا سقوط سنگین؟ تحلیل تکنیکال و سرنوشت قیمت SOL
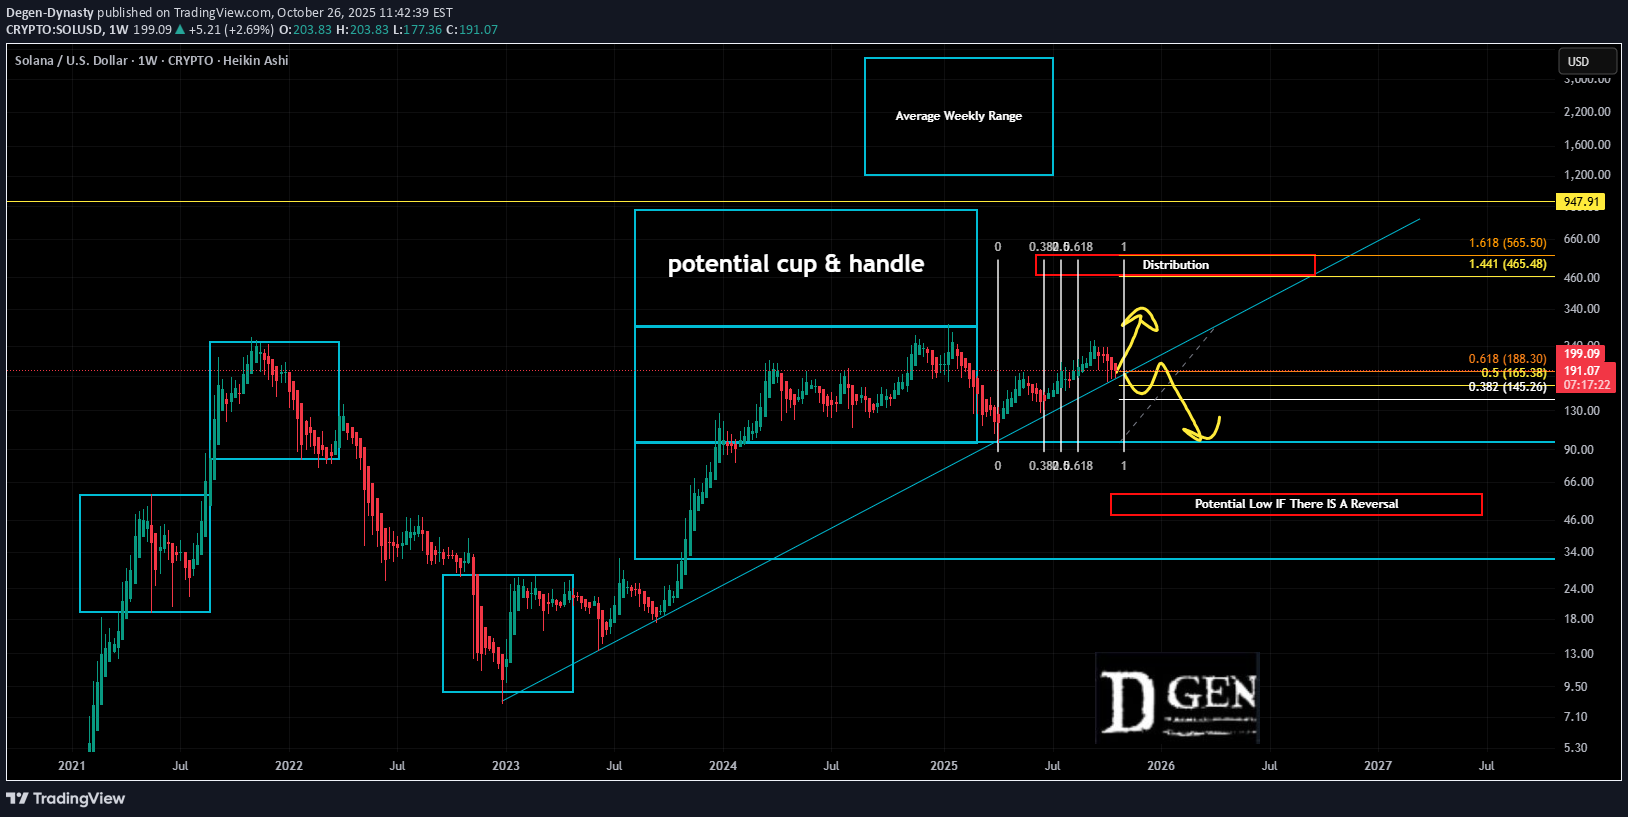
After a little over 1000days of upward trend and LONG consolidation SOl seems to be reaching a decsion point. Looking at the weekly if the market continues to rise the cup and handle tends to produce a 1.5-2x the handle. With continued upward action a 1.5 expansion of the range should be expected to end the $500 area. Considering the average range size forming repeatedly on the macro and if the trend holds with continued market rise one more rip may be in order Trade Well.... Your Friend, Degen
Degen-Dynasty
Sol Getting Ready For Round 3?

Sol has made two massive pushes to the upside this cycle followed by a long distribution / re accumulation range. We have not quite seen a full 1/3 retrace of the cycle low but certainly in range to be watching for a momentum shift signaling seller exaustion and new intrest at the lower prices. Current Trading Plan: DCA until a clear momentum shift occurs and trading rallies. Targeting same $1000 area as previous long term sol chart posted early this cycle accurately forcasting the current time and range for a major sell off. Now farther in the cycle we can see a simple doubling of the current range and standard cup and handle target aligning for the potential $1000 cycle target. Trade Well.... Your Friend, Degen
Degen-Dynasty
FET Ready For Re Accumulation

After a common ABC retrace into the 50-61.8% area since its last low prices are approaching its trend line. FET has already seen major gains this cycle along with the merger of agix and ocean. Current Trading Plan Begin to re accumulate and watch crypto market as a whole for potentialy one more push to the upside this cycle.
Degen-Dynasty
HEX Dead?

I see no real value in hex of any kind. With that said hex had Richard Heart. Regardless of opinions of Richard his efforts certainly built a massive following and interest in the project. If at some point in this potential bottom territory if Richards lawsuits were to settle positively and restarts his live streaming and constant promotion efforts.... well he is good at it. Current Trading Plan is nothing. If Richards law suits settle positively accumulate "some". If Richard returns to being Richard accumulate more.
Degen-Dynasty
INJ Ready After 50% Retrace

INJ is another crypto project that seen massive interest and price rise straight out of the bear market. Now we see it has completed a very typical retrace pattern and percentage. Since reaching its all time high it has completed a standard ABC retrace of 50% of its low. Current Trading Plan: Re-accumulate and look for another major rise in price. Risk at this stage in the cycle is much higher as we are not at a bear market low. We are at a 50% retrace of that low. Targets will be a 1/3-50% retrace back to the all time high and look for continuation for a much larger second run is the rest of the market show signs of recovery this summer.
Degen-Dynasty
CFX Ready For Another Leg To The Upside?

It has been a while since taking much interest in our favorite crypto projects. After massive gains straight out of the bear market most of that interest has sold off. Previously we were targeting the 5 cent range and appear to be getting very close. Current Trading Plan: Looking at proportional relationships in the price chart to gauge potential moves we can see the average range size seems to be about 400%. After completing a traditional ABC pattern it has moved into our potential accumulation window. Currently looking to accumulate and hold for potential 10x IF the entire market follows.
Degen-Dynasty
FET Ready For a Brake Out?

Crypto has been trading sideways for months. We have seen some significant retraces with plenty of upside available without even braking previous highs. This is a daily chart and looking at the time aspect of our gann box there is near perfect proportions with each pull back and now reaching the end of the projected cycle. Looking at the wave trend oscillator we can also it has rotated to the down side and approaching the time range to rotate back to the upside. Current Trading Plan is to target the $2.50-$3.00. This is a conservative short term target with oppertunity for much higher highs. Trade Well.... Your Friend, Degen
Degen-Dynasty
BTC Trapped? Or Ready For Another Run

Since hitting its high in March around 75k BTC has been trapped in a megaphone consolidation pattern. Locally we have been trapped between 49k and 70k. There is no way to know if the pattern will continue but the longer it goes on the more likely it is to brake. Current trading plan is to stick to the short side until the pattern brakes showing a clear sign of strength. Higher prices are certainly obtainable but since reaching that forcasted higher we have been in a down trend that simply hasn't ended yet. If the pattern continues and that is a big if we would expect another lower low. Looking at the volume profile we see a large low volume gap between 45 and 55K. 49k may be a sufficient low. It was a near perfect 38% retrace to the last low of 25k. If we head lower the value area high around 45k would be just above the most typical retrace of 50% creating a reasonable target area if there is more down side. Current Trading Plan: Continuing to target downside moves until the previous swing high of 70k is clearly broken with more than a wick and targeting the 45k area. The longer we consolidated WITHOUT dropping the more likely it is that sellers have been absorbed and 49k is as low as we will see. Trade Well.... Your Friend, Degen
Degen-Dynasty
Ethereum Ready To Rip?

Eth is a staple to the crypto industry and doesn't require much analysis to assume up and to the right... The question is when and where. Currently looking at the weely chart we can see out wave trend oscillator is showing momentum to the down side is slowing as price has come down to out main up trend and the last major support resistance flip. Current trading plan is resume in the long direction targeting a 1.5 expansion of the previous bull run high to bear market low range around 10-12k. Our trend time technique has tracked to the week on both btc and eth this cycle. Regardless of direction change should be expected in mid october and may 2025 IF the same continues. Trade Well... Your Friend, Degen
Degen-Dynasty
CFX Re-Accumulating For A Push Up?

CFX has been on our short list of big movers as its recovery in the bear market was among the highest gainers at a 25x. A clear sign of major support off a bear market bottom. Price has since put in a higher low, higher high, and now a 100% retrace for a potential double bottom. Just sounds bullish... In this same green range this double bottom is also the volume based value area low of the entire price range for the past three years. Looking at the curvature of the lows in the price action we can also see a clear loss of down ward momentum into this significant macro support level. Wave trend oscillator is also showing we are in the "time frame" of the liquidity cycle for a rotation of some kind to the upside. Unfortunately this doesn't mean there can't be some kind of major flash crash first.... Its a time thing showing the shift of momentum from selling to buying. Current trading plan is to accumulate initially targeting a 50% rise in price for less than a 50% retrace. Second target is a simple and very typical 50-62% golden pocket retrace and the volume based value area high of the past 3years of price action The last target may be wishful thinking BUT if the project had enough support previous before pumping to go as high as it did and there is now more support for it.... this is what creates and expansion of the range. New and more support for the project....Typically lands in the 1.5 expansion area... If we see the reversal and upward rise from here I would expect at least resistance and need to consolodate in these areas. If the rise continues great be each is worth location to lock in any gains, watch and reaccumulate if necessary with the rest.... Trade Well... Your Friend, DegenVideo Explanation and Brake Down of Chart youtube.com/watch?v=JlE8KN_PlSwwrong link the above link is for inj and below is the CFX chart above youtube.com/watch?v=mRi1K6c_qYM
Disclaimer
Any content and materials included in Sahmeto's website and official communication channels are a compilation of personal opinions and analyses and are not binding. They do not constitute any recommendation for buying, selling, entering or exiting the stock market and cryptocurrency market. Also, all news and analyses included in the website and channels are merely republished information from official and unofficial domestic and foreign sources, and it is obvious that users of the said content are responsible for following up and ensuring the authenticity and accuracy of the materials. Therefore, while disclaiming responsibility, it is declared that the responsibility for any decision-making, action, and potential profit and loss in the capital market and cryptocurrency market lies with the trader.