
DarkAnalyzer
@t_DarkAnalyzer

What symbols does the trader recommend buying?
Purchase History
پیام های تریدر
Filter
DarkAnalyzer
Could this be the end of Bitcoin’s trend?
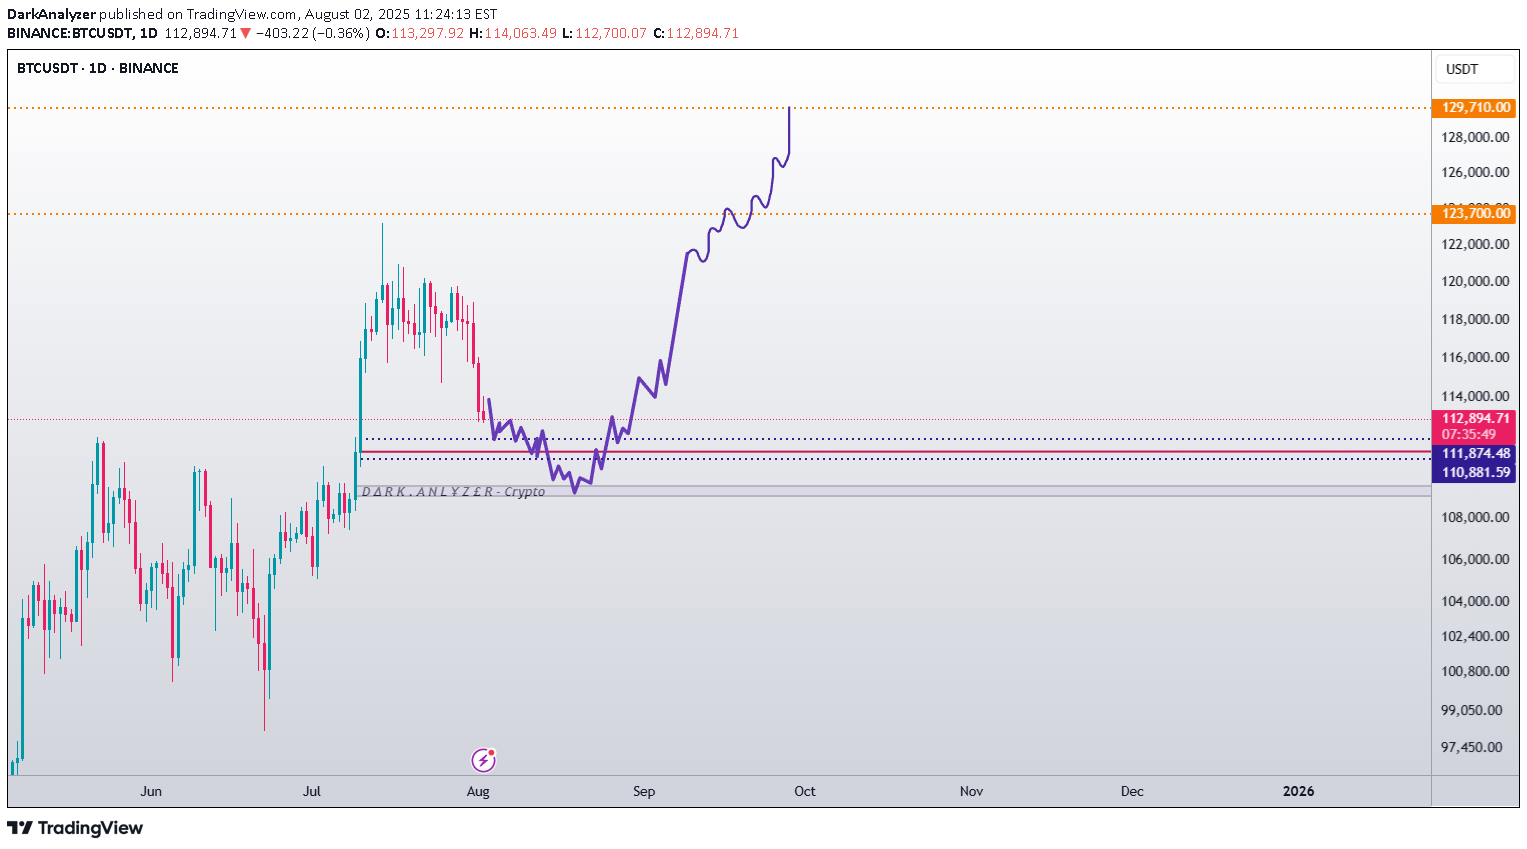
The Current State of Bitcoin’s Trend: Has the Uptrend Come to an End...? Based on recent analyses, Bitcoin has exited its 4-hour channel over the past few days, and there is still a possibility for further correction. However, this does not mean that the uptrend for Bitcoin is over. My targets for Bitcoin remain the same as before: 123,700 and 129,710. It’s even possible that we might see a wick above these prices. For those with more capital who are looking to buy Bitcoin, there are two good entry levels: 110,880 109,770 Everything else is clearly shown on the chart. Please be cautious, as there will likely be high volatility once the market opens. Be sure to open the analysis link and boost the analysis with your likes.
DarkAnalyzer
The continuation of the upward bull run of Bitcoin

💠 The nature of the market has always been such that every uptrend at the beginning of an upward trend requires a short correction, and this is not far-fetched for Bitcoin. ⭕️ Everything is self-explanatory on the chart and no further explanation is needed. Dear friends, the numbers given in the chart are drawn according to analytical and trading experience. So far, all my analyses have had a very low error rate, and I hope that this analysis will again achieve its goals without mistakes. ▫️The buying suggestions are the blue and purple lines, which I recommend buying as DCA. If you have two targets, you can see that there is no reason why the second target must be seen. It is possible that a sharp decline will begin near or in the middle of these two targets. Therefore, be sure to take your profits from the first target. Support us by liking the analysis ❤️
DarkAnalyzer
A logarithmic look at the #Bitcoin monthly chart according to th

All the points drawn in the chart, all these numbers are based on the numbers of previous halvings and time analysis This is a long-term analysis in the last months of 2026, i.e. November and December Any upswing requires a price correction to continue the trend, which is well seen in Bitcoin, and my correction opinion is after hitting the new historical ceiling of the blue line. This correction, which is after hitting the ceiling, will happen after the months of November 2025 If the numbers are done with a little up and down, I hope you will be satisfied with the analysis I hope you can use this analysis in the long term and send it to your friends
DarkAnalyzer
$BTC Falling, an opportunity to buy

A very important price support that I expect a good price reaction Everything is specified in the chart
DarkAnalyzer
#DOT A rebound from pricey support

Considering the failure in the weekly time and reaching the resistance, the expectation to reach the support is high You can make purchases in two steps Don't forget that the price goes up with your likes
DarkAnalyzer
ADA$ Waiting to reach the demand area

As you can see, we have a demand area for This area is very reactive and we expect the start of an upward movement So get purchase confirmation in the time trigger The price goes up with your likes
DarkAnalyzer
$XRP Preparing for a price jump

At the end of the XRP analysis, you saw that we gave buy areas and from these areas, the price brought a good pump Again, according to the correction below the LQ, we again have a great area for price jumps, which you can buy after receiving and confirming the time trigger. This analysis will be performed with your likes
DarkAnalyzer
The start of an uptrend #SFP

According to three drives and the movement of 4 drives on the support, it is possible to move up There is a red line resistance, you can make your purchase by breaking this resistance in the time trigger
DarkAnalyzer
Strong bounce for XRP

Strong bounce for XRP What is seen in the chart is not enough This analysis is based on fundamental analysis + complete price analysis + time analysis The important trading points for buying are specified in the chart, which is the best blue trend point that you can use We expect this climb to start from the date indicated in the chart, and don't forget that this time is weekly and the trigger is daily and 4-hour times. Do not forget to like this analysis, thank you
DarkAnalyzer
Awaiting regrowth FTT

Awaiting regrowth FTT FTTUSDT With the investigations done in terms of time analysis, we determined two dates for the rise (green color) and two dates for the price drop (red color) in the chart. We expect the price to start increasing when it reaches our target date. Part of the chart is repeated from the past
Disclaimer
Any content and materials included in Sahmeto's website and official communication channels are a compilation of personal opinions and analyses and are not binding. They do not constitute any recommendation for buying, selling, entering or exiting the stock market and cryptocurrency market. Also, all news and analyses included in the website and channels are merely republished information from official and unofficial domestic and foreign sources, and it is obvious that users of the said content are responsible for following up and ensuring the authenticity and accuracy of the materials. Therefore, while disclaiming responsibility, it is declared that the responsibility for any decision-making, action, and potential profit and loss in the capital market and cryptocurrency market lies with the trader.