
DEinvestment
@t_DEinvestment

What symbols does the trader recommend buying?
Purchase History
پیام های تریدر
Filter
DEinvestment
adA IS BUllISh YESSSSSSSSSSSSSSS

TL;DR Synopsis Cardano price analysis reveals a bullish trend, with ADA/USD facing rejection at $0.4478. Support for ADA is present at $0.4296. Cardano price analysis is providing us with strong optimistic signs for the day. The bullish tide has been quite strong, as price levels have been growing at a regular and consistent rate. The price is currently at $0.4402, which is a significant victory for purchasers. More positive movement is predicted as support at $0.4296 is stabilized.] All in all, Cardano price research reveals that the currency has been able to make a strong rebound today and buyers have been successful in pushing prices over $11.4402. However, the bulls must watch for the resistance at $10.4478, which could pose a barrier to further gains. The strong bullish momentum suggests that Cardano's price may rise above the given level if buyers maintain market pressure. dm for more info
DEinvestment
Earthquake tips SOLANA Fall

Solana pricing research reveals a downward trend. The resistance level for SOL is $24.89 Support is seen at $23.50. Recent Solana price research shows that the coin has been moving sideways over the last few days. The inverse has begun to take shape, resulting in bearish pressure. The current price of Solana is $23.61, with a small downward trend in the graph indicating that sellers currently outnumber buyers. The bearish has been in charge for the last few days, generating a headwind for the cryptocurrency. The resistance level is $24.89, while the support level is $23.50. In terms of volume, Solana has experienced a reduction in buying momentum as well as trading activity during the last several days.
DEinvestment
Finally, Robinhood has entered the software wallet sector.
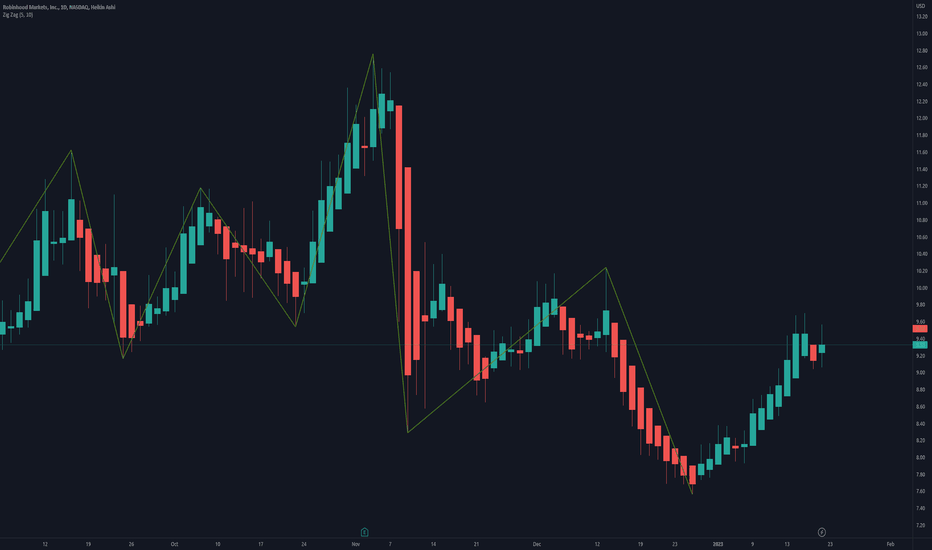
Wallet users can now view their owned NFTs and coins. Robinhood Wallet was created to compete with MetaMask. Robinhood has recently entered the software wallet market. The crypto business released the Robinhood Wallet, accompanied by smartphone software that allows users to exchange and send cryptocurrency. Furthermore, users may now view their own NFTs and crypto. Currently, over 1 million waitlisted consumers have access via an access code. Last year, the stock and cryptocurrency trading company Robinhood collaborated with Polygon to build the wallet, a self-custody, Web3 wallet. The trading platform only released a test version of its Web3 wallet for iOS. In May 2022, it was made available to the first 10,000 users who signed up for the waitlist. The wallet was first housed on the Polygon blockchain, allowing users to trade and switch cryptocurrencies while incurring no basic network fees. Johann Kerbrat, a chief technological officer of the Robinhood Crypto & Trading Platform, made the announcement public. Johann also revealed that Robinhood Wallet simplifies the complexity of Defi and web3 to make cryptocurrency more accessible to everyone. Polygon, as the preferred blockchain network for Robinhood, provides speed, scalability, scalability, cheap network costs, and a wealthy developer environment. Robinhood's partnership with Polygon began in August 2022, when the platform launched functionality for MATIC withdrawals and deposits on the proof-of-stake (PoS) chain. The whole story of the Robinhood wallet release might be confusing because of the changes that took place in the last couple of months. Previously, the crypto platform introduced a new transfer feature on its original trading app as a “Crypto Wallet” product. The feature was launched in beta in January 2022, and it allowed Robinhood users to transfer crypto to and from the platform. Technically, it wasn’t a crypto wallet as it’s almost the same as how users can transfer crypto to and from Kraken, Coinbase, Binance, or any other crypto trading platform. The wallet that is now officially rolled out today is considered more like Phantom, MetaMask, or the Coinbase Wallet. The Robinhood wallet released now is a completely different product which is purposely housed in a separate standalone app to allow users to have maximum control over their crypto. The new app provides access to more advanced features, like NFT marketplaces and connecting to decentralized apps.
DEinvestment
ETH is DEAD 2023!!!
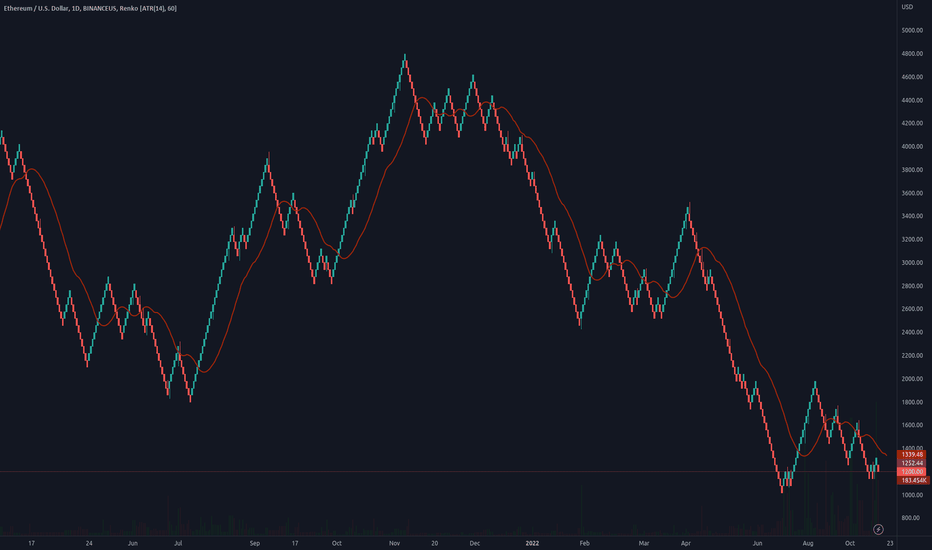
Ethereum price analysis shows a downward trend. ETH has retreated from its two-day high of $1,219. ETH is consolidating above $1,200, with a bearish tilt. According to a recent Ethereum price analysis, the price of ETH has been bouncing in a very narrow range over the last few weeks. Ethereum has had a minor reversal today after a two-day run that saw the cryptocurrency briefly rally near $1,250 resistance. Over the last two weeks, the price of Ethereum has been fluctuating in a band between $1,200 and $1,250. The bulls have failed to clear the critical barrier at $1,250 convincingly, and ETH/USD may potentially fall toward the $1,150 support level. The overall market mood continues to be pessimistic, with ETH slipping below the 20-day moving average. Ethereum is currently at $1,209.94, a 0.75 percent decrease from its two-day high of $1,219. The bulls must defend the $1,170-$1,180 support zone to commence a new rally toward $1,250. A strong close below $1,170 may pave the way for a further slide toward the 50-day and 100-day moving averages, which are both at $1,100. The bulls must break above $1,250 to initiate a new rise in ETH/USD. Ethereum price analysis on a daily chart reveals that ETH has been consolidating in a range above the $1,200 support. However, it has dropped out of the content in the last few hours. If the bears can sustain the price below $1,170, a more significant drop toward $1,100 is likely. To begin a new upward trend, Ethereum must break over the $1,220 barrier. The overall market attitude is adverse, and bulls must generate momentum above $1,200 and $1,220 to sustain the price above essential supports. On the 4-hour chart, the Relative Strength Index is below 50, indicating a bearish trend in ETH/USD. The MACD is also in the negative area, implying that ETH will suffer further losses in the short term. Conclusion of Ethereum price analysis Finally, Ethereum price analysis indicates that ETH/USD may continue erratic and range-bound until it finds a definite direction. On the downside, if the bears can break through the $1,170 support level, a larger drop toward $1,100 is likely. On the plus side, the bulls require to break above $1,220 and $1,250 levels to start a fresh increase.
DEinvestment
SOL is still retracing support.

Today's Solana price analysis is pessimistic. The most resistance is found at $14.57. At the time of writing, SOL was trading at $12.31. Solana's price analysis for December 17, 2022, suggests that the market is completely bearish; however, Solana has achieved enormous negative momentum, indicating a decrease in the SOL market. Solana's pricing has stayed negative in recent hours. Today, the price dropped from $13.06 to $11.94. However, the market began to rise in value again soon after, since the cryptocurrency had already gained more of its value. Furthermore, Solana has surged to $12.31, barely shy of the $12.50 level. Solana's current price is $12.31, with a trading volume of $383,744,102. Solana has been taken ill. This gives us 8.37% in the last 24 hours. Solana currently ranks at #15 with a live market cap of $4,510,324,801.
DEinvestment
CHAINLINK IS SHOCKING!!!

The current ChainLink price analysis is optimistic. At $7.5 there is the most opposition. The price of $6.6 has the most robust support. The market is moving upward and gaining pace as of November 27, 2022, according to ChainLink pricing research, which is encouraging for the LINK market. Over the previous few hours, ChainLink's price has stayed bearish. The cost rose from $7 to $7.4 on November 26, 2022. However, the market quickly gained more worth and expanded in value. In addition, ChainLink rose and trades at $7.1, just shy of $7.5. ChainLink is currently trading for $7.1 with a $349,849,723 trading volume. In the past 24 hours, Chainlink has increased by 3.53%. Currently ranked #21 with a live market cap of $3,609,813,927, ChainLink is a company.
DEinvestment
BTC analysis IS BULLISH

Today's bitcoin price analysis is positive. To $16,500, BTC/USD reversed course. Over the previous hours, there was less selling pressure. Today's bitcoin price analysis is positive as a result of the higher low that was recorded around $16,500 after a 24-hour retrace. BTC/USD has likely made a new bottom and is now poised to rise much further over the weekend. Another significantly lower high for the price of bitcoin was achieved at $21,500 last weekend, and this week it quickly reversed. BTC/USD began to fall sharply after previous support at $20,000 was breached, quickly reaching $18,000. Following that, there was no recovery, which led to a fast wave lower on Wednesday. This time, a challenge of the $16,000 support led to a considerably greater reaction upward to the $18,000 level. Over the previous 24 hours, the market experienced negative trading. Bitcoin, the market leader, fell by 4.18 percent, and Ethereum by 2.34 percent. Most of the top altcoins fell even further in the interim. Bitcoin price movement in the previous day: Bitcoin tested the downside again. BTC/USD traded in a range of $16,543.48 to $18,054.31, showing high volatility in the previous day. While the total market capitalization fluctuated around $322.63 billion, representing a dominance of 37.92 percent, trading volume fell by 38.55 percent to $60.3 billion. BTC looks to set a higher low on the 4-hour chart of USD/BTC On the 4-hour chart, we can see evidence of support at the $16,500 level, suggesting that a higher low is probably going to be formed.
DEinvestment
‘Max Pain’ Bitcoin Faces $9,100

Since the asset has maintained its position of over $18,000, it has fallen by more than 6% over the last week. When Bitcoin reached a peak of $20,071 on Sunday, the bears firmly rejected the recent gain. The Federal Reserve's aggressive rate hike campaign worsened the previous decline. Since then, BTC has fallen precipitously, but it is still firmly above the $18.5k support level. At the time of reporting, the asset's price was $18,719, a decrease of 5.25% from the previous week. A well-known Bitcoin analyst believes that Bitcoin (BTC) has not yet touched the bottom because he predicts a drop to $9,100.
DEinvestment
HOW HIGH WILL DOGE COIN REACH IN 2030? - DOGE Price Prediction

The DOGE is inferior to the inflation rate of the USD and has a limitless supply, albeit the inflation momentum does diminish over time due to a set distribution pace. Although the circulating supply is fully unlocked, the total amount of DOGE is already high. Dogecoin's one-minute block time is inferior to those of other payment processors like VISA. In addition to the aforementioned, the whole cryptocurrency market is now struggling. As Bitcoin prices fell below their psychological level of $20,000, the sentiment in the cryptocurrency market appears to be gloomy. Because of this, the cost of Dogecoin is probably going to remain stable between $0.055 and $0.075 through the end of 2022. Cryptocurrencies are anticipated to be widely used by 2030. Given that the internet is practically ubiquitous worldwide access to a person's preferred token is simple on earth. A meme token created to be a humorous representation on the internet is called Dogecoin. Today, most people choose to spend their time having fun online. Dogecoin can be used to tip content producers all over the world. Dogecoin might experience a significant price growth from today, hitting prices between $2 and $4 and a market worth between $266 billion and $533 billion by 2030, if this scenario comes true. LIKE, COMMENT AND SHARE.
DEinvestment
BTC Pressured Below $24,000; Is $26,000 conceivable?

The present Bitcoin value examination is showing financial backers' combination mode. As the cost expands the earlier day's sideways development in a scope of $23,400 and $24,000. The greatest digital money by market cap has been exchanging with an unbiased to a somewhat bullish predisposition. BTC cost exchanges higher with unassuming additions on Saturday. The development of two-sequential candles recommends hesitation among brokers. A solid obstruction playing around $24,200 and $24,400 zone. As of composing, BTC/USD is perusing at $23,899.05, up 0.47% for the afternoon. The cost has been uniting beneath the $24,000 mark however the drawback is very much covered close $23,700. Assuming that the value figures out how to hold over the meeting's high of $23,978 more potential gain should be visible in the coin. On the day to day diagram, the BTC cost examination shows that the cost has been exchanging a rising wedge development. A rising wedge is a negative continuation specialized design. Nonetheless, the cost is agreeable and sits over the basic 20-day and 50-day EMA's showing a bullish fundamental opinion. An everyday close over the referenced level would make ready for the mental $26,000 level, This likewise concurs with the upper trendline of the wedge development. The MACD oscillator shows that the bullish energy is supporting over the midline. The RSI (14) is right now exchanging close to the 59 level, which shows that the market is in bullish mode and is a long way from overheating. Any increase in the markers would reinforce a bullish breakout out of the ongoing union. The 24-hour exchanging volume of BTC dropped over 18% to $32,530,459,847. Then again, a break underneath the meeting's low would tempt bears to go into exchange. All things considered, the cost could meet the 50-day EMA at $23,191 followed by the low of July 24 at $22,263.
Disclaimer
Any content and materials included in Sahmeto's website and official communication channels are a compilation of personal opinions and analyses and are not binding. They do not constitute any recommendation for buying, selling, entering or exiting the stock market and cryptocurrency market. Also, all news and analyses included in the website and channels are merely republished information from official and unofficial domestic and foreign sources, and it is obvious that users of the said content are responsible for following up and ensuring the authenticity and accuracy of the materials. Therefore, while disclaiming responsibility, it is declared that the responsibility for any decision-making, action, and potential profit and loss in the capital market and cryptocurrency market lies with the trader.