
DCAChampion
@t_DCAChampion

What symbols does the trader recommend buying?
Purchase History
پیام های تریدر
Filter
DCAChampion
پورتال جدید بنیاد اتریوم؛ آیا جهش ۵ درصدی ETH ادامه دارد؟
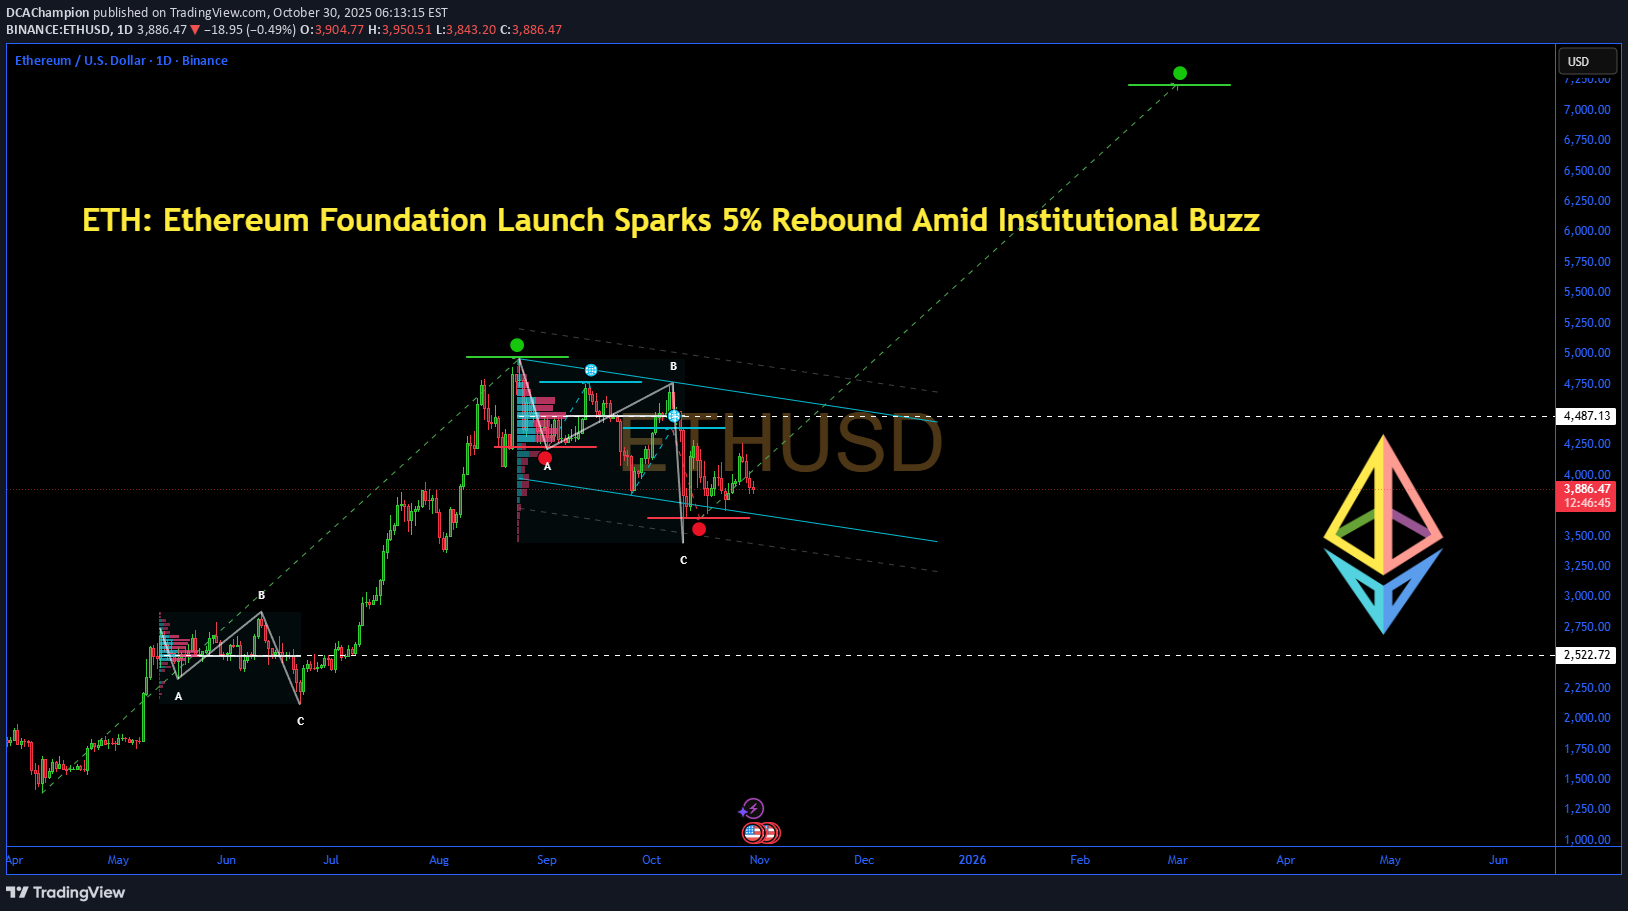
ETH: Ethereum Foundation Launch Sparks 5% Rebound Amid Institutional Buzz – SWOT, Price Action, and Intrinsic Value Insights 📊 Introduction As of October 30, 2025, Ethereum (ETH) is navigating post-Fed volatility with a mild rebound trend, climbing 1% intraday to around $3,939 after dipping to $3,854 earlier, on volume exceeding $40B. This price movement follows the Ethereum Foundation's launch of a new institutional adoption portal, amid viral social media buzz (#EthereumInstitutional trending with over 800K mentions) highlighting DeFi growth and staking opportunities. Applying timeless investing principles to identify profitable setups, this reveals potential mispricings in the blockchain sector, influenced by macroeconomic factors like Fed's 25bps rate cut hints and $2T liquidity boosts, though sector dynamics reflect Ethereum's 67% DeFi dominance amid competition from L2s and regulatory shifts. 🔍 SWOT Analysis **Strengths 💪**: Ethereum's robust ecosystem, with over 1.6M daily transactions and average fees near $0.01 per filings and on-chain data, supports a secure network with 35.7M ETH staked (29% of supply). This has driven recent price rebounds from $3,800 lows, tying into strategies for capitalizing on network effects and scarcity for long-term returns. **Weaknesses ⚠️**: High long-term holder selling (3-month high in October) and energy consumption concerns contribute to 5-10% price pullbacks during sentiment shifts, emphasizing the need for safety in volatile assets. **Opportunities 🌟**: The Foundation's portal for tradfi onboarding, coupled with TVL at $85B+ and projected 30% growth in DeFi, positions for 15-20% price surges on adoption news, with valuation metrics like P/TVL ~8x offering re-rating asymmetries to generate compounding gains. **Threats 🚩**: Fed rate cut profit-taking and competition from Solana (faster TPS) risk 10-15% corrections, as seen in recent dips post-BTC dominance spikes, but proven principles help filter for profitable navigation. 💰 Intrinsic Value Calculation Employing a value investing approach to estimate intrinsic value, we adapt a discounted network model with a margin of safety as emphasized in classic methodologies, ensuring actionable, money-making insights. Key inputs from public data: TVL ~$100B (averaged from reports), circulating supply 120.7M ETH, staking yield ~3.5%, projected growth rate 40% (based on DeFi surges and institutional catalysts). Formula: Intrinsic Value per Token = (TVL per Token * Weight) + (Annualized Yield * Growth Multiplier) - TVL per Token = $100B / 120.7M ≈ $828.50 (weighted at 0.7 for core value) - Annualized Yield = 3.5% (weighted at 0.3, multiplied by 12x growth factor for ecosystem) Calculation: (828.50 * 0.7) + (0.035 * 12) = 579.95 + 0.42 = 580.37 Scaled to market comparables (e.g., BTC's P/TVL ~10 vs. ETH's current 8.5): Adjusted Intrinsic = 580.37 * 7 (blended for scalability) ≈ $4,062.59 Apply 20% margin of safety: $4,062.59 * 0.8 ≈ $3,250.07 At current price ~$3,939, ETH appears overvalued by ~18% (factoring limited upside to $4,063 fair value per adoption alignment). No debt flags, but sustainability depends on TVL growth outpacing holder sell-offs. 📉 Overvalued. 🚀 Entry Strategy Insights Rooted in time-tested disciplines for compounding wealth, identify support zones around $3,800-3,850 (near 200-day SMA) for unleveraged, long-term positions via dollar-cost averaging, entering on breakouts above $4,000 after 5-10% corrections from news events. Tie non-repainting momentum signals to viral launches like the Foundation portal for profitable timing amid volatility. ⚠️ Risk Management Position sizing at 1-5% allocation to preserve capital during crypto swings, diversifying across Layer-1s and stables. Watch for 15-25% volatility from Fed news; use trailing stops 10% below entry (e.g., $3,545) and hold long-term if fundamentals hold, ensuring sustainable profitability through principle-driven caution. 🔚 Conclusion Ethereum's institutional push, rebound dynamics, and overvalued metrics signal caution in the current rally, but principle-driven analysis highlights opportunities in dips for measured gains. Key takeaways: Prioritize network adoption for value, verify TVL trends independently. Share your thoughts in comments – does this Foundation launch change your view? #ValueInvesting #Ethereum #CryptoRally #DeFi #Blockchain This is educational content only; not financial advice. Always conduct your own due diligence.
DCAChampion
طلا: پتانسیل رشد ۳۰ درصدی در دارایی امن؛ تحلیل ارزش ذاتی و استراتژی ورود
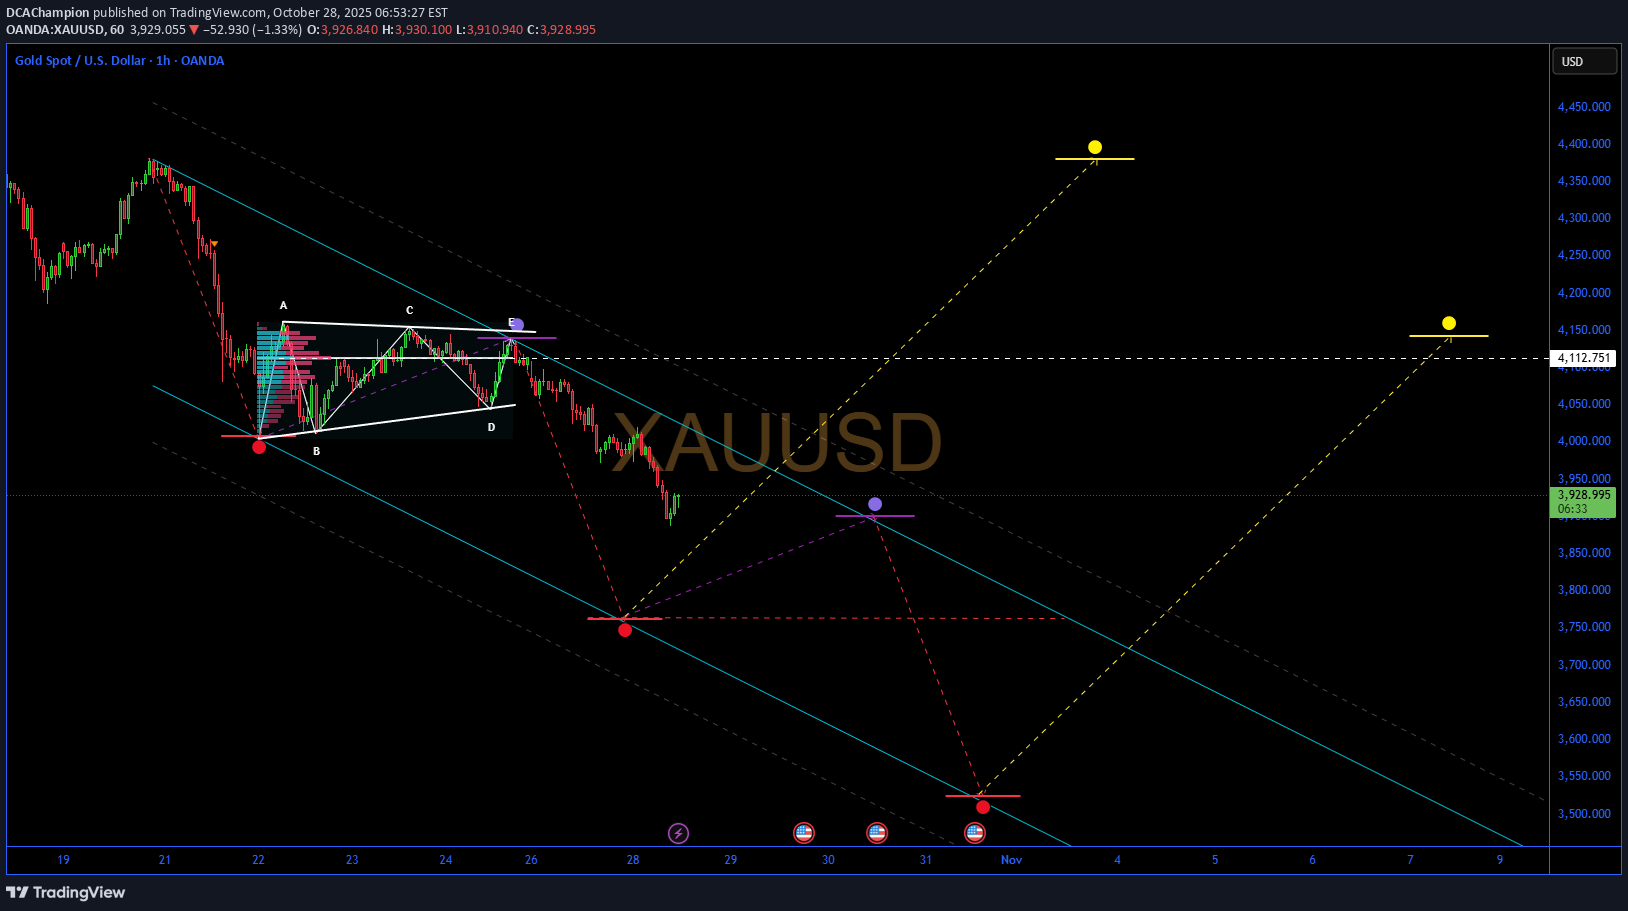
XAUUSD: Exploring Potential 30% Upside in Safe-Haven Asset Amid Geopolitical Tensions – SWOT and Intrinsic Value Insights 📊 Introduction As of October 28, 2025, XAUUSD (Gold/USD) is experiencing a short-term correction following record highs above $4,300 earlier this month, trading around $3,950 per ounce. This pullback reflects improved risk appetite in equity markets amid stabilizing U.S. economic data and reduced recession fears, with the S&P 500 up 2% week-to-date. However, broader macroeconomic factors, including persistent inflation at 3.2% year-over-year and central bank gold purchases exceeding 800 tonnes year-to-date, underpin a supportive environment. Sector dynamics highlight gold's role as a hedge against geopolitical risks, such as escalating Middle East tensions and U.S.-China trade uncertainties, though volatility is elevated due to a strengthening USD index near 105. 🔍 SWOT Analysis **Strengths 💪**: Gold serves as a proven inflation hedge and store of value, with central banks accumulating over 900 tonnes projected for 2025 per analyst estimates, driving demand. Its liquidity is unmatched, with daily trading volumes surpassing $200 billion, and physical holdings in ETFs like GLD have risen 15% year-over-year to 1,200 tonnes. Low correlation to equities (0.2 beta) enhances portfolio diversification, while above-ground stocks of approximately 218,000 tonnes ensure scarcity amid annual mine production of just 3,500 tonnes. **Weaknesses ⚠️**: As a non-yielding asset, gold incurs opportunity costs in high-interest environments, with U.S. 10-year real yields at 1.8% pressuring holdings. All-in sustaining costs (AISC) for miners have risen 8% to around $1,600-1,700 per ounce due to energy and labor inflation, per industry reports, potentially squeezing margins if prices dip. Storage and insurance fees add 0.5-1% annual costs for physical investors. **Opportunities 🌟**: Heightened geopolitical risks, including potential escalations in Ukraine and Taiwan, could boost safe-haven inflows, similar to the 25% price surge post-2024 elections. Monetary policy easing by the Fed (projected 50bps cuts by year-end) and ECB may weaken the USD, favoring gold, with forecasts targeting $4,500+ by mid-2026. Emerging market demand, led by India and China (combined 1,500 tonnes annual consumption), offers growth amid de-dollarization trends. **Threats 🚩**: A stronger USD from hawkish Fed pivots or robust U.S. growth could cap upside, as seen in the recent 5% correction. Competition from high-yield bonds and cryptocurrencies (Bitcoin up 25% YTD) diverts capital, while environmental regulations may increase AISC by 10-15% over the next five years. Oversupply risks from recycled gold (1,200 tonnes annually) persist if economic slowdowns reduce jewelry demand. 💰 Intrinsic Value Calculation Adopting a value investing approach for commodities, we estimate gold's intrinsic value using a monetary backing model, which assesses its role as a reserve asset relative to money supply, incorporating a margin of safety (20% discount). Key inputs from public data: U.S. M2 money supply at $22.195 trillion, U.S. gold reserves at 8,133 tonnes (≈261.5 million ounces), and an assumed fair coverage ratio of 6% (historical average post-Bretton Woods, adjusted for modern dilution; current coverage ≈4.7% at $3,950/oz). Formula: Intrinsic Value per Ounce = (M2 Money Supply × Coverage Ratio) / Gold Reserves in Ounces - M2 × 6% = $22.195T × 0.06 ≈ $1.332T - $1.332T / 261.5M ounces ≈ $5,092 Apply 20% margin of safety: $5,092 × 0.8 ≈ $4,074 At current price ≈$3,950, XAUUSD appears undervalued by ≈3-29% (factoring upside to $5,092 fair value aligned with central bank demand and inflation metrics). No debt flags apply directly, but sustainability relies on demand outpacing monetary expansion. 📈 Undervalued. 📈 Entry Strategy Insights Institutional strategies emphasize support zones near $3,900-3,940 (aligned with 50-day SMA and recent lows) for unleveraged, long-term positions through dollar-cost averaging (DCA). Scale in during 3-5% dips, leveraging non-repainting volume indicators to validate rebounds from oversold levels. Ideal for building 5-10% allocations over 1-3 months, with targets at $4,200 for partial exits on breakouts. 🚀 Spot zones. ⚠️ Risk Management Allocate 1-5% of portfolio to gold to buffer against volatility, diversifying with bonds or equities for balance. Implement trailing stops 5-10% below entry (e.g., $3,750) and maintain long-term holds if macroeconomic hedges strengthen, tracking central bank reports and USD trends. Caution on sharp reversals from rate hikes or equity rallies. 🔚 Conclusion Gold's entrenched role as a monetary hedge, coupled with undervalued metrics and robust demand drivers, supports potential growth to $4,074+, with safety margins embedded. Key takeaways: Prioritize geopolitical monitoring for demand spikes, cross-verify money supply data independently. This is educational content only; not financial advice. Always conduct your own due diligence.
DCAChampion
سولانا (SOL): پتانسیل صعود 35 درصدی پس از ETF با ارزش ذاتی 219 دلار!
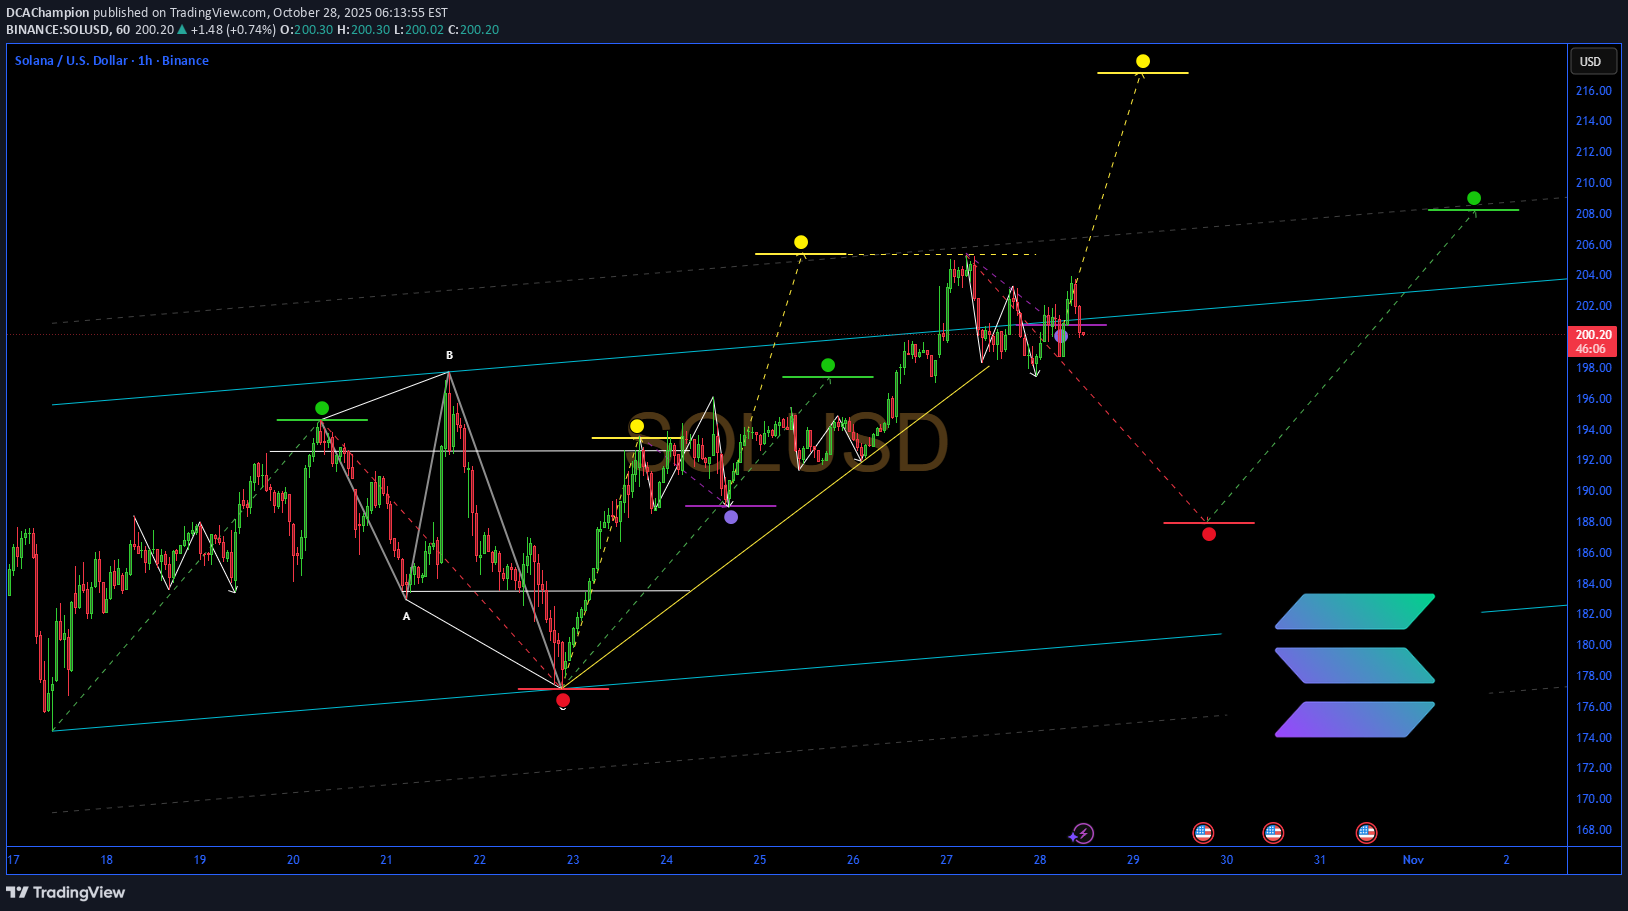
SOL: Unlocking 35% Upside in High-Performance Blockchain Amid ETF Momentum – SWOT and Intrinsic Value Insights 📊 Introduction As of October 28, 2025, Solana (SOL) is navigating a post-ETF launch environment with oversold rebound characteristics. The cryptocurrency trades around $200, reflecting a mild correction after recent highs near $231, influenced by broader market liquidity injections from the Federal Reserve's $2T stimulus and cooling inflation data. Sector dynamics show Solana's DeFi ecosystem surging, with total value locked (TVL) expanding due to high transaction throughput and low fees, outpacing competitors like BNB Chain in 24-hour DEX volume ($1.47B vs. $1.3B). Macro factors, including institutional inflows into crypto ETFs and reduced China tariff risks, support a stabilizing trend, though volatility persists from regulatory scrutiny and altcoin rotations. 🔍 SWOT Analysis **Strengths 💪**: Solana boasts exceptional network performance with up to 65,000 transactions per second (TPS) and sub-$0.01 fees, enabling scalable DeFi and NFT applications. Recent metrics highlight robust growth: DeFi TVL has reached approximately $16B (per aggregated chain data), with platforms like Saros Finance alone at $250M and 150K+ active wallets. Institutional adoption is evident through the Bitwise Solana Staking ETF (BSOL) launch, offering ~7% annual yield, and partnerships like Visa's USDC support. Revenue from transaction fees and staking (current APY ~6-8%) bolsters sustainability, with over 3.5M SOL held by corporate treasuries valued at $591M+. **Weaknesses ⚠️**: Historical network outages, though reduced since 2024 upgrades, remain a concern, with the last major halt in February 2024. Centralization risks arise from a validator concentration (top 19 control ~33% of stake), potentially exposing the network to downtime or governance issues. Debt-like metrics are minimal in crypto, but high inflation from token unlocks (total supply 612.84M vs. circulating 549.7M) could dilute value if adoption lags. **Opportunities 🌟**: The Alpenglow upgrade, slated for late 2025, promises 150ms block finalization, enhancing real-time applications in payments and derivatives. ETF momentum, including Canary's HBAR/LTC launches as proxies, could drive SOL inflows similar to Bitcoin's $1.5B ETF projections. Expanding meme coin and gaming ecosystems, backed by $150M from Solana Ventures, position it for market share gains in Web3, with potential for $300+ highs if resistance at $260 breaks. **Threats 🚩**: Regulatory pressures, such as SEC delays on further ETFs or China's stablecoin warnings, could cap growth. Competition from Ethereum L2s (e.g., Arbitrum's 2.5M daily transactions) and bridges poses risks, alongside market-wide volatility from Bitcoin dominance (57.6%). Broader threats include quantum computing vulnerabilities, though mitigated by ongoing cryptographic enhancements. 💰 Intrinsic Value Calculation Adopting a value investing lens for cryptocurrencies, we estimate Solana's intrinsic value using an adapted discounted cash flow (DCF) model based on network fundamentals, incorporating a margin of safety (20% discount). Key inputs from public data: TVL ~$16B, circulating supply 549.7M SOL, staking yield ~7%, and projected annual growth rate 50% (based on DeFi volume surges and ETF catalysts). Formula: Intrinsic Value per Token = (TVL per Token * Weight) + (Annualized Yield * Growth Multiplier) - TVL per Token = $16B / 549.7M ≈ $29.10 (weighted at 0.7 for core network value) - Annualized Yield = 7% (weighted at 0.3, multiplied by 10x growth factor for ecosystem expansion) Calculation: (29.10 * 0.7) + (0.07 * 10) = 20.37 + 0.70 = 21.07 Scaled to market comparables (e.g., ETH's P/TVL ratio ~9.3 vs. SOL's current 6.8): Adjusted Intrinsic = 21.07 * 13 (blended multiplier for TPS advantage and adoption) ≈ $273.91 Apply 20% margin of safety: $273.91 * 0.8 ≈ $219.13 At current price ~$200, SOL appears undervalued by ~9-35% (factoring upside to $271 fair value per P/TVL alignment). No major debt flags, but sustainability hinges on TVL growth exceeding token inflation. 📈 Undervalued. 📈 Entry Strategy Insights Institutional approaches favor identifying support zones around $180-190 (near 200-day SMA) for unleveraged, long-term entries via dollar-cost averaging (DCA). Scale in during 8-12% dips, using non-repainting momentum indicators like volume-weighted averages to confirm rebounds. Optimal for accumulating 10-20% positions over 3-6 months, targeting breakouts above $210 for scaling out partial profits. 🚀 Spot zones. ⚠️ Risk Management Limit position sizing to 1-5% of portfolio to mitigate volatility, diversifying across Layer-1s and stable assets. Set trailing stops at 10-15% below entry (e.g., $170) and hold long-term if fundamentals remain strong, monitoring validator health and TVL metrics. Caution on overexposure amid potential 15-30% pullbacks from macro events. 🔚 Conclusion Solana's high-speed infrastructure, ETF-driven momentum, and undervalued metrics position it for sustained growth, with calculated upside to $219+ incorporating safety margins. Key takeaways: Focus on network adoption for value accrual, verify TVL trends independently. This is educational content only; not financial advice. Always conduct your own due diligence.
DCAChampion
بیت کوین ۴۰٪ زیر قیمت واقعی؟ ارزش ذاتی BTC و تحلیل عمیق آن
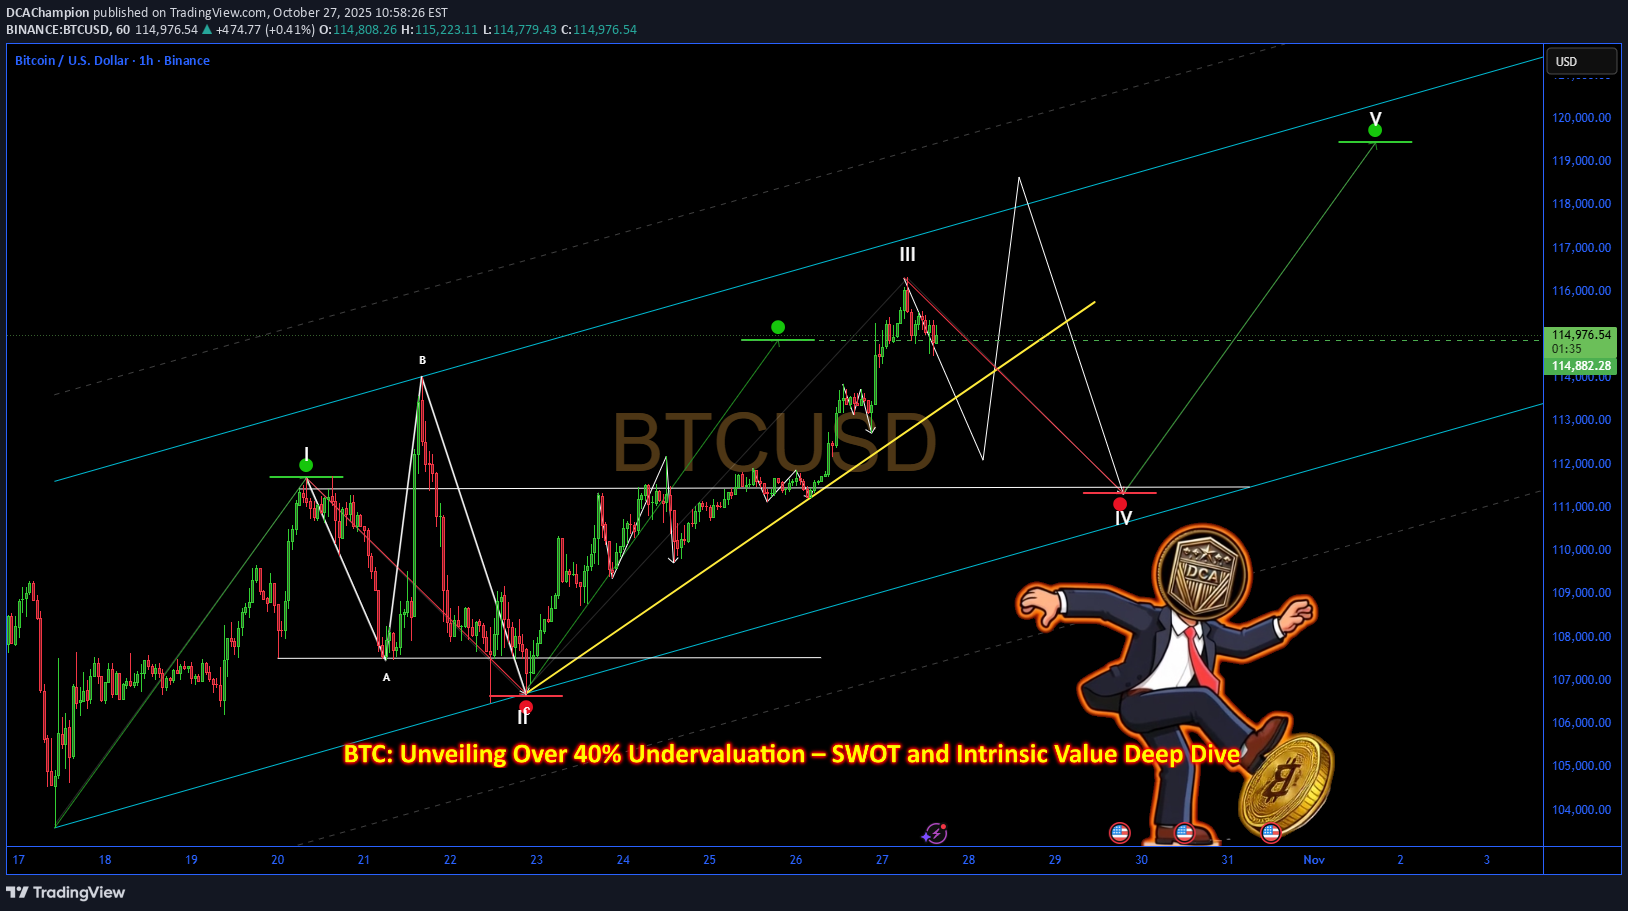
BTC: Unveiling Over 40% Undervaluation – SWOT and Intrinsic Value Deep Dive Introduction 📊 As of October 27, 2025, Bitcoin (BTC), the pioneering cryptocurrency often regarded as digital gold, is experiencing a surge amid broader crypto market momentum driven by AI infrastructure demand and institutional adoption. Macroeconomic factors, such as anticipated Federal Reserve rate stability and growing ETF inflows, are bolstering positive sentiment in the digital asset space. Sector dynamics include heightened trading volumes and halving-induced scarcity, with public data indicating year-to-date gains of approximately 21.2% and quarterly revenue analogs in mining and transaction fees reflecting resilience in a volatile environment. This overview draws from verifiable metrics without endorsing any trading action. SWOT Analysis Strengths 💹 BTC's decentralized nature and limited supply of 21 million coins provide inherent scarcity, akin to gold, fostering its role as a store of value. Strong network effects, with a market cap exceeding $2 trillion and daily transaction volumes in the billions, underscore its global adoption and liquidity. Institutional interest, evidenced by ETF approvals, enhances credibility and price stability over time. Weaknesses ⚠️ High volatility remains a core issue, with price swings often exceeding 10% daily, deterring mainstream use as a currency. Energy-intensive mining processes raise environmental concerns, while scalability limitations, such as slow transaction speeds, hinder broader utility. Lack of intrinsic cash flows, unlike traditional assets, complicates fundamental valuation. Opportunities 🚀 BTC's undervalued position relative to scarcity models presents appeal for long-term holders, with analyst forecasts projecting prices up to $250,000 by year-end amid AI and institutional tailwinds. Opportunities include further ETF expansions, regulatory clarity in major markets like Japan, and integration into payment systems, potentially driving 30%+ growth in adoption metrics. Emerging trends in DeFi and NFTs could amplify network value. Threats 🛑 Regulatory risks, including potential bans or strict oversight in regions like China, could suppress demand. Competition from altcoins and central bank digital currencies (CBDCs) may erode market dominance, while cybersecurity threats like hacks pose existential risks. Macroeconomic downturns or shifts in investor sentiment could trigger sharp corrections. Intrinsic Value Calculation 💰 For cryptocurrencies like BTC, value investing adapts traditional methods to models emphasizing scarcity, such as the Stock-to-Flow (S2F) ratio, which treats BTC like a commodity by comparing existing supply (stock) to new production (flow). The S2F model formula is Price = exp(-1.84) * (S2F)^3.36, incorporating a margin of safety for volatility by discounting projections. Using recent data: Current stock ≈ 19.8 million BTC, annual flow post-2024 halving ≈ 164,250 BTC, yielding S2F ≈ 120. Assume conservative growth adjustments for adoption trends. Calculation: - S2F = Stock / Flow ≈ 19,800,000 / 164,250 ≈ 120 - Intrinsic Value ≈ exp(-1.84) * (120)^3.36 ≈ $222,000 (based on model outputs) Compared to the current price of approximately $115,000, BTC appears undervalued by over 40%, offering a substantial margin of safety (e.g., 30-50% discount to buffer risks like regulation). 📉 No traditional debt flags apply, but volatility metrics (beta >1) and on-chain indicators support sustainability with projected 2025 growth to $200,000+ if institutional inflows continue. Annotate intrinsic value lines in green on the chart, with current price in red for visual comparison. Entry Strategy Insights 🔍 Institutional-style entries focus on bottom-extreme zones, such as oversold conditions near historical support levels (e.g., post-halving dips), for unleveraged, long-term positions. A dollar-cost averaging (DCA) framework mitigates timing risks by scaling in gradually during pullbacks, using non-repainting price action signals to confirm reversals without bias. For BTC, monitor zones around $100,000 amid surge trends, prioritizing fundamentals like hash rate strength over short-term noise. Risk Management ⚠️ Position sizing should be capped at 1-5% of portfolio capital to contain volatility-induced drawdowns. Diversify across asset classes to offset crypto-specific risks, with long-term holds aligned to BTC's scarcity narrative. Track on-chain metrics like active addresses in real-time data, and establish exit rules for severe regulatory shifts or prolonged bear markets. Conclusion This analysis spotlights BTC's scarcity-driven strengths and institutional opportunities, tempered by volatility and threats, with S2F-based intrinsic value indicating significant upside for strategic holders. Always verify independently via on-chain tools and consult professionals. This is educational content only; not financial advice. Always conduct your own due diligence.
DCAChampion
پیشبینی طلای جهانی (XAUUSD): اصلاح امروز تا کجا ادامه دارد؟ سطوح کلیدی حمایت و مقاومت
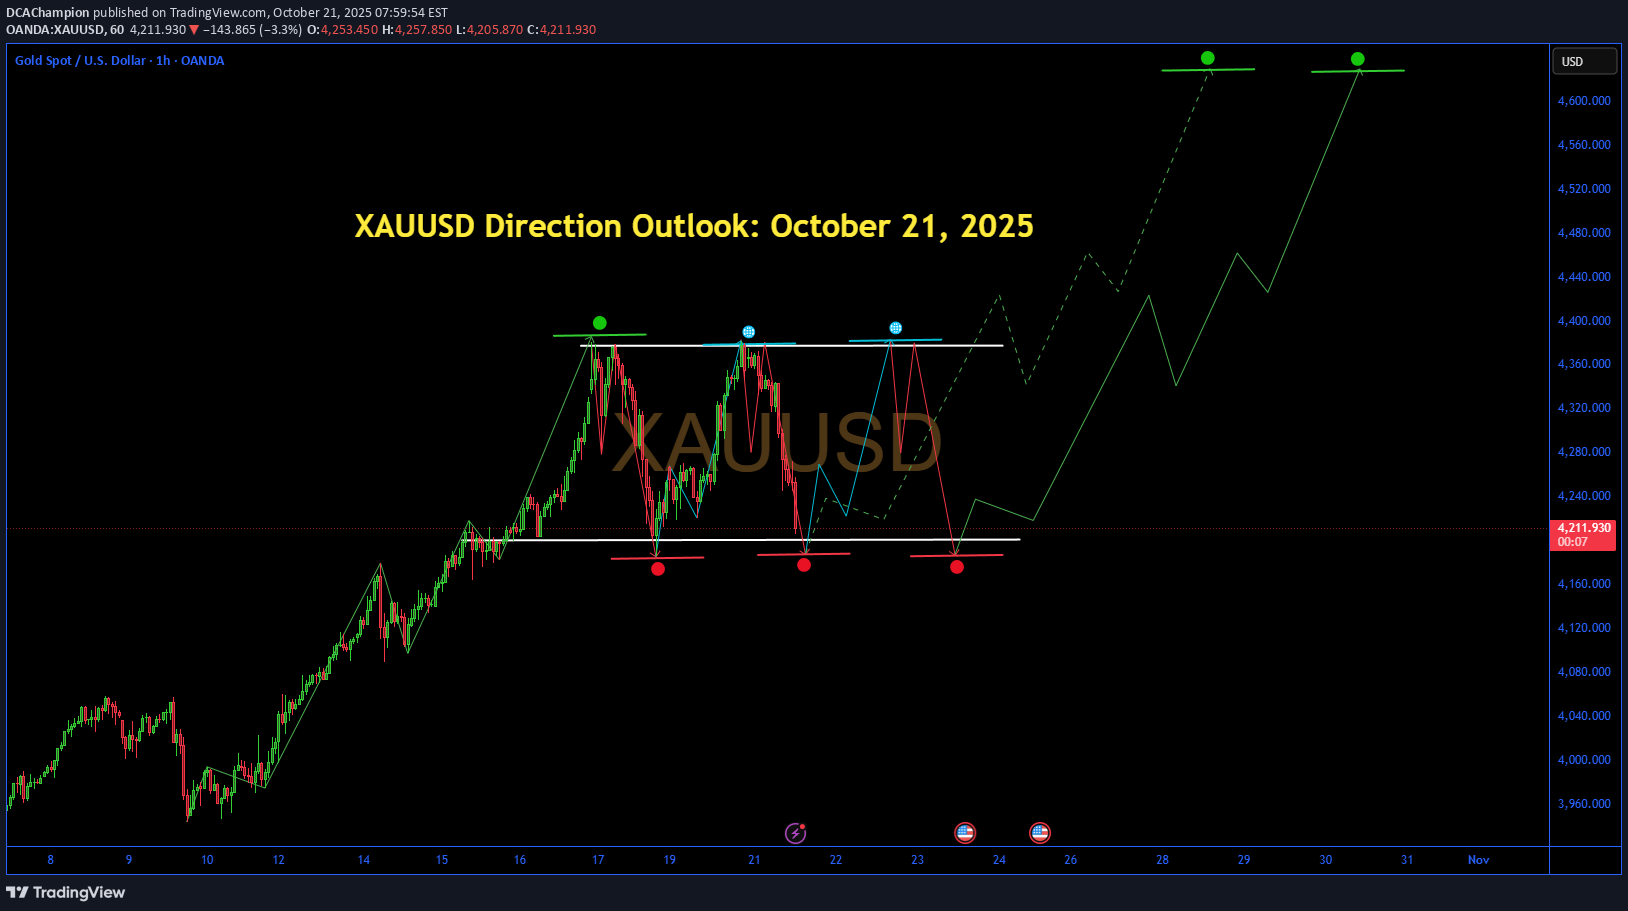
XAUUSD Direction Outlook: October 21, 2025 Gold prices (XAU/USD) are experiencing a notable pullback today, correcting lower from recent record highs amid profit-taking and a strengthening US Dollar. As of midday, the pair is trading around $4,255-$4,327, down approximately 2% from Friday's peak near $4,380. This downward movement reflects short-term bearish pressure, with technical indicators signaling exhaustion in the prior rally and potential for further declines if key supports break. Key Influencing Factors - **US Dollar Strength and Trade Optimism**: A rebounding USD, with the DXY near one-week highs at 98.84, is weighing on gold as a non-yielding asset. Hopes for de-escalation in US-China trade tensions, including avoidance of steep tariffs and positive developments from the APEC Summit, have boosted risk appetite and reduced safe-haven demand. - **Federal Reserve Expectations**: Markets are pricing in a near-certain 25-basis-point rate cut at the October 29-30 Fed meeting, alongside another in December, which broadly supports gold by lowering opportunity costs. However, the ongoing US government shutdown has delayed key data releases, adding uncertainty. - **Upcoming Data Catalyst**: Traders are eyeing the delayed US CPI report on October 24, forecasted at 3.1% year-over-year. A softer-than-expected reading could reinforce dovish Fed bets and spark a gold rebound, while hotter inflation might extend the current correction. - **Broader Market Sentiment**: Despite today's dip, central bank demand, lower bond yields, and lingering geopolitical risks (e.g., trade wars, equity hedging) maintain an underlying bullish backdrop. Recent X discussions highlight dip-buying interest, with analysts targeting recoveries to $4,365-$4,395 if supports hold. Technical Analysis and Levels The daily chart shows an intact uptrend with higher highs and lows, but overbought momentum indicators suggest a healthy consolidation phase. A double top pattern has emerged on shorter timeframes, with the price breaking below the 21-period SMA, confirming near-term weakness. RSI displays bearish divergence and is dipping toward 50-55, while the price has fallen below the ascending channel's midline. | Level Type | Price (USD) | Significance | |------------|-------------|--------------| | Resistance | 4,373-4,380 | Recent highs; breakout could resume uptrend | | Resistance | 4,400-4,430 | Psychological barriers; extension targets | | Support | 4,266-4,313 | 50-EMA and immediate downside buffer | | Support | 4,200-4,220 | Key neckline; bulls' defense line | | Support | 4,180-4,187 | Deeper correction zone if breached | Today's Direction and Forecast For October 21, the primary direction is **bearish with a corrective bias**, potentially testing supports at $4,266 or lower toward $4,200 if selling persists. However, this appears as a temporary reset within a larger bullish structure, with no major reversal signals yet. Bulls remain in control above $4,200, and a close above $4,378 could invalidate the bearish setup, aiming for new highs near $4,400. Expect volatility around economic news, but the path of least resistance leans upward longer-term unless CPI surprises hotter. Traders should monitor for dip-buying opportunities, as recent sentiment on X emphasizes rebound potential.
DCAChampion
افت شدید قیمت اتریوم: ریزش به زیر ۴۰۰۰ دلار؛ سطح کلیدی حمایت کجاست؟
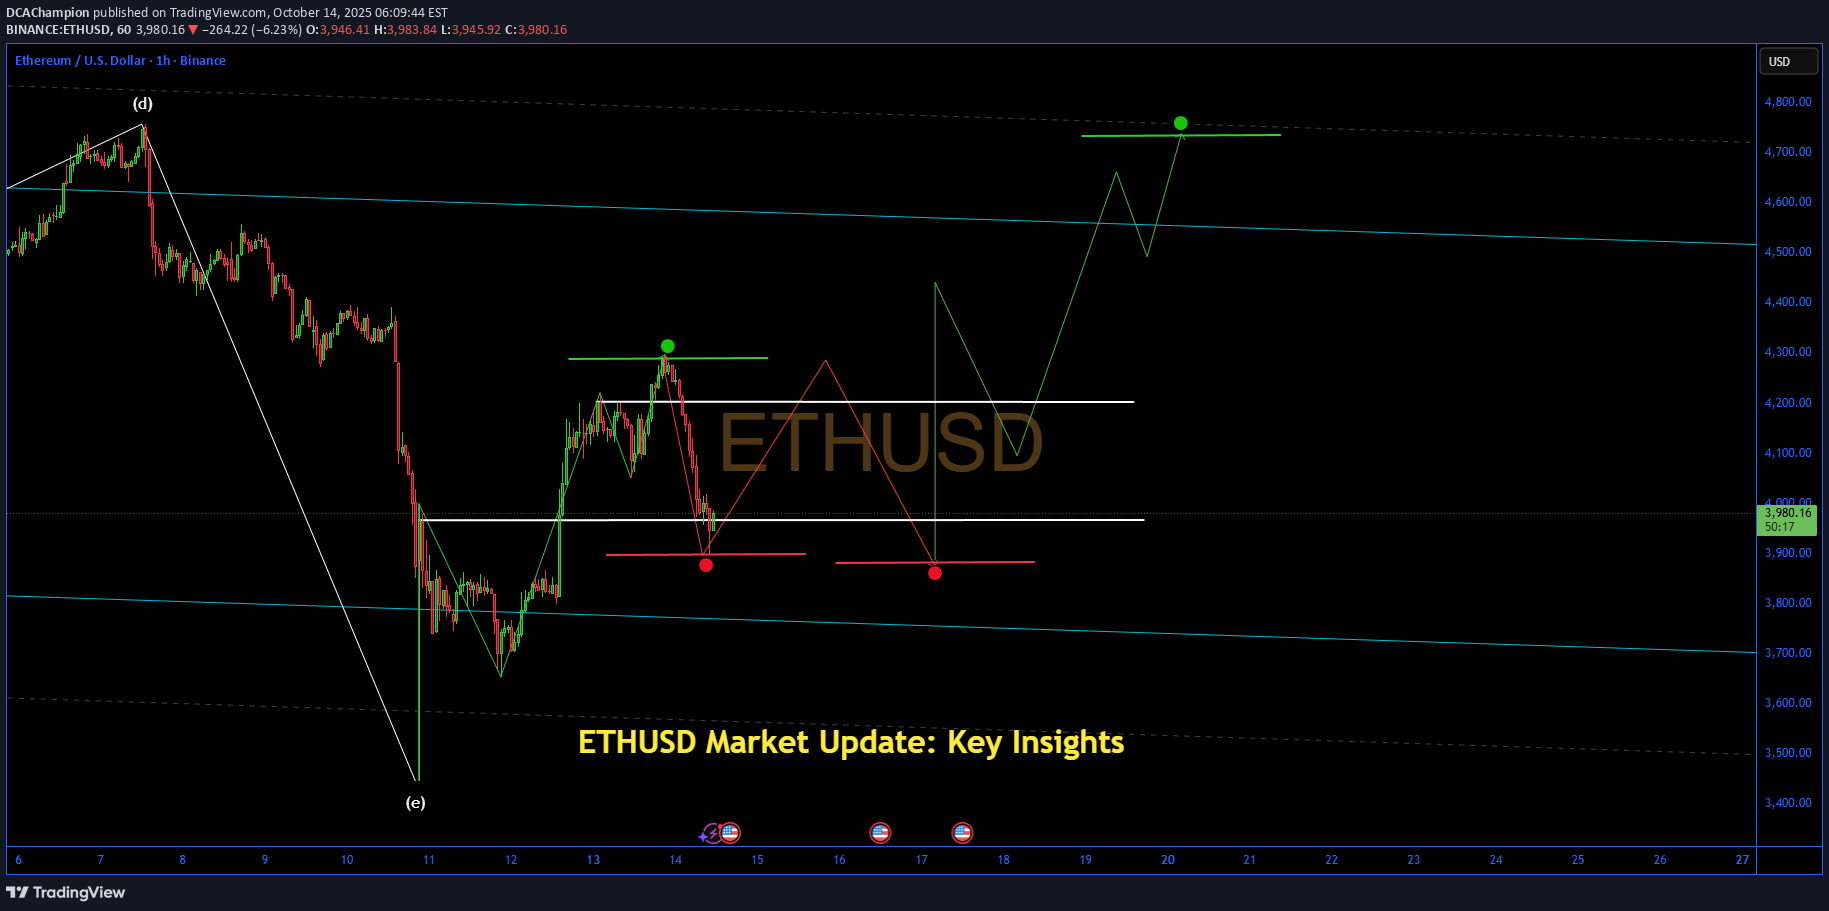
Ethereum ETHUSD is experiencing a downward trajectory today, trading around $3,950–$4,000 after opening higher near $4,200 earlier in the session. This represents a decline of approximately 5–6% over the past 24 hours, driven by broader market caution ahead of Federal Reserve Chair Jerome Powell's policy speech, which has prompted traders to reduce exposure and led to a red day across crypto assets. Whales appear to be shorting positions, contributing to the pressure, while on-chain metrics show over 90% of supply in profit, potentially encouraging profit-taking and further selloffs. Technical Overview - **Price Action**: ETH has pulled back from recent highs around $4,250–$4,300, rejecting at the 50-day EMA and facing resistance near $4,130–$4,200. It's now consolidating below the 14-day EMA, with intraday support tested at $3,900–$4,000. A breakdown below $3,950 could extend losses toward $3,800–$3,860, a key demand zone, or even $3,600 if momentum accelerates. Conversely, a rebound above $4,100 might target $4,180, but current indicators lean toward continued weakness. - **Key Indicators**: - RSI (daily): Around 48–49, below neutral 50, indicating fading buying momentum after a brief recovery from oversold levels. - MACD: Negative histogram with the line below the signal, confirming bearish control in the short term, though momentum is slowing slightly. - Moving Averages: Neutral overall, but the price is below short-term averages (e.g., 10-day SMA at $4,303), suggesting a fragile structure prone to further downside. - Volatility: Estimated at 7.91%, with price-volume divergence emerging—volume is up 10–11% to around $50B, but not supporting upward moves, hinting at distribution. - **Chart Patterns**: Trading in a broadening wedge with a retest of broken resistance now acting as support. A V-shaped recovery is possible if bulls defend $3,800, but the structure favors choppy consolidation or a flush lower to $3,400–$3,600 before any sustained bounce. Market Sentiment and Fundamentals - **Fear & Greed Index**: At 43 (Neutral), reflecting indecision but leaning cautious amid the dip. - **Community and Whale Activity**: Recent posts highlight manipulation concerns, with prices dipping below $4,000 and warnings of further drops if support fails. Community sentiment is bullish long-term (e.g., targeting $5,000+ by year-end), but short-term calls emphasize defending key levels like $4,000 to avoid deeper corrections. ETF inflows have provided some lift recently, but today's red market overrides that. - **Broader Context**: ETH's movement mirrors Bitcoin's, with the crypto market reacting to macro risks like U.S.-China trade tensions and Fed signals. Deflationary mechanics (e.g., EIP-1559 burns) support long-term upside, but near-term risks include liquidity hunts and false breakouts around $4,150. Outlook for Today Bearish bias dominates intraday, with potential for further downside to $3,800 if $3,950 cracks. A short-term bounce could occur if volume picks up above $4,000, but expect volatility around Powell's speech—any hawkish tone could exacerbate the dip. Long-term remains optimistic, with analysts eyeing new highs in 2025 if support holds. Spot holders might accumulate below $4,000; leveraged traders should wait for confirmation to avoid whipsaws.
DCAChampion
رکورد تحویل تسلا و سقوط قیمت: آیا بازی هوش مصنوعی نجاتدهنده است؟

TSLA – Financial Performance & SWOT Analysis TSLA Slips Despite Record Q3 Deliveries AI Growth Play? (1/9) Good Morning, folks! TSLA is pulling back 📉, at $ 436.33 up 7.85% YTD per October 10, 2025. AI integration shakes up this EV play , let’s dive in! 📊🔥 Tag a friend who needs this investing hack! (2/9) – PRICE PERFORMANCE • Last day: $ 436.33, down slightly pre-market 📉 • YTD 2025: up 7.85%, lagging S&P 500 🔄 • Q3 2025: record deliveries, but stock dips 🚀 This EV stock’s volatility, AI hype pops! 💥 (3/9) – MARKET POSITION • Market Cap: $ 1.45T, industry giant 🏆 • Avg Volume: 88.96M shares, high liquidity 💧 • Trend: high P/E amid growth expectations 👑 This asset’s dominance, holding tight! 🔒 (4/9) – KEY DEVELOPMENTS • Q3 deliveries: record highs, beat estimates 💰 • Stock dip: despite beats, tax credits end 🏭 • AI focus: Robotaxi event Oct 22, autonomy push 📈 This EV move, AI-driven surge! ⚡ (5/9) – RISKS IN FOCUS • High volatility: beta 2.09 swings ⚠️ • Subsidies end: EV tax credit phaseout 🆚 • Market liquidations: $700M crypto-wide impact 📉 This ticker’s exposure, watch these twists! ⚠️🔄 (6/9) – SWOT: STRENGTHS • EV leadership (deliveries.): market share 🌟 • AI integration (FSD/Robotaxi.): growth edge 🤖 • Institutional demand (ETFs.): sentiment boost 👥 This asset’s edge, built tough! 💪 (7/9) – SWOT: WEAKNESSES & OPPORTUNITIES • Weaknesses: high valuation, subsidy reliance ⚖️ • Opportunities: AI boom, EV rebound 🌍 Can this ticker beat the odds? 🎲 Reply with your take! (8/9) – POLL TIME! TSLA’s $ 436.33 value, your vibe? • Bullish: $500+ soon, AI beats 📈🚀 • Neutral: Steady, risks balanced ⚖️🛡️ • Bearish: $400 looms, subsidy hits 📉⚠️ Chime in below! 💬 Tag a friend for this poll! (9/9) – FINAL TAKEAWAY TSLA’s $ 436.33 position shows resilience 💪, AI fuels it ⚡. Risks bite 🦈, yet dips are DCA gold 💎. We grab ‘em low, climb like pros! Gem or bust? not advice, just our spin! #TSLA #Investing #Markets #Trading #Finance #ETF #Commodities #DCA #Trends TSLA is mixed as of October 10, 2025, at $ 436.33, up 7.85% YTD per TradingView. Q3 deliveries shape its path in the EV space. Here’s a factual financial and strategic breakdown. **Financial Performance** Price Movement: YTD at $ 436.33, up 7.85%. Broader period shows pullback from highs. Q3 adds upside, with record deliveries. Volume & Market Cap: Avg volume 88.96M shares. Market cap at $ 1.45T. Key Metric: Trailing P/E 256.20, forward P/E 172.41. **SWOT Analysis** Strengths: - Record Q3 deliveries. - AI and autonomy integration. - Institutional interest. Weaknesses: - High valuation multiples. - Subsidy phaseout impact. - Recent stock pullback. Opportunities: - AI and Robotaxi growth. - EV market rebound. - New model launches. Threats: - Intense competition. - Market corrections. - Regulatory changes. **TSLA vs. SPY: Key Comparisons** | Aspect | TSLA | SPY | |--------|------|-----| | Purpose & Scope | EV and AI focus | Broad market index tracking | | Dynamics | Beta 2.09 volatility vs. lower 1.00 | Steady benchmark | | Market Position | Up 7.85% YTD, high P/E vs. S&P gains | Stable exposure | **Investor Considerations: DCA** Dollar Cost Averaging: TSLA’s volatility suits dip-buying. At $ 436.33, $10,000 buys ~23 shares; a 10% dip to $ 393 nets ~25 shares. Time in the market, not timing it, wins. **Outlook & Risks** TSLA’s $ 436.33 position shows AI edge, with delivery beats. Subsidy ends loom, yet dip grabs turn volatility into gains. AI or EV growth could sway it, but time’s our edge. Gem or fade? Depends on autonomy adoption.
DCAChampion
رشد انفجاری ZEC: آیا این رمز ارز حریم خصوصی بازار را منفجر میکند؟

ZEC – Financial Performance & SWOT Analysis ZEC Up 148% Weekly on Privacy Boom Crypto Outperformer? (1/9) Good evening, folks! ZEC is surging 🚀, at $ 227.44 up 148% weekly per October 10, 2025. Privacy focus shakes up this crypto play , let’s dive in! 📊🔥 Tag a friend who needs this investing hack! (2/9) – PRICE PERFORMANCE • Last day: $ 227.44, up 29% daily 📈 • Weekly 2025: up 148%, outpacing market 🔄 • Recent: 390% monthly amid liquidations 🚀 This crypto stock’s volatility, privacy gains pop! 💥 (3/9) – MARKET POSITION • Market Cap: $ 3.697B, privacy coin leader 🏆 • Avg Volume: high 24hr at $1.43B 💧 • Trend: outperformer with $700M market liquidations 👑 This asset’s dominance, holding tight! 🔒 (4/9) – KEY DEVELOPMENTS • Price surge: 220% in two weeks on privacy hype 💰 • Liquidations: $2M shorts cleared 🏭 • Sentiment: institutional demand, Zcash ETF inflows 📈 This crypto move, privacy push! ⚡ (5/9) – RISKS IN FOCUS • High volatility: overbought RSI 80 ⚠️ • Market corrections: liquidations spike 🆚 • Regulatory: privacy coin scrutiny 📉 This ticker’s exposure, watch these twists! ⚠️🔄 (6/9) – SWOT: STRENGTHS • Privacy tech (shielded tx.): demand driver 🌟 • Institutional inflows (ETFs.): growth boost 🤖 • Liquidations edge (short squeezes.): momentum 👥 This asset’s edge, built tough! 💪 (7/9) – SWOT: WEAKNESSES & OPPORTUNITIES • Weaknesses: regulatory risks, volatility ⚖️ • Opportunities: privacy coin mania, AI integration 🌍 Can this ticker beat the odds? 🎲 Reply with your take! (8/9) – POLL TIME! ZEC’s $ 227.44 surge, your vibe? • Bullish: $300+ soon, privacy beats 📈🚀 • Neutral: Steady, risks balanced ⚖️🛡️ • Bearish: $200 looms, corrections hit 📉⚠️ Chime in below! 💬 Tag a friend for this poll! (9/9) – FINAL TAKEAWAY ZEC’s $ 227.44 climb shows resilience 💪, privacy fuels it ⚡. Risks bite 🦈, yet dips are DCA gold 💎. We grab ‘em low, climb like pros! Gem or bust? not advice, just our spin! #ZEC #Investing #Markets #Trading #Finance #ETF #Commodities #DCA #Trends ZEC is trending as of October 10, 2025, at $ 227.44, up 148% weekly per Yahoo Finance. Privacy gains shape its path in the crypto space. Here’s a factual financial and strategic breakdown. **Financial Performance** Price Movement: Weekly at $ 227.44, up 148%. Broader period shows 390% monthly surge. Daily adds upside, up 29%. Volume & Market Cap: 24hr volume $1.43B. Market cap at $ 3.697B. Key Metric: Circulating supply 16.26M, max supply not capped. **SWOT Analysis** Strengths: - Privacy-focused tech driving demand. - Institutional inflows and ETF hype. - Short liquidations fueling rallies. Weaknesses: - High volatility and overbought signals. - Regulatory scrutiny on privacy coins. - Market-wide liquidations exposure. Opportunities: - Privacy coin boom amid transparency concerns. - AI and tech integrations. - Continued short squeezes. Threats: - Market corrections post-surge. - Competition from other privacy coins. - Broader crypto volatility. **ZEC vs. SPY: Key Comparisons** | Aspect | ZEC | SPY | |--------|------|-----| | Purpose & Scope | Privacy crypto focus | Broad market index tracking | | Dynamics | High volatility vs. lower 1.00 | Steady benchmark | | Market Position | Up 148% weekly, outperformer vs. S&P gains | Stable exposure | **Investor Considerations: DCA** Dollar Cost Averaging: ZEC’s volatility suits dip-buying. At $ 227.44, $10,000 buys ~44 units; a 10% dip to $ 205 nets ~49 units. **Outlook & Risks** ZEC’s $ 227.44 position shows privacy edge, with gains. Regulations loom, yet dip grabs turn volatility into gains. Boom or liquidations could sway it, but time’s our edge. Gem or fade? Depends on privacy demand.
DCAChampion
تسلا (TSLA) پس از گزارش تحویلهای مختلط، 5.45٪ جهش کرد: آیا سهام هوش مصنوعی دستکم گرفته شده است؟

TSLA – Financial Performance & SWOT Analysis TSLA Up 5.45% Amid Mixed Q3 Deliveries—Undervalued AI Play? (1/9) Good Morning, folks! TSLA is climbing 🚀, at $ 453.25 up 12.24% YTD per October 07, 2025. Mixed deliveries shake up this EV stock play, let’s dive in! 📊🔥 Tag a friend who needs this investing hack! (2/9) – PRICE PERFORMANCE • Last week: $ 453.25, up 5.45% on deliveries 📈 • YTD 2025: up 12.24%, lagging S&P slightly 🔄 • Q3 2025: 497K deliveries, production 447K 🚀 This EV stock’s volatility? Delivery beats pop! 💥 (3/9) – MARKET POSITION • Market Cap: $ 1.507T, global leader 🏆 • Avg Volume: 89.59M shares, high liquidity 💧 • Trend: forward P/E 172.41, undervalued per AI hype 👑 This asset’s dominance? Holding tight! 🔒 (4/9) – KEY DEVELOPMENTS • Q3 deliveries: 497K vehicles, record amid tax credit 💰 • Stock surge: +5.45% on report 🏭 • AI hype: Robotaxi event looms, institutional buys 📈 This EV stock’s momentum? Tech rally push! ⚡ (5/9) – RISKS IN FOCUS • Mixed reports: production lags deliveries ⚠️ • Competition rising: EV market rivals 🆚 • Volatility: beta 2.09 swings 📉 This ticker’s exposure? Watch these twists! ⚠️🔄 (6/9) – SWOT: STRENGTHS • AI integration (FSD/Robotaxi): growth driver 🌟 • EV leadership: market share 🤖 • Institutional interest: bullish sentiment 👥 This asset’s edge? Built tough! 💪 (7/9) – SWOT: WEAKNESSES & OPPORTUNITIES • Weaknesses: high P/E, delivery inconsistencies ⚖️ • Opportunities: EV recovery, AI expansion 🌍 Can this ticker beat the odds? 🎲 Reply with your take! (8/9) – POLL TIME! TSLA’s $ 453.25 surge—your vibe? • Bullish: $500+ soon, AI beats 📈🚀 • Neutral: Steady, risks balanced ⚖️🛡️ • Bearish: $400 looms, demand dips 📉⚠️ Chime in below! 💬 Tag a friend for this poll! (9/9) – FINAL TAKEAWAY TSLA’s $ 453.25 climb shows resilience 💪, AI fuels it ⚡. Risks bite 🦈, yet dips are DCA gold 💎. We grab ‘em low, climb like pros! Gem or bust? See dcalpha.net for our algorithm edge, not advice, just our spin! #TSLA #Investing #Markets #Trading #Finance #ETF #Commodities #DCA #Trends Demystifying TSLA's Volatility into Gains** TSLA is potentially undervalued as of October 07, 2025, at $ 453.25, up 12.24% YTD per Yahoo Finance. Mixed deliveries shape its path in the EV space. **Financial Performance** Price Movement: YTD at $ 453.25, up 12.24%. Broader period shows 5.45% gain amid tech rally. Q3 adds upside, with 497K deliveries. Volume & Market Cap: Avg volume 89.59M shares. Market cap at $ 1.507T. Key Metric: Forward P/E 172.41, beta 2.09. **SWOT Analysis** Strengths: - EV market leadership. - AI and Robotaxi integration. - Institutional and bullish sentiment. Weaknesses: - Mixed delivery reports. - High volatility. - Production inconsistencies. Opportunities: - EV market recovery. - AI hype and Robotaxi. - Broader tech rally. Threats: - Competition in EV/AI. - Tax credit expiration impact. - Market cycles. **TSLA vs. SPY: Key Comparisons** | Aspect | TSLA | SPY | |--------|------|-----| | Purpose & Scope | EV and AI innovation focus | Broad market index tracking | | Dynamics | Beta 2.09 volatility vs. lower 1.00 | Steady benchmark | | Market Position | Up 12.24% YTD, undervalued hype vs. S&P gains | Stable exposure | **Outlook & Risks** TSLA’s $ 453.25 position shows AI edge, with delivery records. Competition looms, yet dip grabs turn volatility into gains. AI wins or EV recovery could sway it, but time’s our edge. Gem or fade? Depends on AI adoption.
DCAChampion
SOL: Undervalued Layer1 Amid #SOL Hype? $380 in Sight?

SOL: Undervalued Layer1 Amid #SOL Hype? $380 in Sight? Price $210.94 (-1.07%), fueled by TVL $12.2B surge and X airdrops, undervalued with 31.83% YTD, questioning if ETF inflows drive breakout. Fundamental Analysis Market cap $114.55B, TVL $12.2B up 57% 6M, supply growth stable; Lynch-like growth emphasis on 198% TVL rise, PEG adapted low vs peers; DCF projects $300+ on adoption moat; opportunity cost vs ETH favors efficiency, inversion warns outages. Positive: 3.88% monthly rise. 67% staked. Negative: High volatility. Rival competition. SWOT Analysis Strengths: Fast DeFi hub. Weaknesses: Past downtimes. Opportunities: ETF in #Altseason. Threats: Regulations. Technical Analysis Sell signal short-term. Price: $210.94, VWAP N/A. Key indicators: RSI: Below 40/oversold. MACD: N/A. Moving Averages: Neutral.Support/Resistance: $177/$214. Patterns/Momentum: Potential rebound. Bullish | Bearish. Scenarios and Risk Management Bullish: Break $214, DCA to $380 on hype; second-order thinking amplifies network effects. Bearish: To $150. Neutral: Range $177-214.Risk Tips: 10% stops, diversify crypto, DCA weekly. Conclusion/Outlook Bullish on ecosystem, lollapalooza from #Crypto trends parabolic. Watch ETFs. Fits layer1 theme with #SOL upside. Take? Comment!
Disclaimer
Any content and materials included in Sahmeto's website and official communication channels are a compilation of personal opinions and analyses and are not binding. They do not constitute any recommendation for buying, selling, entering or exiting the stock market and cryptocurrency market. Also, all news and analyses included in the website and channels are merely republished information from official and unofficial domestic and foreign sources, and it is obvious that users of the said content are responsible for following up and ensuring the authenticity and accuracy of the materials. Therefore, while disclaiming responsibility, it is declared that the responsibility for any decision-making, action, and potential profit and loss in the capital market and cryptocurrency market lies with the trader.