Technical analysis by DCAChampion about Symbol PAXG on 10/21/2025

DCAChampion
پیشبینی طلای جهانی (XAUUSD): اصلاح امروز تا کجا ادامه دارد؟ سطوح کلیدی حمایت و مقاومت
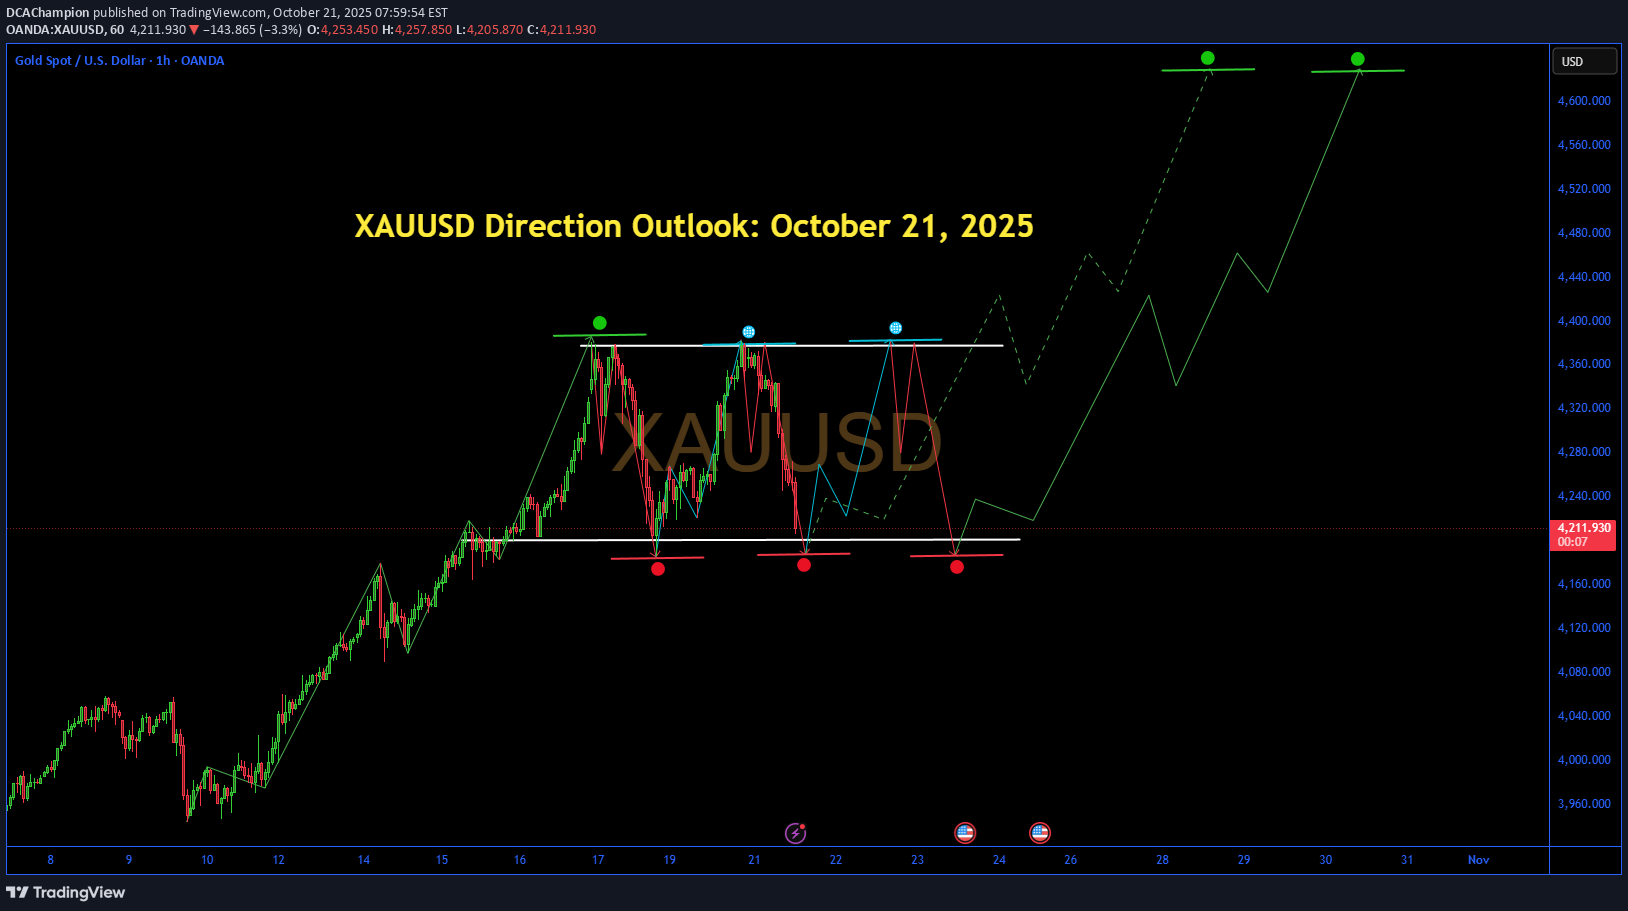
XAUUSD Direction Outlook: October 21, 2025 Gold prices (XAU/USD) are experiencing a notable pullback today, correcting lower from recent record highs amid profit-taking and a strengthening US Dollar. As of midday, the pair is trading around $4,255-$4,327, down approximately 2% from Friday's peak near $4,380. This downward movement reflects short-term bearish pressure, with technical indicators signaling exhaustion in the prior rally and potential for further declines if key supports break. Key Influencing Factors - **US Dollar Strength and Trade Optimism**: A rebounding USD, with the DXY near one-week highs at 98.84, is weighing on gold as a non-yielding asset. Hopes for de-escalation in US-China trade tensions, including avoidance of steep tariffs and positive developments from the APEC Summit, have boosted risk appetite and reduced safe-haven demand. - **Federal Reserve Expectations**: Markets are pricing in a near-certain 25-basis-point rate cut at the October 29-30 Fed meeting, alongside another in December, which broadly supports gold by lowering opportunity costs. However, the ongoing US government shutdown has delayed key data releases, adding uncertainty. - **Upcoming Data Catalyst**: Traders are eyeing the delayed US CPI report on October 24, forecasted at 3.1% year-over-year. A softer-than-expected reading could reinforce dovish Fed bets and spark a gold rebound, while hotter inflation might extend the current correction. - **Broader Market Sentiment**: Despite today's dip, central bank demand, lower bond yields, and lingering geopolitical risks (e.g., trade wars, equity hedging) maintain an underlying bullish backdrop. Recent X discussions highlight dip-buying interest, with analysts targeting recoveries to $4,365-$4,395 if supports hold. Technical Analysis and Levels The daily chart shows an intact uptrend with higher highs and lows, but overbought momentum indicators suggest a healthy consolidation phase. A double top pattern has emerged on shorter timeframes, with the price breaking below the 21-period SMA, confirming near-term weakness. RSI displays bearish divergence and is dipping toward 50-55, while the price has fallen below the ascending channel's midline. | Level Type | Price (USD) | Significance | |------------|-------------|--------------| | Resistance | 4,373-4,380 | Recent highs; breakout could resume uptrend | | Resistance | 4,400-4,430 | Psychological barriers; extension targets | | Support | 4,266-4,313 | 50-EMA and immediate downside buffer | | Support | 4,200-4,220 | Key neckline; bulls' defense line | | Support | 4,180-4,187 | Deeper correction zone if breached | Today's Direction and Forecast For October 21, the primary direction is **bearish with a corrective bias**, potentially testing supports at $4,266 or lower toward $4,200 if selling persists. However, this appears as a temporary reset within a larger bullish structure, with no major reversal signals yet. Bulls remain in control above $4,200, and a close above $4,378 could invalidate the bearish setup, aiming for new highs near $4,400. Expect volatility around economic news, but the path of least resistance leans upward longer-term unless CPI surprises hotter. Traders should monitor for dip-buying opportunities, as recent sentiment on X emphasizes rebound potential.