
Crypto_Moses
@t_Crypto_Moses

What symbols does the trader recommend buying?
Purchase History
پیام های تریدر
Filter
Crypto_Moses
TRX setting up a FOMO Scenario on Daily

Is Justin Sun setting us up for FOMO with TRX? Daily is accumulating. is it for an explosion up, or down? I have no additional information than what's portrayed in the picture. Plenty of room for MFI, break out is another tap of the upper BB Band, and momentum is clearly ready to just go up. my guess is this is a breakout trade already started but who knows. So hard to tell and our boy Justin S can stay way more solvent then you can and way longer. he can keep prices down for years if he wanted to. But, I like our chances here. SL would be a bottom bb band touch before an upper band touch. this is a spot only trade. If break out is up, people will FOMO this and they may not be wrong.
Crypto_Moses
Dog Go To The Moon
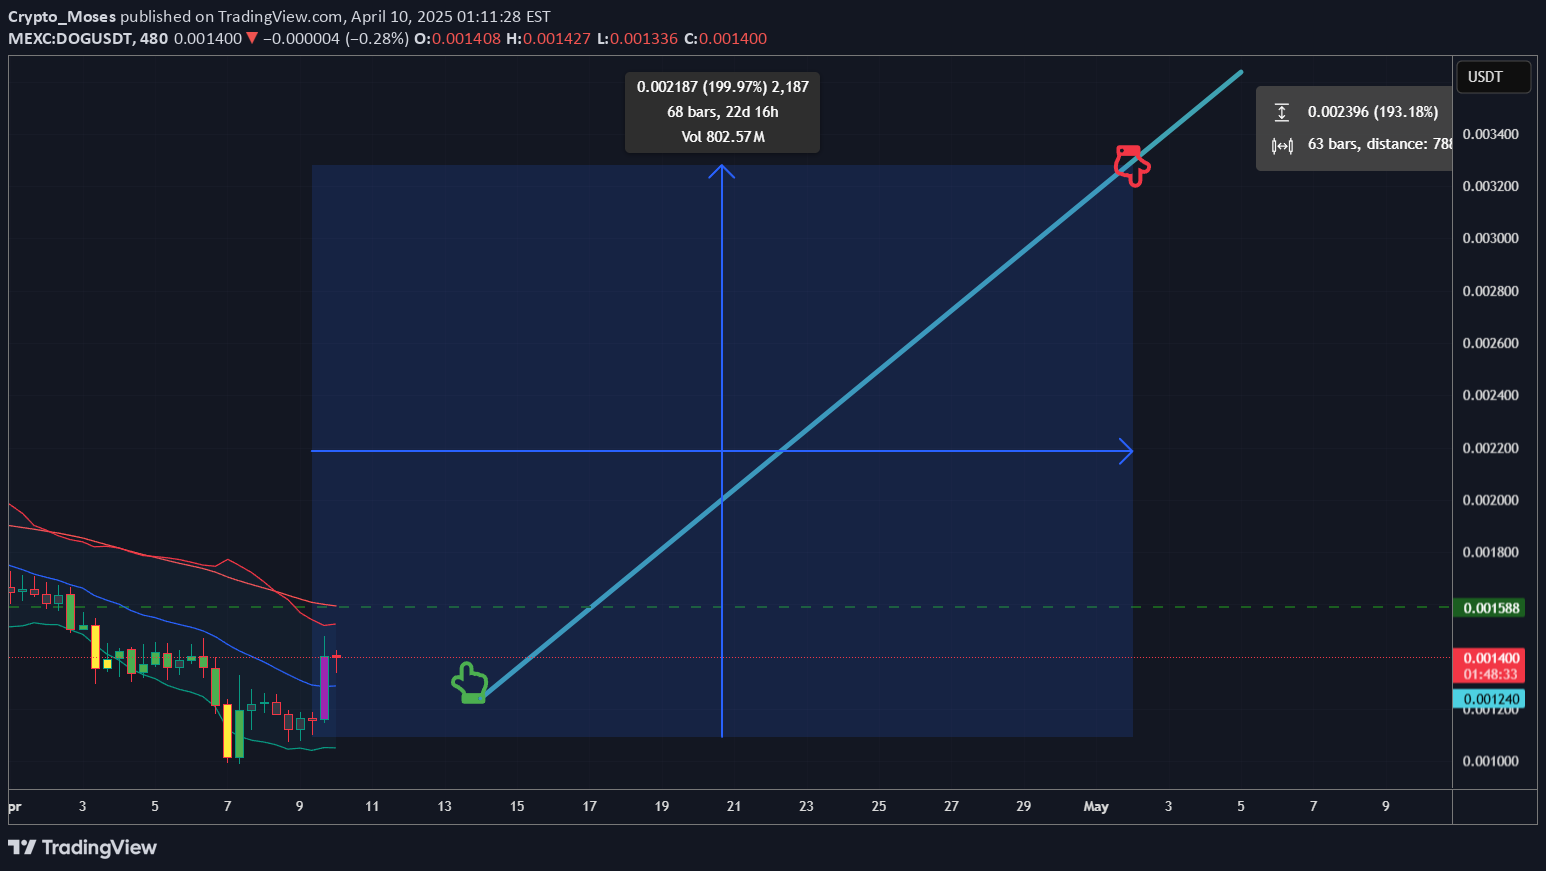
Dog is poised to recover well from the bottom. It was way over sold. At this pace it'll naturally run into the weekly basis or mid BB Band, which I estimate is around May. If you bought around the range where the buy signal is, you'll probably be all right to Hodl long term. However, without a Tier 1 listing I suspect it will continue to fully retrace. So, for now the plan is to swing this till may and reassess then. Very promising project. DOG•Go•To•The•Moon•close enough. Good job if you caught this.
Crypto_Moses
Day after Bybit Hack

Yesterday, the Bybit hack occurred, and at the time, it was the biggest hack to a crypto exchange ever. Unfortunately, the hack happened during an accumulation phase of the price range. This makes me lean towards a breakdown, due to liquidity changes being too dramatic, too fast. I’m not 100% certain, but that’s my gut feeling. I expect a breakdown to the bottom dashed line of the range in the aftermath. The default TA suggests a sideways, range-bound environment, where each attempt at the upper resistance line \ [100–101\] fails to break out, and each test of the lower support line \ [92–93\] recovers quickly. The Momentum Swing logic uses EMA crossovers, consecutive bar checks, and ATR filters to generate potential buy/sell signals, while the bar coloring is driven by Stochastic thresholds that visually indicate overbought/oversold conditions right on the candles themselves. This combination of factors implies the market is oscillating in a tight zone with frequent reversals, lacking a clear directional bias so far. Overall, the picture portrays a price range that is locked in consolidation with repeated bounces off support and rejections at resistance, and in conclusion, everything together implies the 6-hour range is likely to remain sideways unless a decisive breakout occurs above or below these established boundaries. I think the Bybit event has solidified the breakout to be down. I hope I’m wrong here because I’m holding a bag, lol.Price broke down as projected, and had a violent reaction down below. Expect the volatility it ran into to be a potential bottoming pattern.
Crypto_Moses
BTC In A Channel Within A Channel?
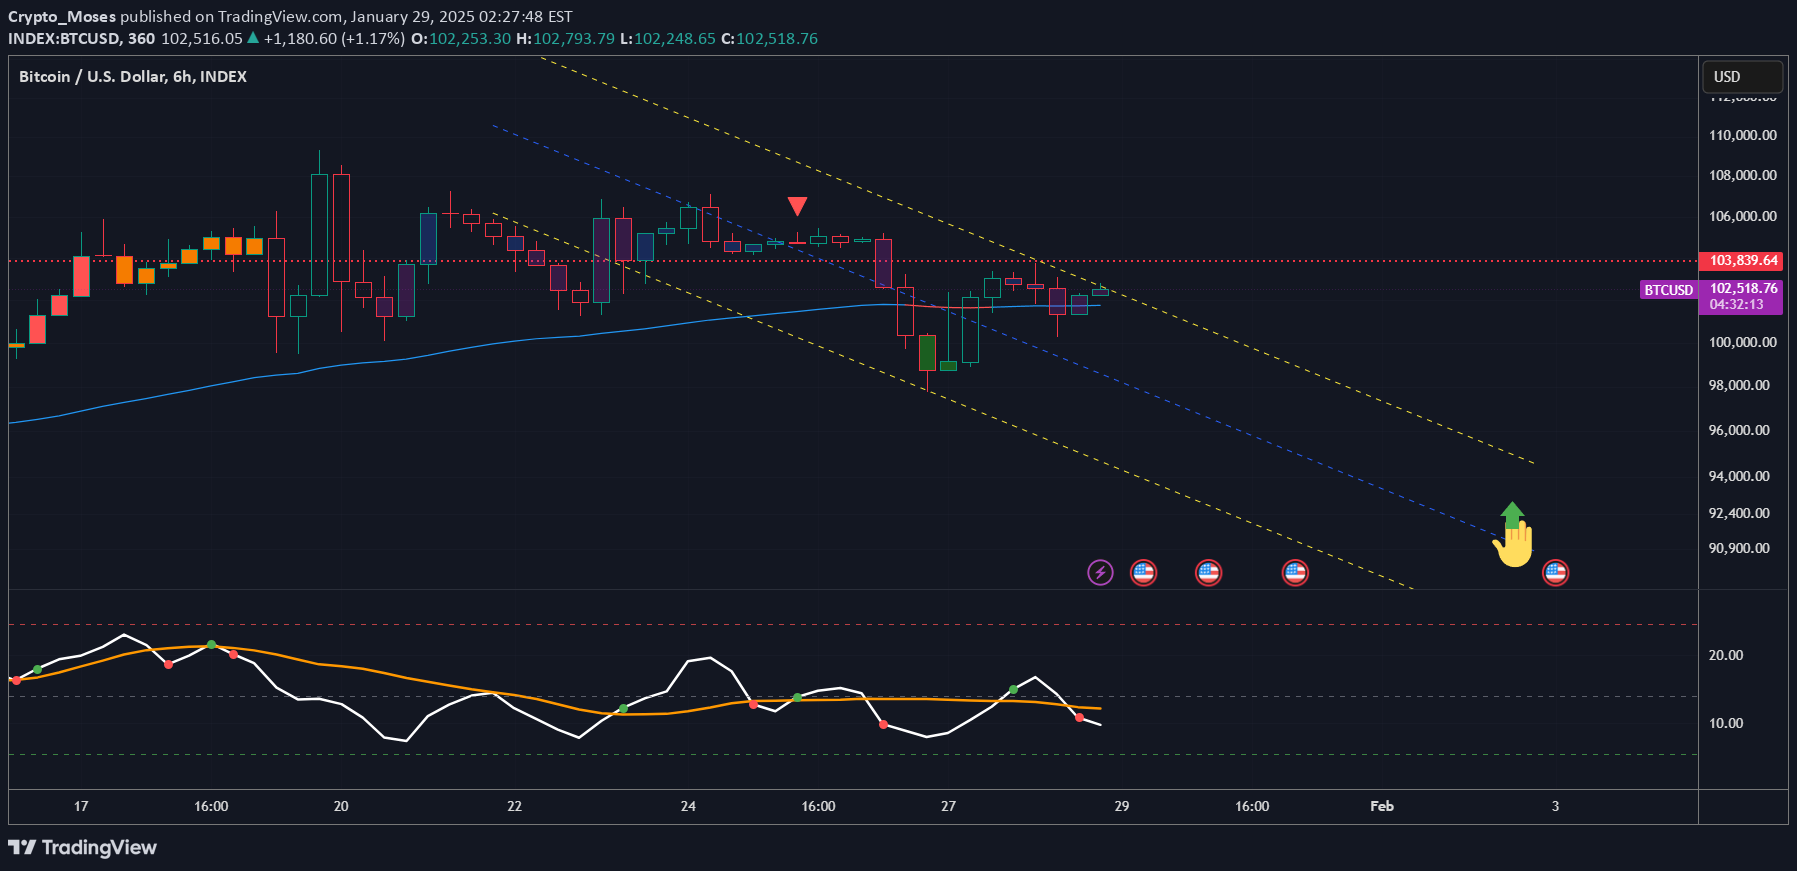
On the 6‐hour BTC/USD chart, price action has been trading within a clearly defined descending channel (shown by the dotted diagonal lines). Within this channel, we see lower highs and lower lows forming, which suggests a short‐term downtrend. Meanwhile, the blue moving average (MA) line in the middle of the chart is acting as a dynamic support/resistance zone. 1. Downward Channel: - The upper boundary (yellow dotted line) has repeatedly capped rallies. Each time price moves up to test that upper trendline, sellers have stepped in. - The lower boundary (blue dotted line) has provided support on dips, and it remains a potential bounce area if price continues to weaken. 2. Moving Average (MA) Confluence: - The MA (in blue) is slightly above current price, indicating that short‐term momentum is somewhat bearish. If price can break and hold above this MA, we could see bullish momentum return. - Conversely, failing to break above the MA may lead to further downside toward the lower channel boundary. 3. Support and Resistance Zones: - Horizontal Resistance: Around 103,800–105,000 (the red dotted line in the chart area) has acted as a price ceiling recently. - Horizontal Support: Near 101,000–102,000 (just under the current price) could provide a short‐term floor. If that fails, the next key support zone sits around 92,000–95,000, which aligns with the lower channel boundary. Potential Scenarios 1. Bullish Breakout - Trigger: A strong 6‐hour close above the descending channel’s upper trendline and the moving average. - Upside Targets: Initially aiming for the recent local highs around 105,000, then possibly extending to 106,500–108,000. - Stop Loss Placement: Just below the channel breakout point or under a recent swing low, whichever is more comfortable for your risk tolerance. 2. Channel Continuation / Bearish Move - Trigger: Price rejects the moving average or upper boundary and fails to hold the 101,000–102,000 support. - Downside Targets: The lower channel line around 92,000–95,000. Traders may watch for a bounce here if the overall trend remains intact or if buying volume returns. - Stop Loss Placement: Just above the most recent swing high or above the upper trendline to limit loss if the market surprises to the upside. - Trend Identification: Noting the lower highs and lower lows, I see a short‐term downtrend on the 6‐hour timeframe. - Key Levels: Marking horizontal supports/resistances and channel boundaries gives me concrete areas to watch for bullish or bearish confirmations. - Risk Management: Because crypto markets can be volatile, stops placed just beyond clear technical levels help protect against false breakouts or unexpected reversals. - Trade Confirmation: I like to wait for volume and a confirmed close (e.g., a 6‐hour candle close) to confirm breakouts or breakdowns, rather than relying solely on intra‐candle wicks. Overall, BTC appears to be in a short‐term downtrend within a descending channel on this timeframe. A decisive move above the channel and the moving average could signal a bullish breakout toward 105,000+ levels, while failure to hold current support may push price down to test the lower boundary near 92,000–95,000. As always, traders should set clear profit‐taking levels and stop losses to manage risk in either scenario. (This analysis is for educational purposes only and does not constitute financial advice. Always conduct your own research and manage risk appropriately.)
Crypto_Moses
Daily Looking For a Volume Push beyond 69k

With the momentum, volume, and the Bollinger Bands across all views. This will give the most accurate picture of the situation. 1. Momentum Overview (6-Hour, Daily, and Weekly) In the 6-hour chart, we see alternating orange and red bars. This means there is short-term bullish momentum, but the volume is dropping. This shows that the market is moving up but losing strength. In the daily chart, we also see strong bullish momentum with orange bars. However, the price is near a resistance level at $68,000 to $70,000. The volume has been steady, but not increasing enough to show strong buyer control. In the weekly chart, there is strong bullish momentum, and the price is nearing the upper Bollinger Band. This shows that Bitcoin has been in recovery after a period of consolidation. The weekly trend is upward, but the closer we get to $68,000 to $70,000, the harder it might be for the price to move higher without more volume. 2. Volume Structure In the 6-hour chart, the volume is steady but declining. This shows that the push upward is losing strength in the short term. Traders may be taking profits at these levels, and without more volume, the price might consolidate or pull back. In the daily chart, the volume is steady, which confirms that there is interest from buyers, but it is not enough to break through the resistance level without some struggle. In the weekly chart, the volume has been increasing. This confirms the overall upward trend, but the volume isn’t yet high enough to suggest a major breakout through the long-term resistance. This volume pattern suggests a slow move upward, but not an explosive move yet. 3. Bollinger Bands Analysis In the 6-hour chart, the price is near the upper Bollinger Band. This suggests that the market is a bit overbought in the short term. Usually, this means the price might consolidate or pull back unless there is a volume spike. In the daily chart, the price is also near the upper Bollinger Band. This shows the market is holding its gains, but it needs more volume to break through resistance at $68,000 to $70,000. In the weekly chart, the price is testing the upper Bollinger Band, meaning the broader uptrend might need to slow down or pause unless more volume comes in to support the move. 4. Key Support and Resistance Levels The resistance across all timeframes is in the $68,000 to $70,000 range. The price is getting close to this level on all charts. To break through, there needs to be a strong increase in volume. The support is around $63,000 to $64,000. If the price pulls back, this level is likely to act as a support zone. On the weekly chart, the $60,000 level is also a strong support if the price goes lower. 5. Projection Based on All Timeframes In the short term, the 6-hour chart shows that the declining volume and price near the upper Bollinger Band suggest a pullback or consolidation to around $64,000 to $66,000. The market still has bullish momentum, but without more volume, this move might not last. In the medium term, the daily chart shows strong momentum, but without increasing volume, the price may struggle to break above $68,000. A pullback to $64,000 is possible if the market does not gain more momentum. In the long term, the weekly chart shows that the trend is still bullish, but the price is near the upper Bollinger Band. This suggests that Bitcoin could pause or consolidate before trying to move higher. The resistance at $70,000 is important. If the price breaks above, it could go toward $72,000 to $75,000. If not, the price may move back to $63,000 to $64,000. Final Conclusion The most likely near-term result is consolidation or a slight pullback to $64,000. If the price fails to break above resistance, it could drop toward $60,000. With the chart focused on the dialy and including the MFI here my bias is this: Daily Looking For a Volume Push beyond 69k or we go to middle bb band on the daily. Good luck!
Crypto_Moses
BB Band and Wedge Analysis: Trend Top?

The 12 hour has the price of bitcoin pretty much topped out (in the BB Band) at the same time it's bounced off this developing wedge pattern. A break above and out the wedge would negate the wedge and mean the uptrend is just that, a trend. However, as long as that wedge develops, and breaks down, it could be something the bears will utilize for a possible measured move down: Something to keep an eye on. Overall, it looks like price has been respecting the BB band's range for quite some time so if this time were different, it would be novel. Break down could be a grueling down trend towards lower 20 thousands level or range. Hopefully, bulls can keep it on trend or hold it sideways at worst. My bias is we're probably near topping if not topped already which means an equal and opposite trend towards a lower low than this trend's low. But, take that with a grain of salt. Bitcoin is primed.
Crypto_Moses
BTC is probably about to have a major correction

If we follow September 2019 we could see as low as 23k. The good news is the bounce will be nearly a full retrace. So long the bounce, but you can short resistnaces probably till next year. Going to be a while before it's up only again. But definitely up only from the yearly low in 2024.
Crypto_Moses
Bitcoin hitting resistance but is the correction over?

Bitcoin had its first major correction off the low from 15k, and high of 31k. The correction from 31k has been really deflating for some, but whever support is found, it's hard not to remember that BTC has pretty epic bull runs. A close above resistance which is represented by the slow moving average price is coming up on would be a huge indicator short term support has been found. This would be huge, as it could provide support to regain the 31k level. Realistically we're right back where we were in Mid March so that would be epic if that is flipped to support. Bears have to make sure resistnace works, or it could get brutal for them.
Crypto_Moses
Bounce Incoming

Nice support Range Trajectory incoming. Ideally we bounce in between the two lines below.
Crypto_Moses
Did we lose momentum for a week or two?

Got a sale signal on the 6 hour according to the Hybrid Keikin Kaufman Strategy. Zoomed out this looks right. Not sure where a local bottom would be but the 3 month trend is still up so is it time to buy the dip for a scalp at least? Sale in May and Walk away, but buy dips till it gets to may??? That's how it goes right? Right?
Disclaimer
Any content and materials included in Sahmeto's website and official communication channels are a compilation of personal opinions and analyses and are not binding. They do not constitute any recommendation for buying, selling, entering or exiting the stock market and cryptocurrency market. Also, all news and analyses included in the website and channels are merely republished information from official and unofficial domestic and foreign sources, and it is obvious that users of the said content are responsible for following up and ensuring the authenticity and accuracy of the materials. Therefore, while disclaiming responsibility, it is declared that the responsibility for any decision-making, action, and potential profit and loss in the capital market and cryptocurrency market lies with the trader.