
Crypto_Gym_Work
@t_Crypto_Gym_Work

What symbols does the trader recommend buying?
Purchase History
پیام های تریدر
Filter
Crypto_Gym_Work
اصلاح بیت کوین بهترین اتفاق ممکن بود: نقشهراه رشد ارگانیک!

Quite a week, huh guys? A new ATH — and then on Friday, a drop from $120,000 to $100,000 in just one hourly candle. But honestly, I was expecting it — and I’m glad it happened. Why? Let me explain. The market had been overheated for a long time, and it was only a matter of time before it burst. We hadn’t seen any proper corrections for months. And now, in just one day, we’ve flushed out all the gamblers (and not only them), setting the stage for true, organic growth. ⚡️ The key point is that the price had been moving inside a descending channel. At the beginning of the month, we broke structure upward and made a new ATH — then pulled back into the channel. Now, the price has broken above the upper boundary again and is trying to hold. If it succeeds, that means the previous move wasn’t just a short squeeze — it was the start of organic growth. If not, we’ll likely drop even lower than $100,000, since that would signal there’s still not enough liquidity to sustain a proper rally. During the drop, two GAPs were formed — and as you know, 99% of gaps eventually get filled. Just like the GAP near the ATH I mentioned earlier, which was fully closed at the start of the month. This time, we have a strong lower GAP at $110,340 – $102,000, and an upper one at $120,920 – $113,562 (the latter already partially closing). The liquidation map shows that the nearest cluster of liquidity is above, while below there’s almost none until around $98,000. ➡️ So right now, there are two possible paths: ✅ We close the upper GAP and continue higher, starting a new rally. ✅ We close the lower GAP, retest the bottom, collect liquidity, and then resume the rally. Either way, at this stage there are no signs that the bull market is over. Drop your trade ideas in the comments — what’s your plan for the coming days? ✍️
Crypto_Gym_Work
آیا تب مونرو (XMR) فروکش کرده؟ تحلیل تکنیکال قیمت و شانس رشد آینده!

For a long time, old tokens from the 2020–2022 cycle remained unwanted. XMR was even hit by a centralized attack this spring — quite ironic for such an anonymous and “secure” project. The price dropped sharply. But now that’s in the past, and the price has once again moved toward its five-year descending resistance. Does XMR have any real chances for growth? Let’s take a look: ➡️ Globally, the price is moving within a flag pattern, which is a neutral formation. However, the price is currently closer to the upper boundary, meaning we’re likely to see another retest. ➡️ Since December 2024, a divergence has been forming in buying volumes, showing that interest in the asset is fading despite the internet hype. ➡️ Money Flow shows an almost complete lack of new money in XMR. After the last rally, there was a massive sell-off, and now, while Bitcoin is at its peaks setting new ATHs, liquidity in XMR is in the negative zone — meaning outflows are exceeding inflows. Nevertheless, both the high- and low-timeframe structure for XMR still remain in a bullish impulse — something that very few altcoins currently maintain. ➡️ Also, during the last decline, a GAP formed between $419 and $351. And as we know, 99% of gaps eventually get filled. 📌 Conclusion: From a technical perspective, XMR remains in a bullish structure, so growth can still be expected. However, liquidity and volume analysis show decreasing interest at current levels, making upward movement increasingly difficult. That’s why I’m leaning toward a retest of the lows around $225 to collect liquidity before continuing the move. For now, I don’t see a scenario where the price can break the descending trendline and move higher toward a new ATH.
Crypto_Gym_Work

🔥 As we expected in the previous idea, after retesting the lows at the start of the week, the price reversed upward. Target #1 — to close the GAP up to $115,200. But will the price manage to close it fully, or will a reversal happen earlier? Let’s take a look at what the chart is telling us: ✅ Buying volumes are slowly growing, which means buyers are stepping in. However, overall buying volumes are still low compared to selling volumes. Once higher price levels are reached, sellers may become active and easily take back control. ✅ Since Monday, the price had been moving in a descending channel and today it broke upward with a strong impulse, which is usually a signal of a trend reversal to growth. ✅ Money Flow — an indicator showing inflows of money into the asset. Here we see a strong pump on the 1H timeframe chart, showing a sharp liquidity inflow. This is one of the key signs that the growth is supported by fresh liquidity, along with the rising buying volume. 📌 Conclusion: Right now the price growth looks organic and healthy. All metrics are in harmony with the price direction. But things can quickly change this Friday with the CPE data. The market is extremely sensitive to any negative input right now. Still, if everything continues as it is now, we could see $114,000 today or tomorrow, while $115,000 will depend on Friday’s CPE data. ✍️ Drop a comment — are you long or already shorting?
Crypto_Gym_Work

Bitcoin has started its natural correction after the sell the news on the Fed’s rate cut. Historically, all bear markets began exactly after rate cuts. But it’s too early to think about that now — the correction was long overdue. Let’s see what’s next for the price: ➡️ Today’s Tokyo session opened with a strong GAP at $115,570 – $111,870. Price reached key support at $111,848 — the previous ATH from May, making this a major level. From here, we can expect a short bounce to close that GAP. ➡️ RSI confirms this, showing oversold conditions on the 4H timeframe (27). The last time RSI hit such levels, price rallied over 11%. ➡️ On top of that, selling volumes have been decreasing since August, even though price keeps moving inside a descending channel. That means seller pressure is weakening. ➡️ Bitcoin also touched the Fibb 3 level for the first time since June 2025. Back then, it triggered a 25% rally and a new ATH. ⚡️ I’m not saying Bitcoin will set a new ATH right now, but after such a strong correction, at least a local bounce is highly likely. Price may retest today’s lows once more before moving lower — but first, I expect a rebound. Drop in the comments: what price do you expect next for Bitcoin? 🔥
Crypto_Gym_Work
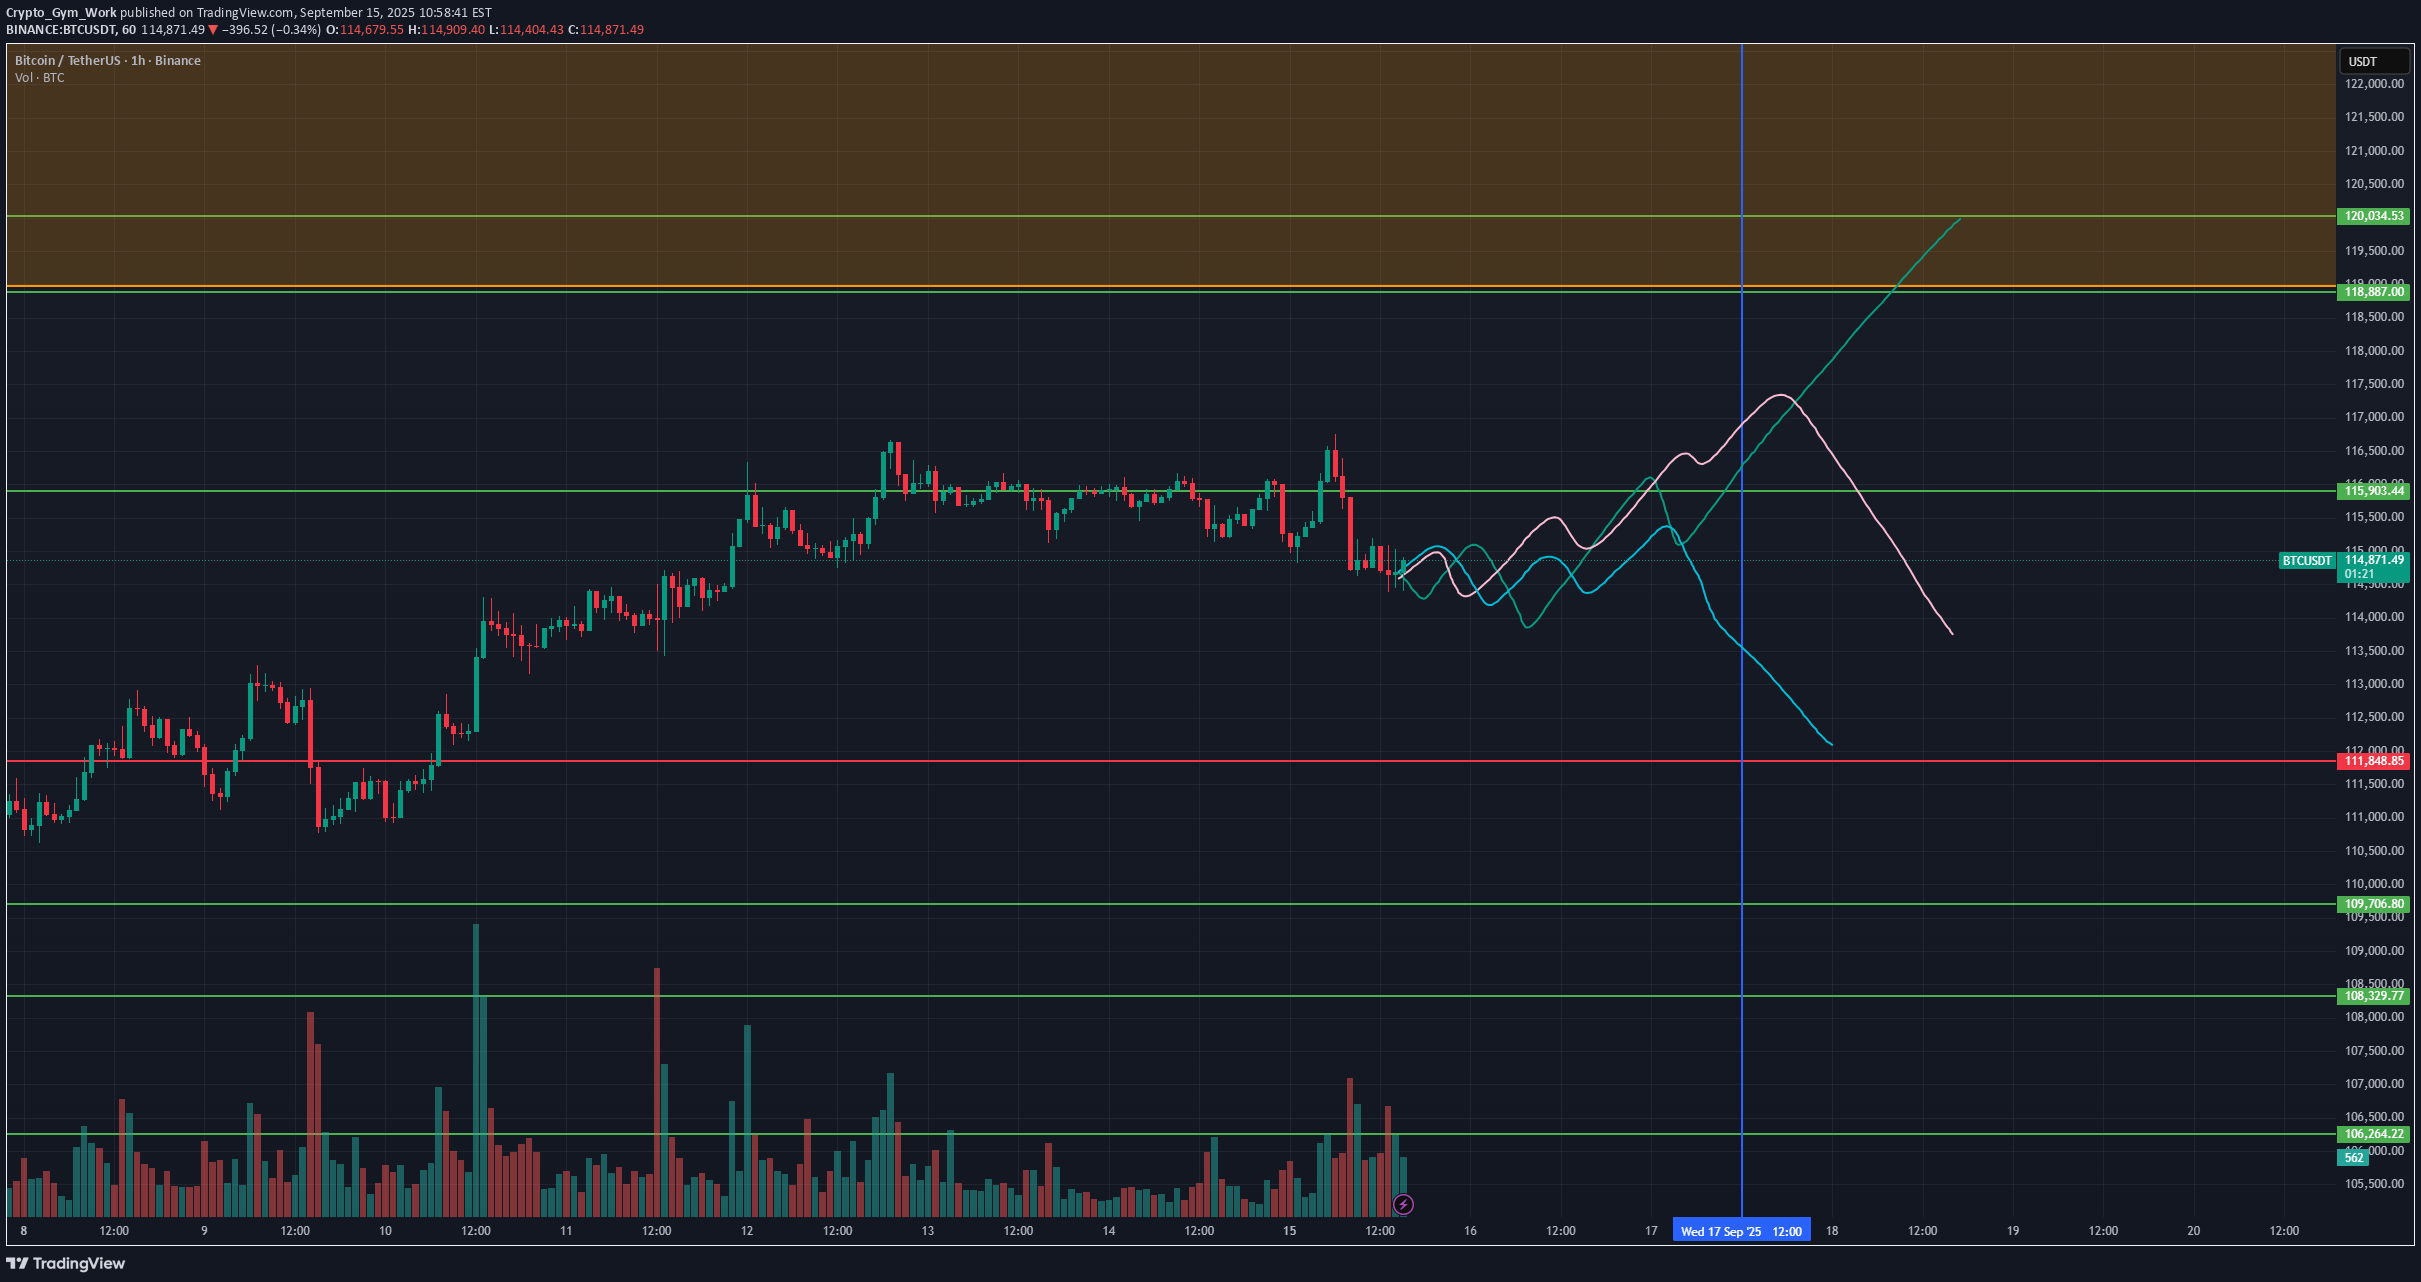
This Wednesday, September 17, we’re getting the most important event of recent (and upcoming) months — the one that will decide the direction not only for crypto but for all markets. Here’s how I see the possible outcomes: 💜 Pink scenario — the most likely We approach the meeting with positive price action → the Federal Reserve cuts rates → market spikes 1–2 candles up → then crashes hard. Bitcoin goes to retest the lows at $107,000. Why? Because this rate cut is already priced in — that’s exactly what fueled the entire rally of the past few months. Just like with the iShares Bitcoin Trust and Grayscale Ethereum Trust approvals — it’s the classic sell the news: everyone who wanted to buy has already bought, the catalyst plays out, and there’s nothing left to push price up. Also: historically, every bear market started right after the Fed cut rates. And this bull cycle is already one of the longest — almost 2 years. 💚 Green scenario — least likely We again approach with positive sentiment → the Fed cuts rates → market rallies → somehow new liquidity appears → and we go to retest the ATH. Personally, this “pink ponies” scenario seems unlikely — the market is extremely overheated, there’s been no fresh liquidity for months, and this entire rally has run on declining volume. It’s not that everyone suddenly wants crypto — it’s just that no one wants to sell. But at some point… they will. 💙 Blue scenario — plausible We approach with neutral/negative price action because insiders already know the decision and are positioning. The Fed keeps rates unchanged → the market nukes, because this was the main catalyst priced in for months. First target: $107,000, and if that breaks — $99,000 comes fast. This would likely mark the start of a new bear market. 📌 Drop a comment — which scenario do you think is coming?
Crypto_Gym_Work
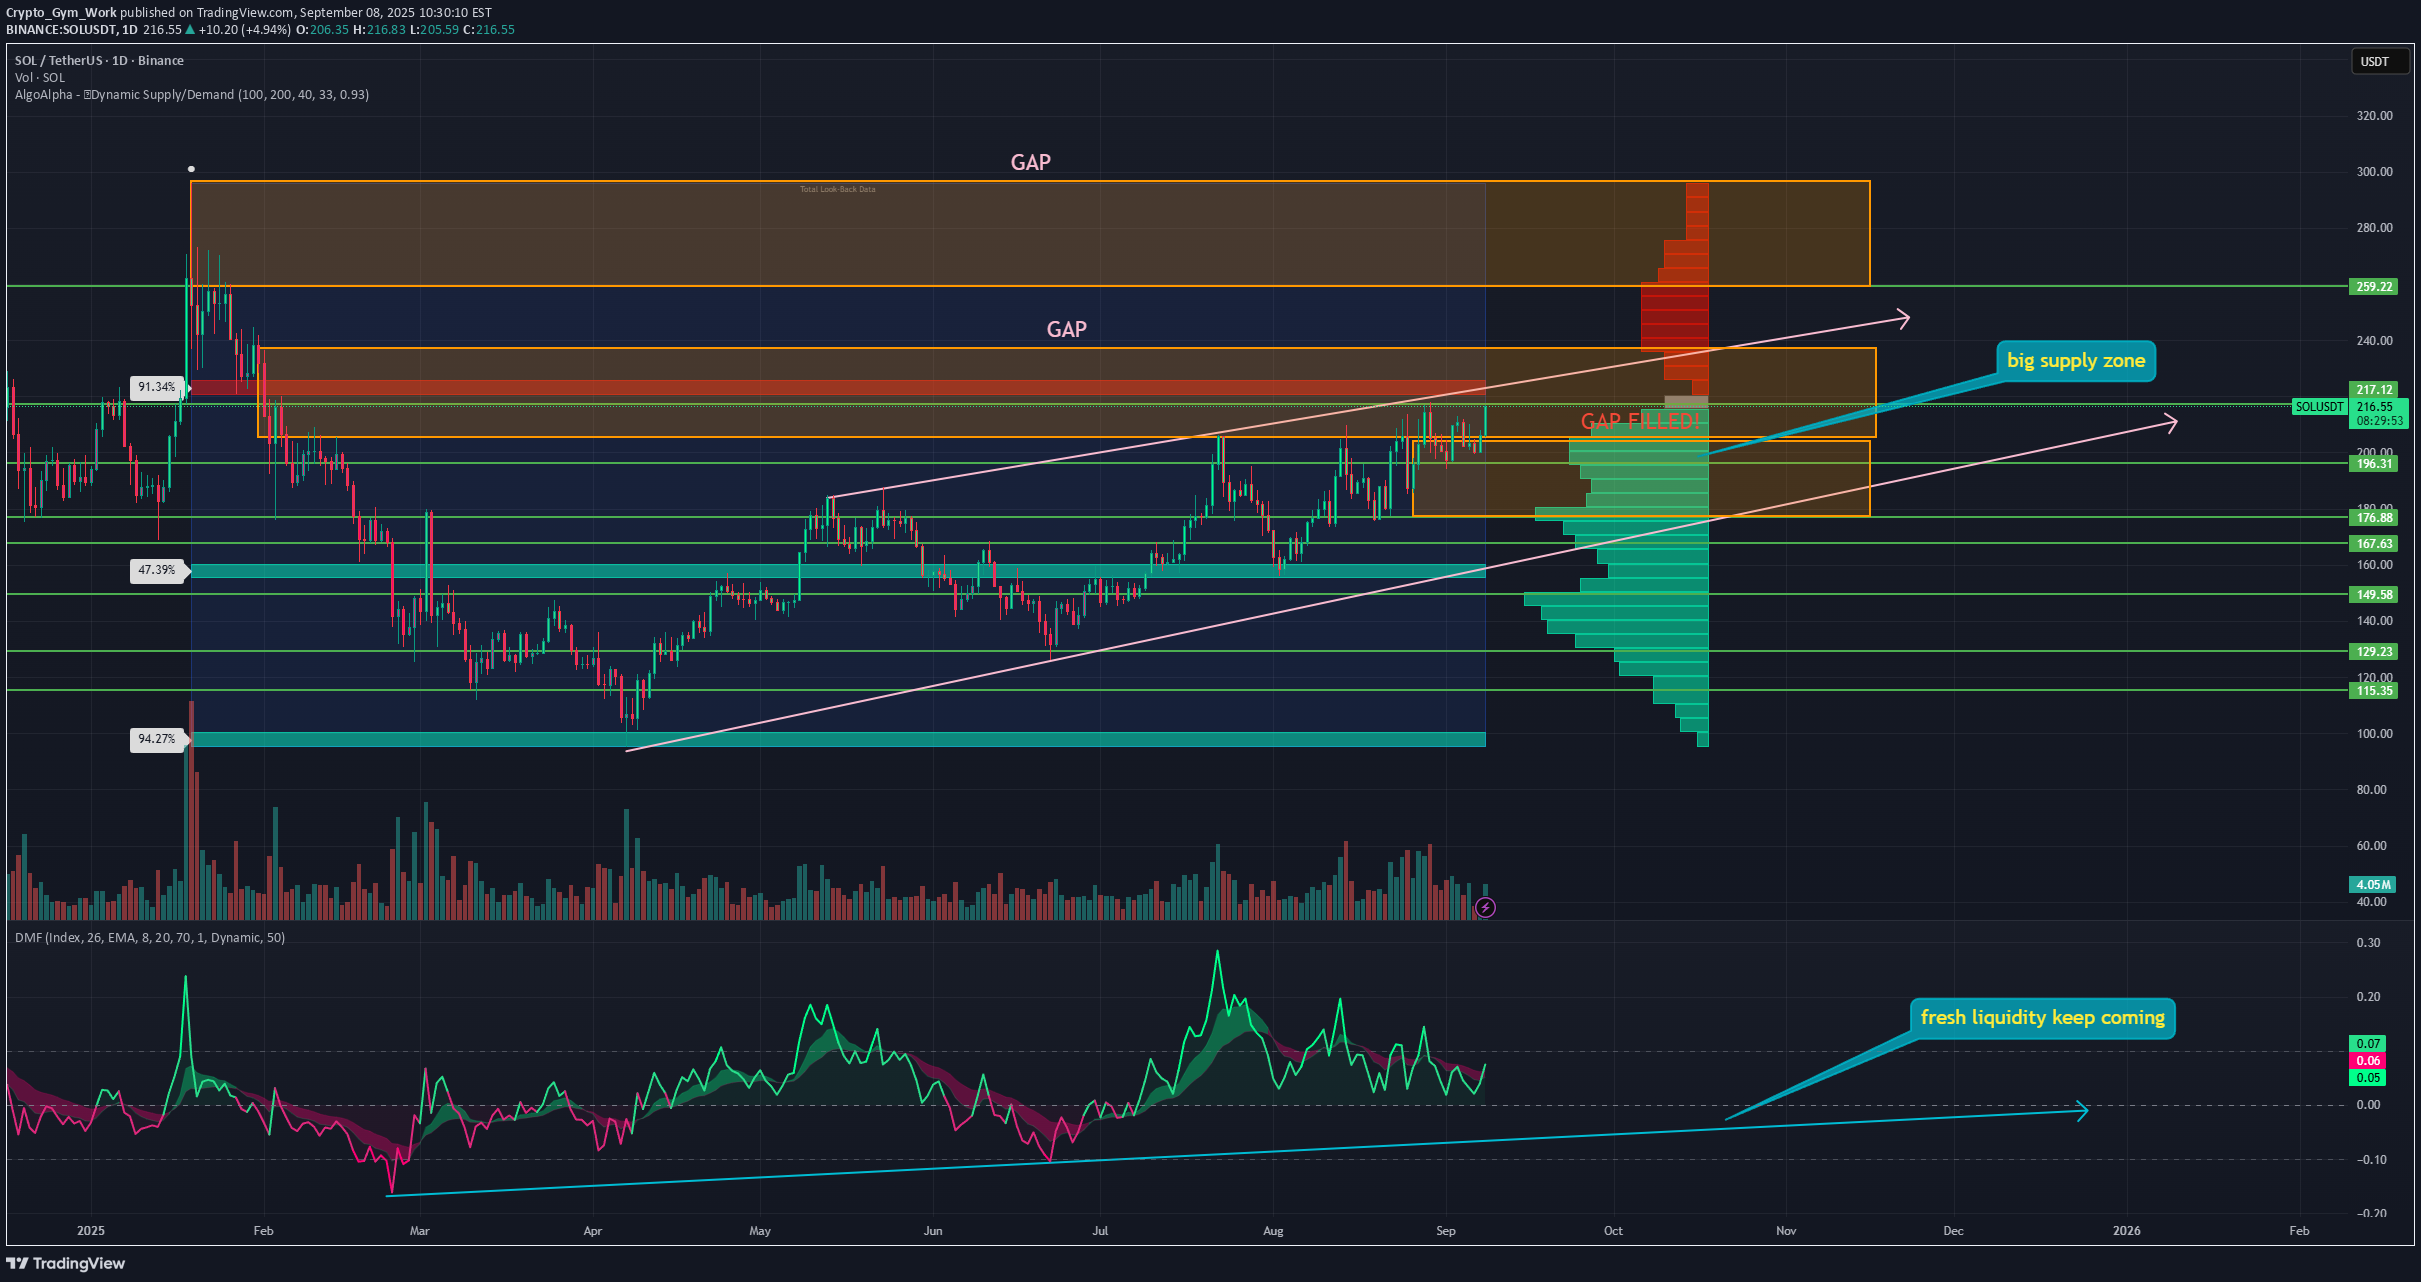
Now that liquidity is starting to flow out of overheated ETH and even trickle back into Bitcoin, the biggest winner is SOL. After pumping the first two cryptos, the market is naturally moving to the third. Don’t forget: at the moment, SOL is the only ETF alongside ETH and BTC, and the first in the world with staking. Right now, SOL is moving in an ascending channel and once again testing its upper boundary. If this historically bearish pattern breaks upward, the next target is $259 — and then ATH. And can price break higher? Yes — here’s why: ➡️ Money Flow shows liquidity continues to flow into SOL, while in other top tokens this indicator has already turned near-negative. ➡️ Supply and Demand Zones reveal massive demand forming below, likely leading to near-instant buybacks of any correction. A particularly large demand block has formed at $196–205. Plus, $200 is a strong psychological level where many traders will defend positions. ➡️ Multiple gaps above: one at $296.7–259.5, another at $237–205.7. The third was already closed at the end of August — another reminder that 99% of gaps get filled sooner or later. The key question now: can price consolidate above $217 and break the upper boundary of the channel? At this point, I’m only considering longs on SOL, even though there’s a chance of a short-term rejection at diagonal resistance. Longs simply offer far better potential and RR right now. ➡️ And most importantly — this Thursday we get U.S. CPI for the month, which will influence the Fed’s rate decision and set the tone for the entire market. Positive data could become the very catalyst that finally pushes price above resistance. 👉 Subscribe and check my profile to see more trading opportunities — straight from someone who literally works with trading platforms.
Crypto_Gym_Work
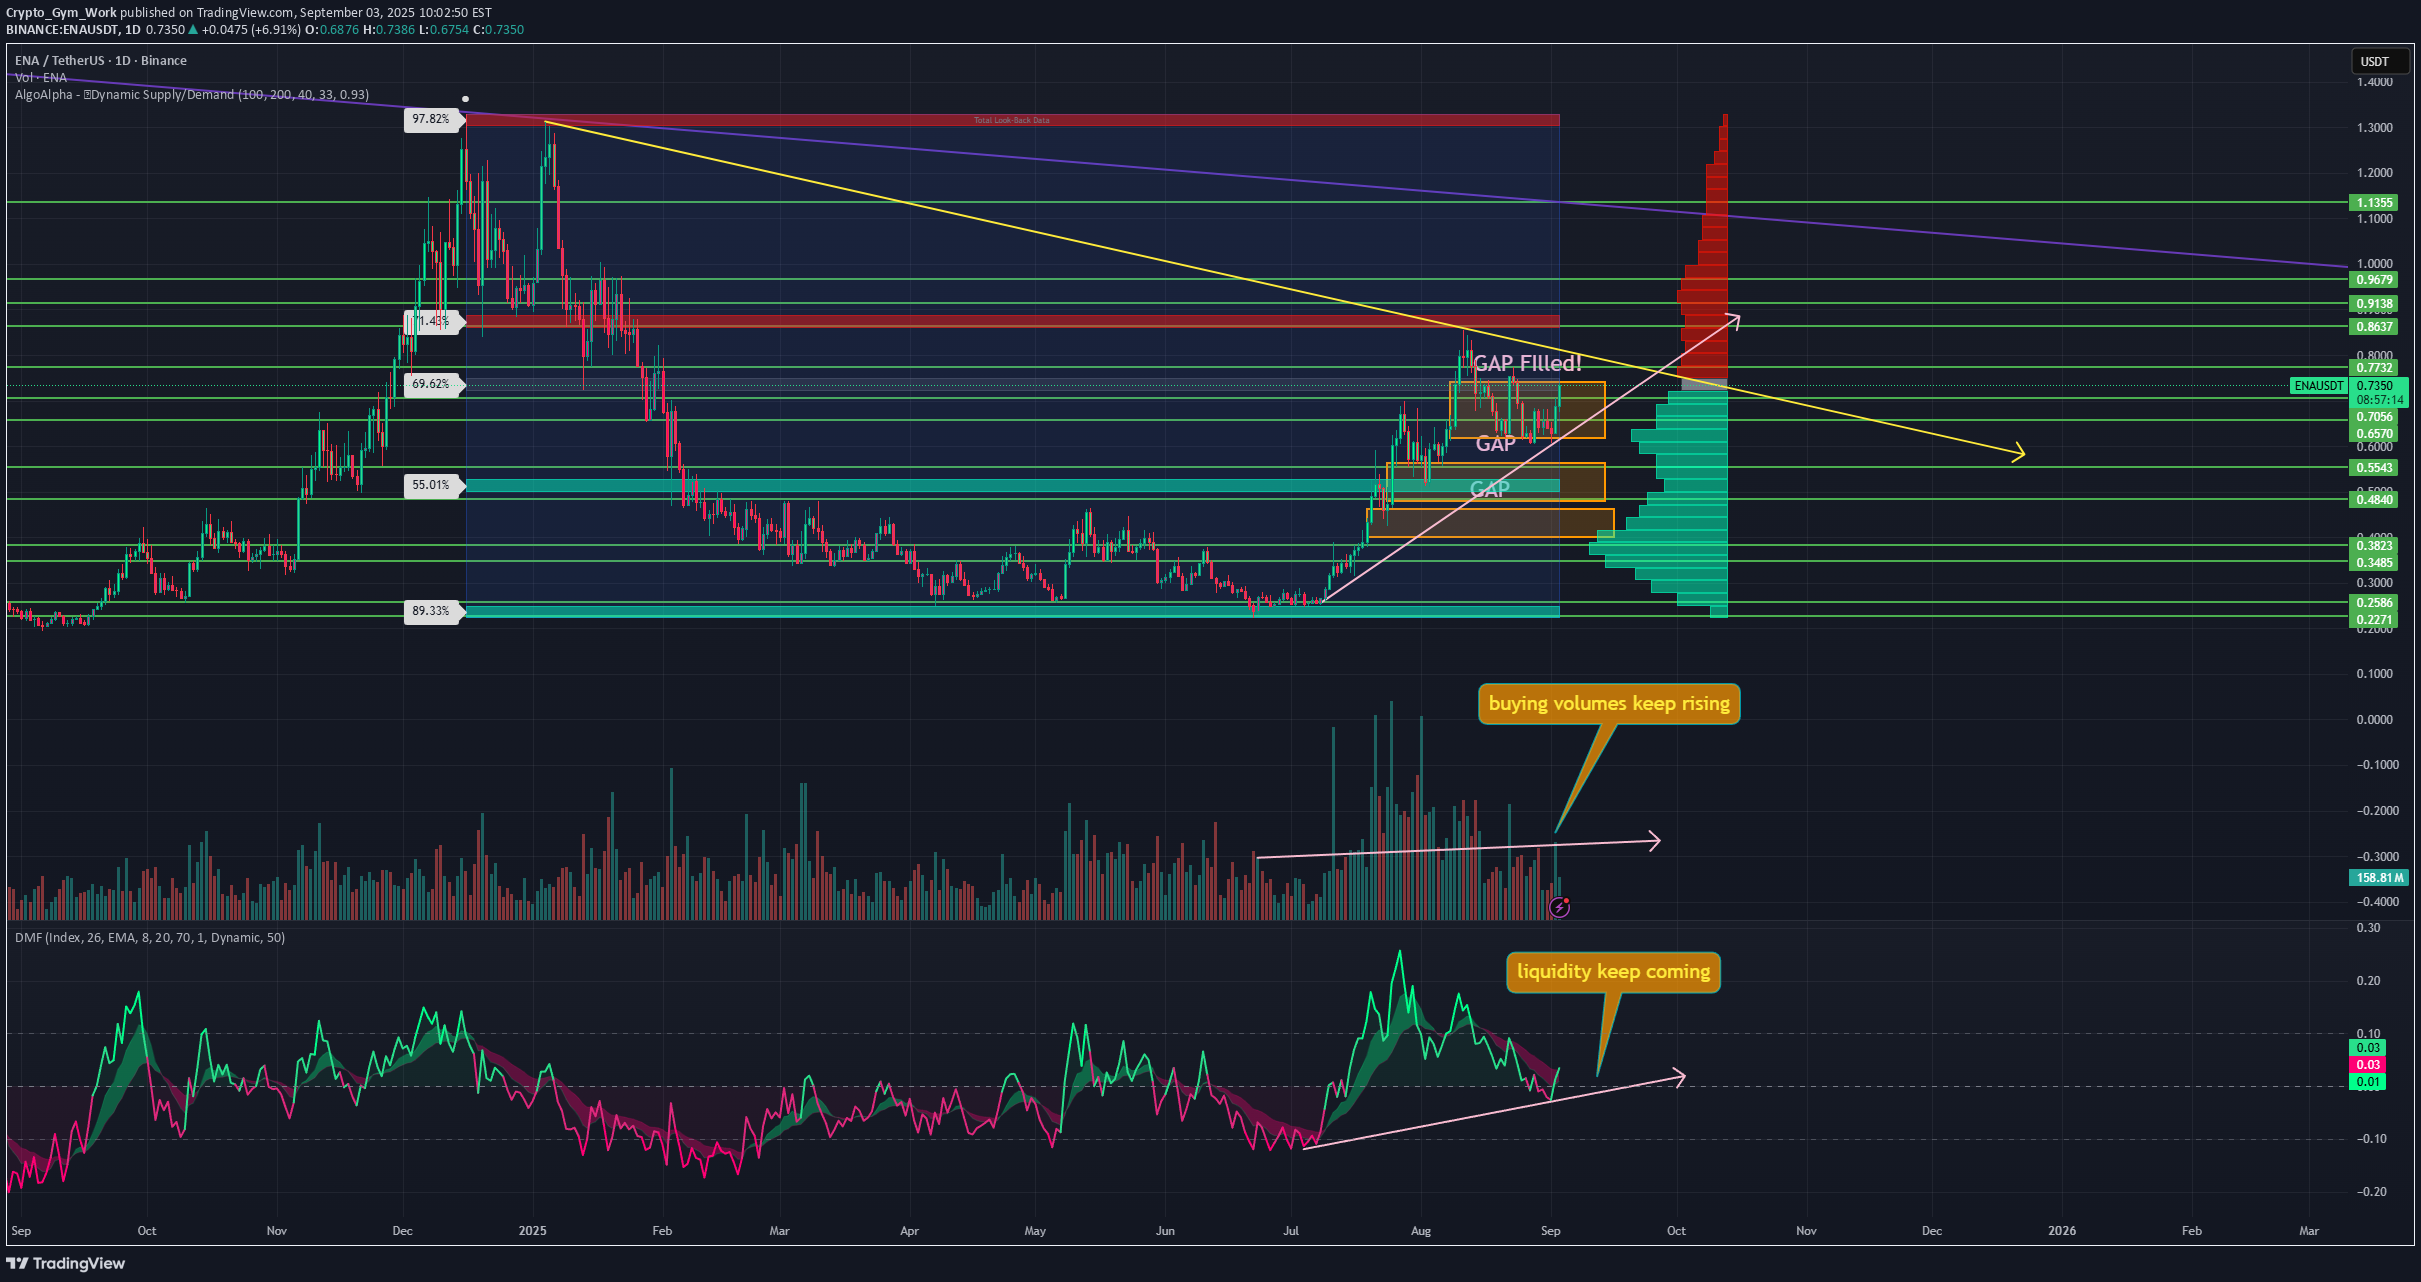
Recently, ENA closed the nearest downside gap at $0.74–0.62, which I mentioned earlier. Now the price is retesting the diagonal resistance from early August. A breakout above this could open the path toward a new ATH. ➡️ Meanwhile, buying volumes remain in harmony with price — they’re rising as the price rises, showing that interest in ENA is still growing even at these levels. ➡️ ENA is also one of the few tokens on the market right now with a positive Money Flow reading, signaling ongoing liquidity inflows. For comparison, ETH and BTC are already in negative territory. ➡️ However, two gaps remain below: $0.56–0.48 and $0.46–0.40. And as you’ve already seen many times, gaps tend to close reliably. ➡️ At the same time, the Supply and Demand Zones indicator shows massive demand for ENA at current levels and lower, while supply is almost nonexistent right now. In other words, there are hardly any sellers — but plenty of buyers. 📌 Conclusion: ENA continues to look highly attractive for long trades. If it can break through the diagonal resistance, I’ll personally be looking for a swing trade, with a plan to target at least a retest of $1.
Crypto_Gym_Work

The ETH hype is slowly fading as the price struggles to break ATH. It’s always the same: at $4,500 it’s “the technology of the future,” at $1,400 it’s “useless garbage.” Over the past week, SOL has looked stronger than the market, taking the smallest hit from correction. Now, price is trying to hold above the key psychological level of $200. If it manages to consolidate above — the path to ATH opens up. ➡️ Above, movement will be easier: there are two gaps from the last correction at $206–237 and $259–296. And as we know, gaps get closed 99% of the time. ➡️ Money Flow — liquidity inflows continue even during correction. While ETH and BTC have already dipped into negative territory, SOL is still in positive, signaling investor interest. ➡️ On the flip side, there’s a divergence in buying volumes, seen across the entire market, pointing to weakening overall interest. ➡️ Also, SOL is trading inside an ascending channel, which after a correction is typically a bearish signal — often leading to a breakdown. To get back to a proper uptrend, the price needs to break above the channel’s upper boundary, which it’s already tested four times, getting closer each time. 📌 Conclusion: While everyone’s been watching ETH, institutions have already started accumulating SOL, and the world’s first SOL staking ETF has launched. Now, with ETH’s rally seemingly over, retail traders’ attention is shifting to SOL. But to confirm a run toward ATH — the key is holding above $200. That’s the level to watch right now.
Crypto_Gym_Work

Many on Twitter are already calling for a bear cycle and a -50% correction. Inflation data looks bad, everything looks grim. And as someone naturally leaning bearish, I can only laugh at this. ➡️ From a technical standpoint, ETH is still in a bullish impulse and hasn’t even entered distribution yet. Here’s what to pay attention to: 1️⃣ ETH is still trading above both 5-year descending resistances. Both are now just below $4,000. As long as ETH stays above them — and especially if it closes the monthly candle above — this is a confirmed breakout. 2️⃣ ETH hasn’t even retested its trendline support from this impulse, which has been forming since June. How price reacts when it touches that support will be the first real signal to watch. 3️⃣ Buying volume is diverging from price action. Price is rising, but volumes are falling. This signals declining interest in ETH. Of course interest is fading — ETH has been climbing nonstop since April, already up over 250%. There are simply no buyers left at these levels. 4️⃣ What’s important is that the Money Flow indicator, which shows liquidity inflows, suggests there’s still no outflow from ETH. The balance is currently in a neutral zone. 5️⃣ And it’s impossible to ignore that two gaps have formed below: $4,178 – $3,619 $3,413 – $2,972 And as we know, gaps get filled in 99% of cases. 📌 Conclusion: ETH is clearly approaching a crossroads where the next major direction will be decided. But right now there’s absolutely no reason for panic. The key thing to watch is how price reacts when it touches the trendline support.
Crypto_Gym_Work
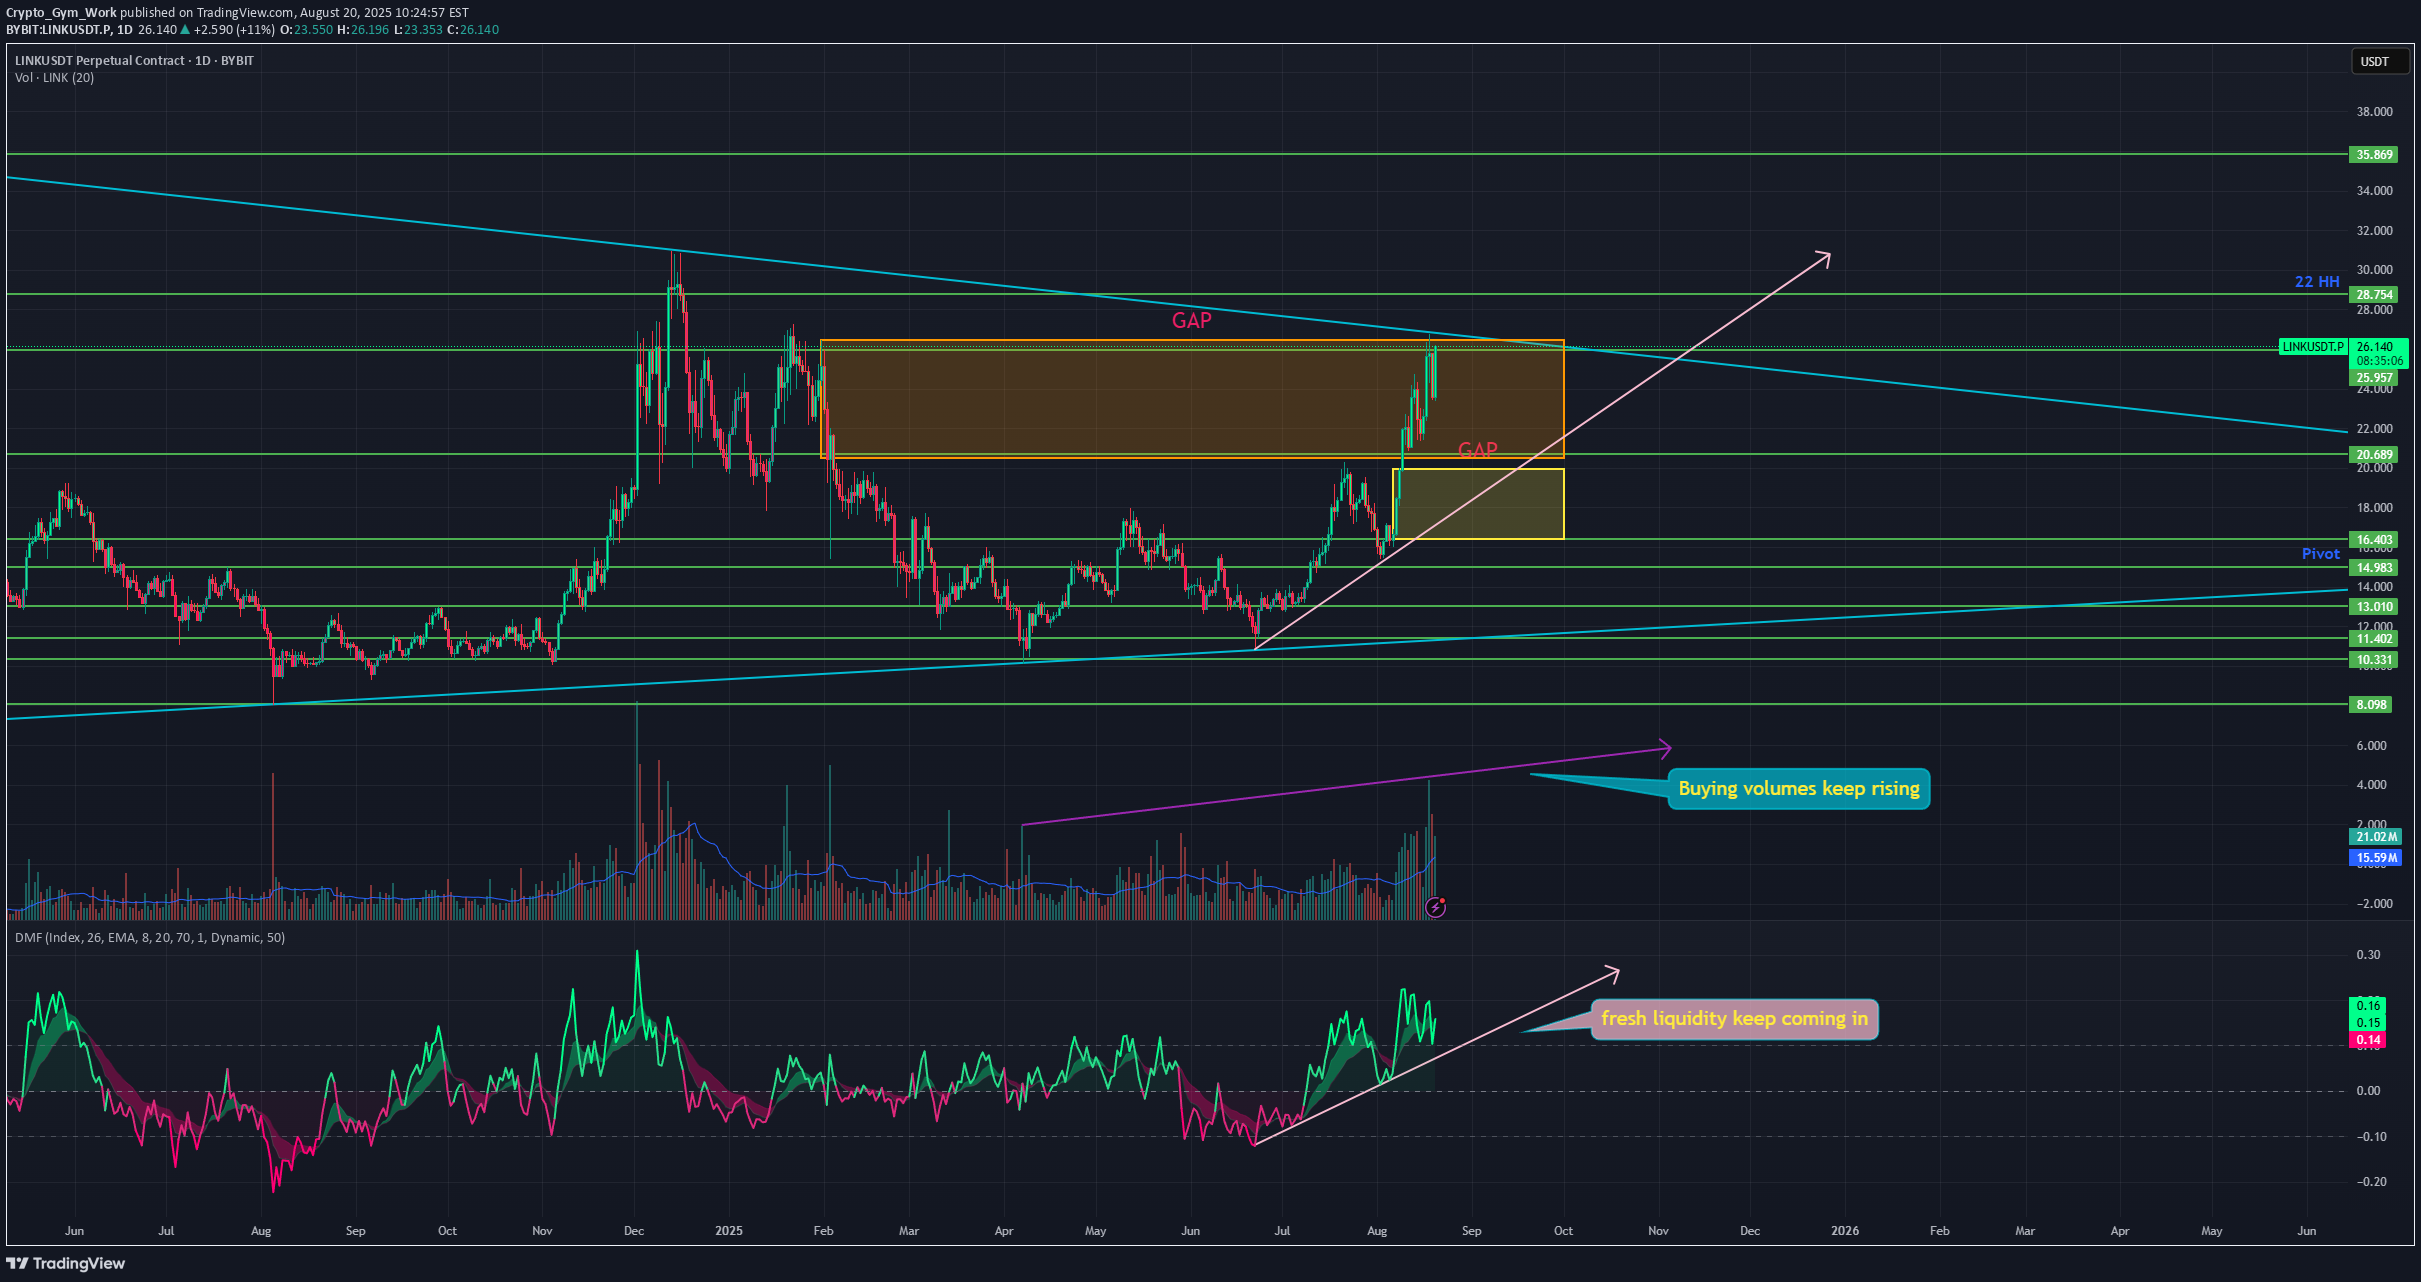
⚡️ It’s been about a month since I said you don’t want to miss LINK. Many didn’t believe it, I suppose. And now LINK is being recognized by the White House as a key project. Surprising, isn’t it? This is one of those projects where you don’t even need to look at the chart — it’s simply technologically essential for the crypto ecosystem, on the same level as Ethereum. But let’s still look at LINK from a technical perspective — does it have room to grow further? ➡️ First: LINK is one of the very few tokens currently sitting at its local peak, while even ETH is still in correction. ➡️ Second: it’s also one of the only tokens where we see harmony in buying volume. Buyer interest is rising together with price, which signals the market considers LINK undervalued at current levels. ➡️ Third: there’s a clear inflow of fresh liquidity, and it’s actually increasing — while liquidity is flowing out of most of the rest of the crypto market. ➡️ And importantly — with this move LINK has now closed one of the upper gaps. That means the road higher won’t be as smooth. Right now, it’s already testing resistance at $25.95 and approaching its 5-year descending resistance line. 📌 Conclusion: If LINK manages to hold above this level, we could very well see a run to a new ATH — and possibly beyond. However, more and more gaps are forming below, and the overall market is weakening, which is definitely something to be cautious about.
Disclaimer
Any content and materials included in Sahmeto's website and official communication channels are a compilation of personal opinions and analyses and are not binding. They do not constitute any recommendation for buying, selling, entering or exiting the stock market and cryptocurrency market. Also, all news and analyses included in the website and channels are merely republished information from official and unofficial domestic and foreign sources, and it is obvious that users of the said content are responsible for following up and ensuring the authenticity and accuracy of the materials. Therefore, while disclaiming responsibility, it is declared that the responsibility for any decision-making, action, and potential profit and loss in the capital market and cryptocurrency market lies with the trader.