
CryptoSahintas
@t_CryptoSahintas

What symbols does the trader recommend buying?
Purchase History
پیام های تریدر
Filter
CryptoSahintas
آواکس در برابر سلطه بیت کوین: آیا به کف قیمت رسیدهایم؟ (تحلیل تکنیکال)
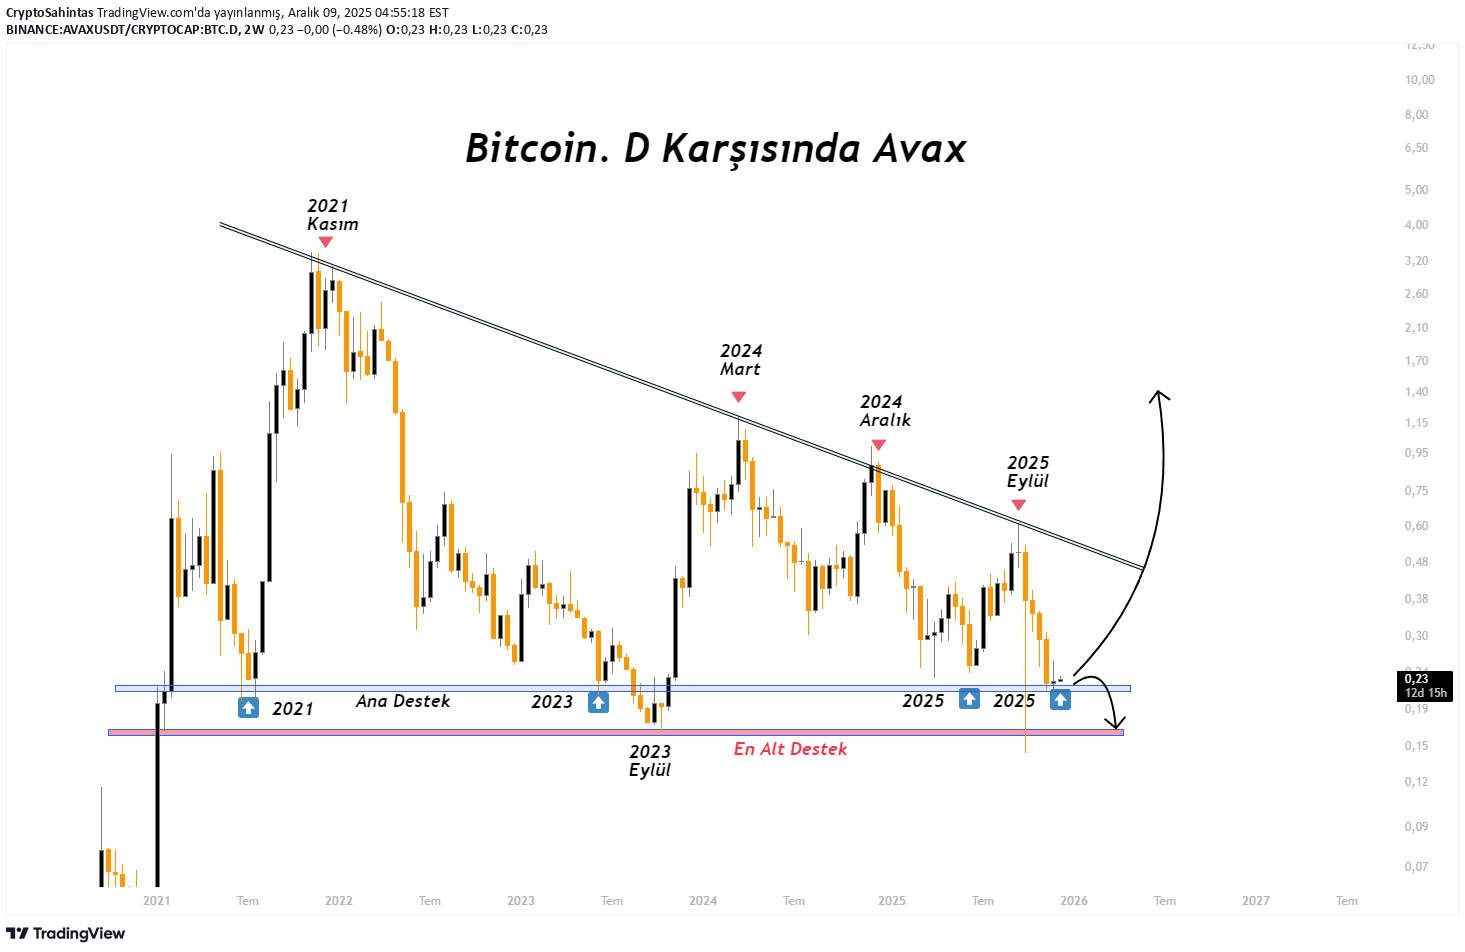
Bitcoin Versus Dominance Avax Where Does It Stand Exactly? My friends, I've been holding Avax since $24 and I'm currently down about 43%. I never hid this; At that time, I openly shared that I sold the ETHs I bought at $ 1,700 at 4,500 and switched to Avax. When we look at Avax's latest performance, we have to admit that it is behind compared to Sol, BNB and other big projects. The market has fallen in general, but I see this in particular for Avax: Although it is not satisfactory in the rise, it seems a little more resistant in the fall than many projects. Let's get to the chart... I have shared the Avax ratio against Btc.d below. Peaks such as November 2011 - March 2024 - December 2024 - September 2025 are clearly visible. Every time the price hits the black trend, there is a sell-off. On the support side, there are two important regions: • Main Support • Most Alt Support We are currently above major support. This region is a strong ground that has worked in all the contacts of July 2021, May 2023, June 2025 and December 2025, where we are currently. The lowest alt support corresponds to September 2023. The possibility of testing there is completely on the table. From my perspective, the main support is stronger and as long as this is not broken, we are in the bottom zone. If this is the bottom, which is technically a strong indicator, Avax should strengthen against BTC.D from here and at least retest the 20-25 dollar band we bought. Will it go to at least alt support? If it goes, there is a possibility of 8-10 dollars. It's not the scenario I expected, but it's not completely impossible either. In summary: We are very close to the bottom areas on the Avax side. I am waiting for the return to start in the next period. AVAX #Avax
CryptoSahintas
بیت کوین در آستانه انفجار؟ سیگنال تاریخی کف قیمتی RSI و MA50 تکرار شد!
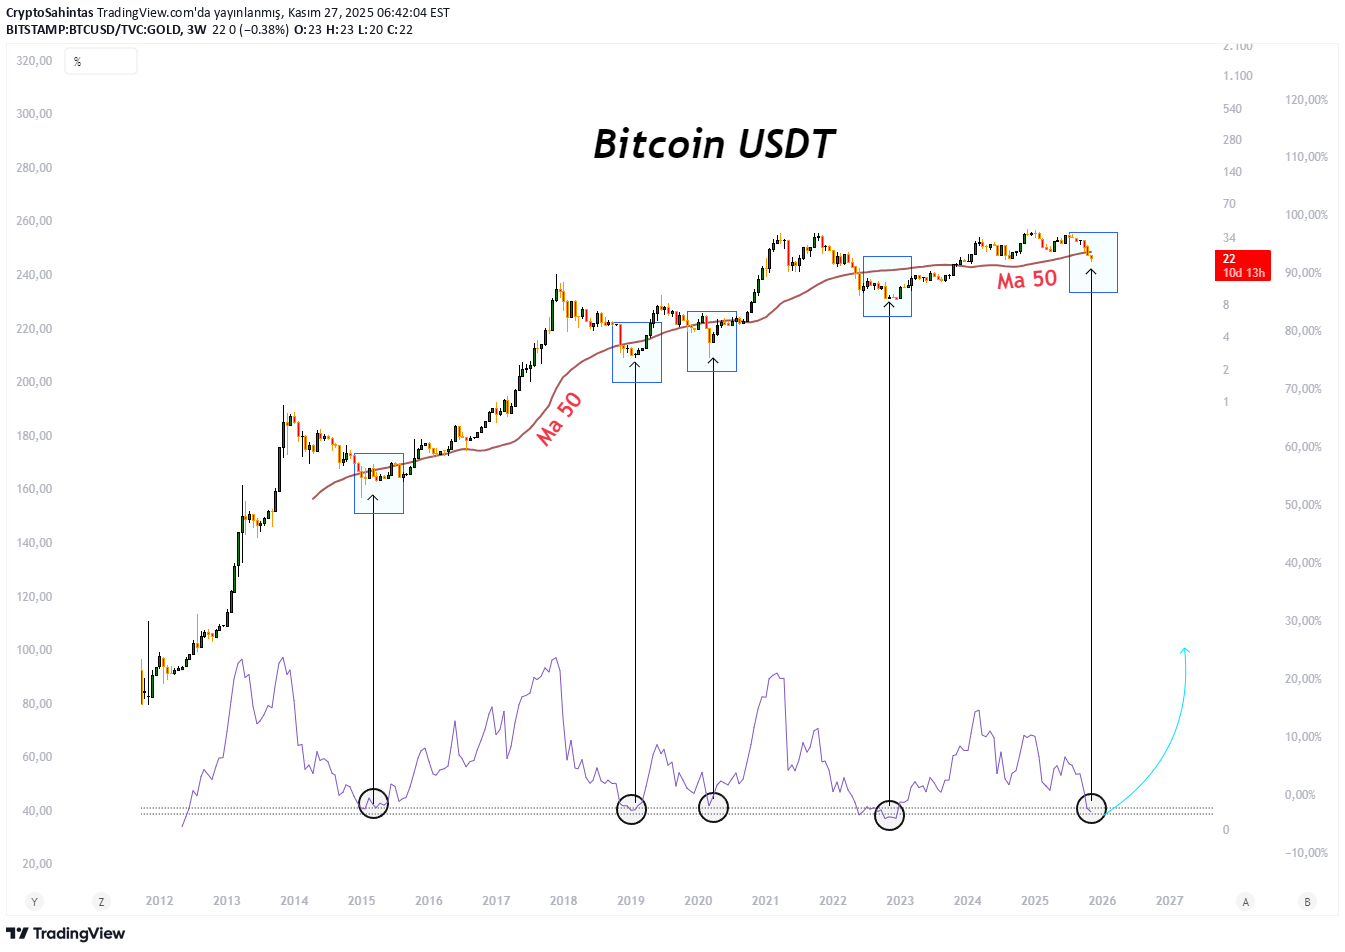
Bitcoin MA50 Theme Gives the Same Signal Again in the RSI Historical Bottom Region When we look at Bitcoin's past cycles, there is a clear pattern: When the RSI reached this bottom zone and the price pressed MA50, a strong reversal began each time. In 2015, 2018, 2020 and 2022, these levels were where the bull started. Today we are at the same point again. If this cycle is to work, this is where the turnaround will come. BTC #Bitcoin
CryptoSahintas
با وجود ریزش بیت کوین، چرا هنوز منتظر رالی صعودی هستم؟ (تحلیل سیکلهای تاریخی)
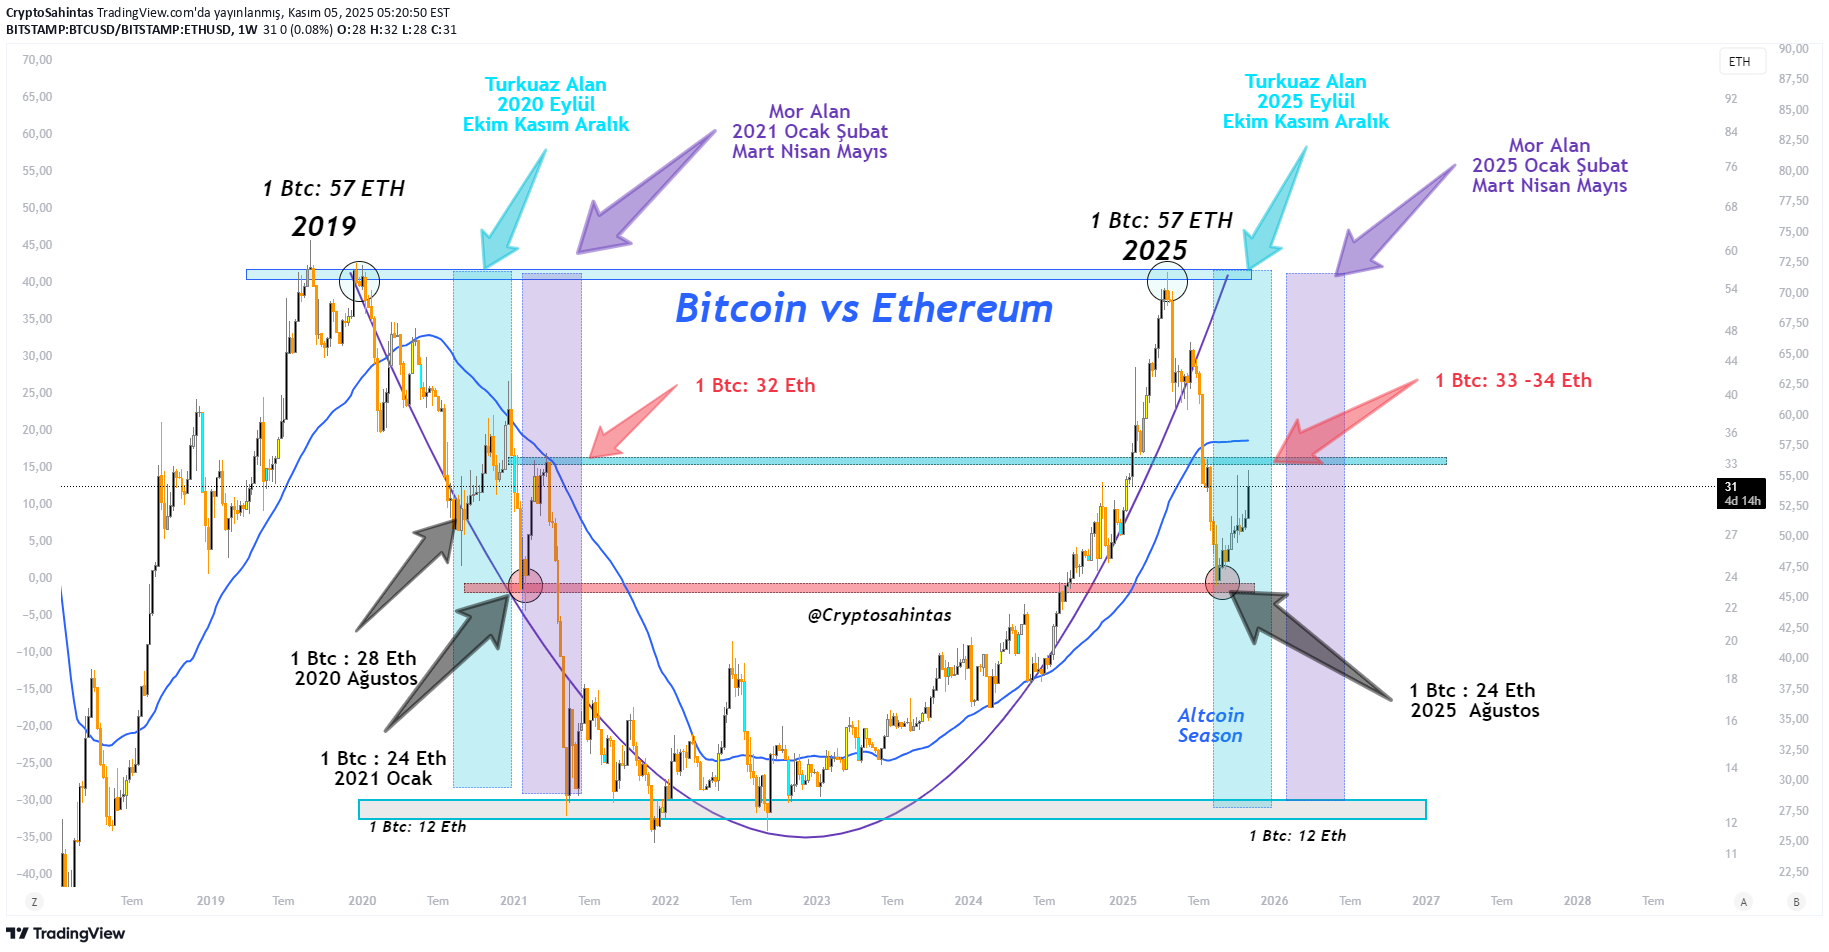
Why am I still optimistic? Why am I waiting for a bull? My friends, although the SMA 50 breakout on the BTC side strengthens the bear possibility, I still have a bullish expectation. Because when we look at the cyclical picture, there is still a possibility that we may have entered a period similar to after 2020 or January 2021. Let's examine the ETH/BTC ratio in the chart I shared below. There are turquoise and purple areas on the chart. The turquoise section represents the September–December 2020 period. The purple area corresponds to the period January–May 2021. Let's examine it together.. 🔹 Turquoise area (2020 period) During this process, BTC dominance had increased, meaning BTC was stronger than ETH. It increased from 1 BTC = 28 ETH to 40–42 ETH. ETH It remained weak compared to BTC, but it was not crushed. TOTAL3 had also risen during this period, meaning BTC was strong, but the altcoins had not fallen completely either. And at that time, the bottom was formed in August 2020 (1 BTC = 28 ETH). The peak came in December, then the altcoin rally began. 🔹 Purple area (2021 period) In January 2021, it was at 1 BTC = 24 ETH. The ratio went up to 32, then ETH and altcoins strengthened. While BTC dominance decreased, BTC, ETH and TOTAL3 increased together. That's where the big altcoin rally began. When the ratio dropped to 12 ETH levels, the bear season started. Let's come to today... If we are going to wait for a bear season, then on this chart, 1 BTC must fall to at least 14-15, or even a maximum of 12 ETH, so that we can say "the bear has started". We have not seen this painting yet. ETH and TOTAL3 are currently weak relative to BTC. It continues faithfully to the BTC loop, but the ETH side is not as strong. Although this situation is similar to the turquoise area in 2020, there are some differences. In September–October 2020, while BTC dominance was increasing, BTC, ETH and TOTAL3 were increasing together. Today, only BTC is strong, ETH and TOTAL3 are lagging behind. In other words, the table is not exactly the same, even though there is a cyclical similarity, we are progressing asymmetrically. So what should we do and what should we expect? If we are experiencing a turquoise zone, we should see BTC, ETH and TOTAL3 rise together in November–December 2025 and a rally in January–May 2026. Just as BTC dominance increased in November-December 2020 and started to decrease in January 2021, we can see the same picture between 2025-2026. But for this scenario to be valid, BTC, ETH and TOTAL3 must move together. If these three do not rise at the same time and we see a negative atmosphere, the turquoise scenario will be canceled. If there is a purple zone, that is, if we are in a process similar to the 2021 cycle, BTC dominance should decrease, BTC and ETH should increase and TOTAL3 should show the strongest performance in the coming weeks. Then we may see a rally between November 2025–February 2026. But if neither turquoise nor purple scenario works, If BTC breaks SMA 50 and persists below $100 thousand, ETH and TOTAL3 will go out of the cycle. And for the first time in history, a bear season will occur without ETH making a new ATH and without the BTC/ETH rate falling to 12–14–16 levels. In this case, the bear season begins for BTC and ETH will probably fall harder than BTC. The ratio can also remain horizontal for a long time between 1 BTC = 26–34 ETH. This chart implies a clear bear market through 2026. All of this is conjecture, a loop-within-a-loop analysis. I personally think the purple zone scenario will come true. I hope we are not mistaken. But even if I'm wrong, I'll say here, frankly, "we failed." With love.
CryptoSahintas
پیشبینی شوکهکننده بیت کوین: آیا ۲۰۲۶ سال سقوط بزرگ خواهد بود؟
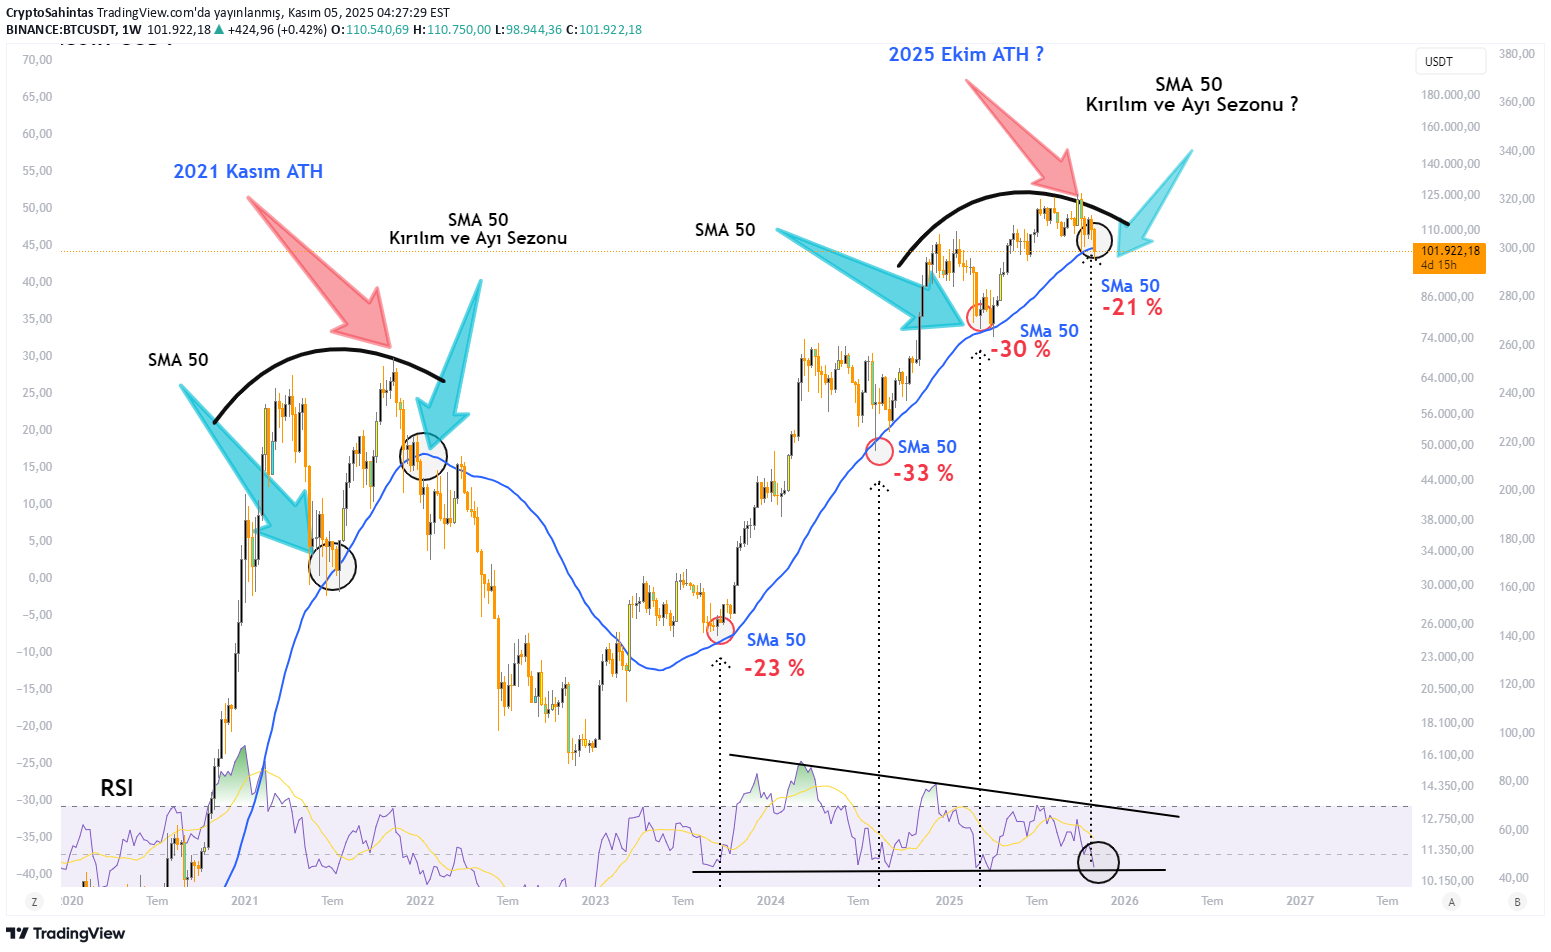
The loop on the Bitcoin side worked amazingly! My friends, on the BTC side the picture has worked perfectly so far. When we look at the cyclical structure, Bitcoin should enter a bear season by 2026. I expect an attack in Bitcoin between November and December 2025. It is possible for altcoins to follow BTC and ETH and experience a rally that could last until February 2026. But I think this rally will be followed by a clear bear season in 2026. If the SMA 50 level breaks down, the market weakens before ETH makes a new ATH and TOTAL3 rallies, the bear season scenario is on the table. If November-December is also negative, it is quite possible that Bitcoin will go bearish. In such a case, we will be talking about the $ 35,000-45,000 range as the bottom area. My goal is not to spread pessimism, just to share what the data shows. I have never drawn a bear chart before; I've always been on the bullish side and still am. But the truth is: there is a high probability of a bear season in 2026. That's why we must take our guard accordingly. If you ask me: If SMA breaks 50 in the November–December 2025 period BTC and ETH + TOTAL3 draws a negative picture, then I will be convinced of the bear scenario. My expectation is that Bitcoin will turn from this point in the opposite direction, ETH will rise following BTC and TOTAL3 will support this movement. If we are currently experiencing the November–December 2020 cycle, an altcoin rally should occur between November–December 2025 and January–April 2026, followed by the bear season. But if we are in a process similar to the 2017 or 2021 cycle, TOTAL3 should rise sharply by ETH and BTC between November and February. In short, my friends, Bitcoin definitely needs to work and ETH needs to make a new ATH. The altcoin rally will not start without these happening. If these do not happen, SMA 50 breaks and BTC + ETH + TOTAL3 remains weak in November–December, 2026 will be a clear bear season. And this will be the first bear season in history to be entered without making ETH new ATH and TOTAL3 rallying. Time will show everything, friends. We will watch the November and December charts and make the final decision. In the special section for subscribers, I will share my decision in its most transparent form: "Are we cutting off arms or waiting?"
CryptoSahintas
طلا در برابر بیت کوین: آیا سناریوی ۲۰۲۰ تکرار میشود؟ (پیشبینی ۲۰۲۵)

Gold vs Bitcoin - 2020 August Vs - 2025 October The wind will reverse.. Just like Post 2020.
CryptoSahintas
طلا در برابر عرضه پول M2: آیا زمان سقوط قیمت طلا فرا رسیده است؟

When we look at the Gold vs M2 Money Supply chart, the picture is very clear. 1974, 2021 and now 2025… After 14 years, this resistance is being tested again. The growth has been abundant, now it is time for the market to enter the correction or rest phase on the Gold side. #Gold
CryptoSahintas
اوج تاریخی طلا: آیا پایان سال 2025 تکرار طلایی 2011 خواهد بود؟

What do you see when you look at the painting? 2008 January 2011 September: 22 Bar: 1.339 Day: Fibonacci1.618 Peak 2022 January 2025 September: 22 Bars 1.337 Days Fibonaci 1.618 Peak
CryptoSahintas

CryptoSahintas
Altın 4. Adım Tamamlandı, Şimdi Sıra Altcoinlerde mi?

The cycle 1 → 2 → 3 → 4, which we saw in the gold chart, resulted in a great rise. Today I am waiting for the similar structure in the total3 Altcoins graph. We will be the survivor. Focus and trust in the process .. #Altcoinseason
CryptoSahintas
Bitcoin Döngüleri: 2013 – 2025
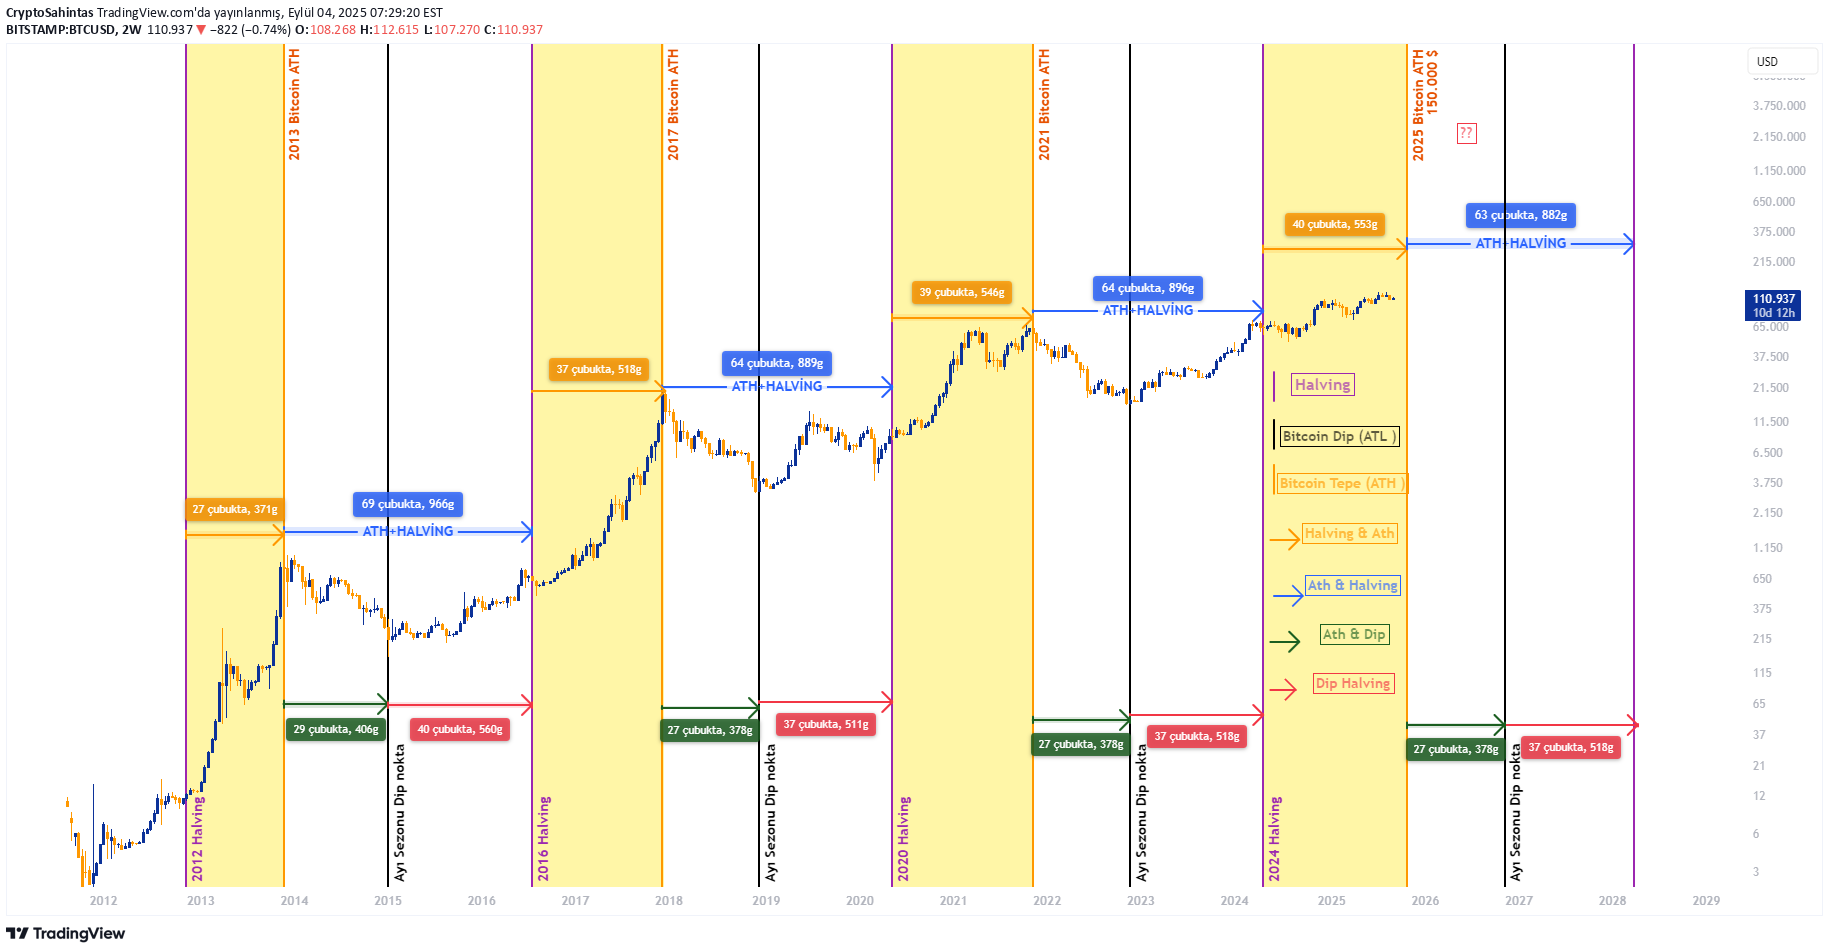
Bitcoin Cycles: 2013 - 2025 My friends, this painting shows us Bitcoin's 12 -year cycle discipline very clearly: Common point of the loops After every halving, there is a quiet period for a few quarters. Then the ATH (all time summit) comes. After ATH 1–1.5 years of bear season and the bottom process is experiencing. The loop starts again with a new halving. 📍 Where do we stand 2025? 2013 → ATH After 966 days to Halving. 2017 → ATH After 889 days until Halving. 2021 → ATH After 896 days until Halving. 2025 → The same mathematics continues: there is a distance of approximately 882 days from Halving. This table points to us that in the last quarter of 2025, Bitcoin is moving towards the peak point, and then the preparation of the bear season, as in the classic cycle. For Bitcoin 140–150 thousand $ band for the possible summit area. During this period, Ethereum and Altcoins will classic BTC 1 step, ETH will take 2 steps and subcoins 4 steps further. In the first quarter of 2026, the bull rally may have the second leg or a final peak attempt, but the real profit realization must be focused on the last quarter of 2025. This graph tells us something clear: For patients, the last quarter of 2025 may be one of the biggest opportunities in history.
Disclaimer
Any content and materials included in Sahmeto's website and official communication channels are a compilation of personal opinions and analyses and are not binding. They do not constitute any recommendation for buying, selling, entering or exiting the stock market and cryptocurrency market. Also, all news and analyses included in the website and channels are merely republished information from official and unofficial domestic and foreign sources, and it is obvious that users of the said content are responsible for following up and ensuring the authenticity and accuracy of the materials. Therefore, while disclaiming responsibility, it is declared that the responsibility for any decision-making, action, and potential profit and loss in the capital market and cryptocurrency market lies with the trader.