Technical analysis by CryptoSahintas about Symbol BTC: Buy recommendation (11/5/2025)

CryptoSahintas
با وجود ریزش بیت کوین، چرا هنوز منتظر رالی صعودی هستم؟ (تحلیل سیکلهای تاریخی)
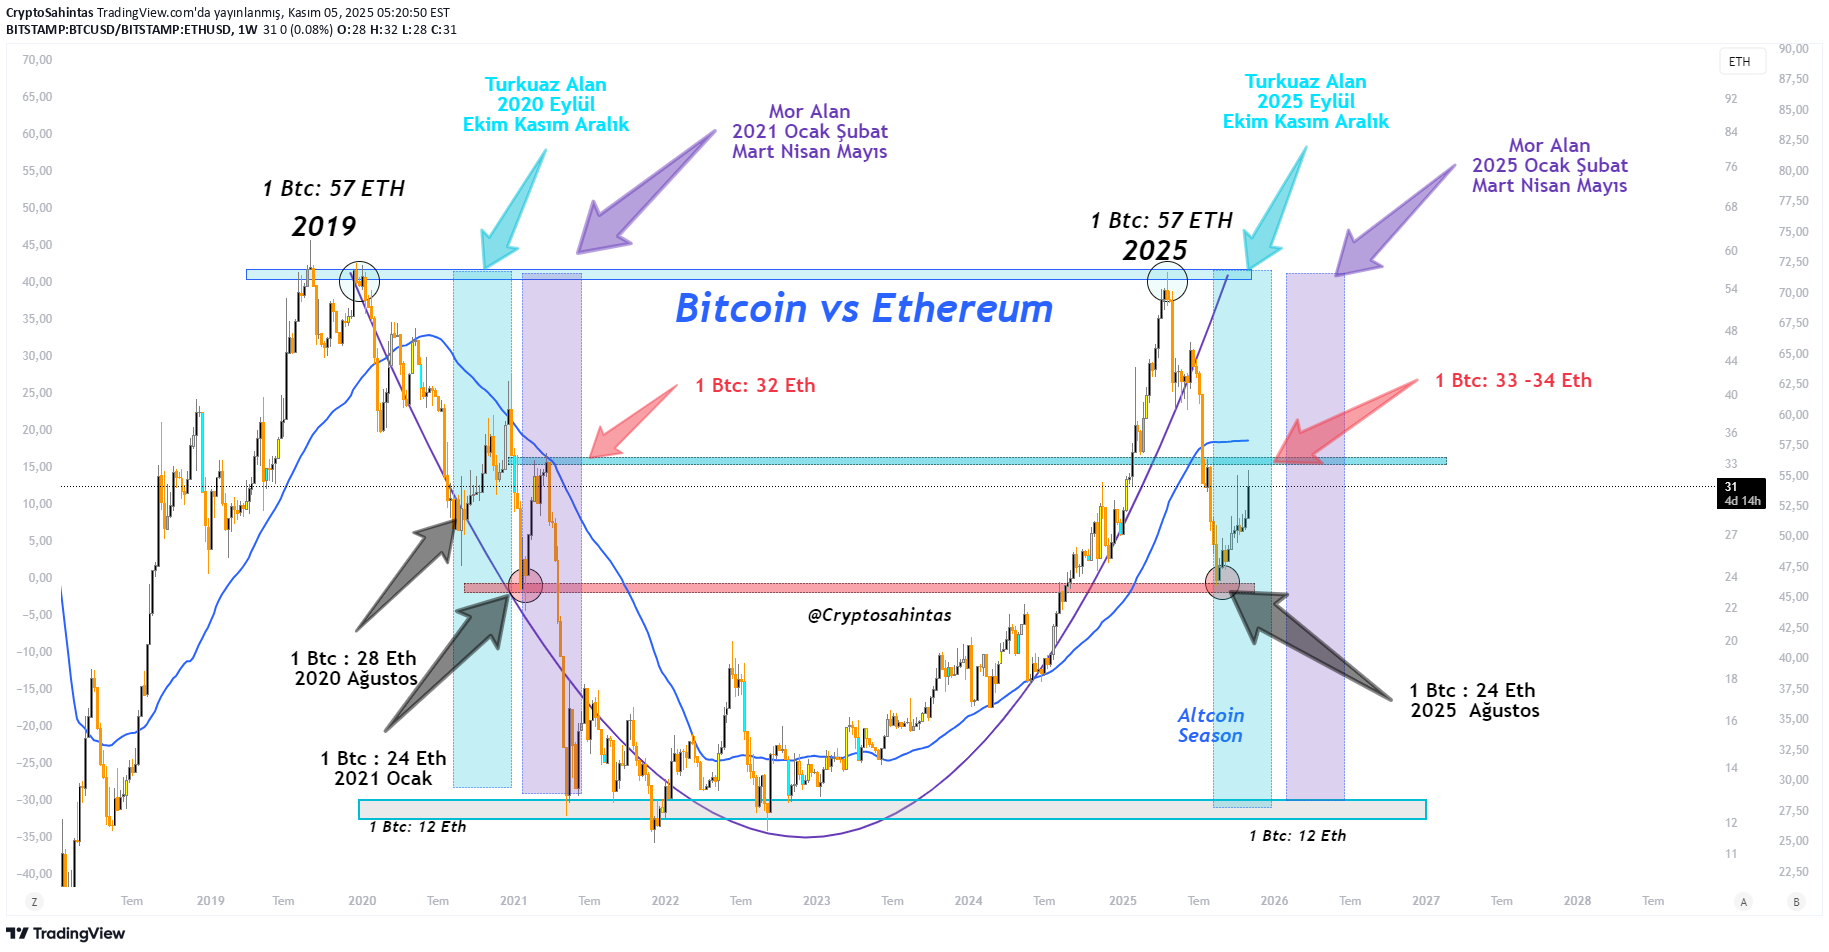
Why am I still optimistic? Why am I waiting for a bull? My friends, although the SMA 50 breakout on the BTC side strengthens the bear possibility, I still have a bullish expectation. Because when we look at the cyclical picture, there is still a possibility that we may have entered a period similar to after 2020 or January 2021. Let's examine the ETH/BTC ratio in the chart I shared below. There are turquoise and purple areas on the chart. The turquoise section represents the September–December 2020 period. The purple area corresponds to the period January–May 2021. Let's examine it together.. 🔹 Turquoise area (2020 period) During this process, BTC dominance had increased, meaning BTC was stronger than ETH. It increased from 1 BTC = 28 ETH to 40–42 ETH. ETH It remained weak compared to BTC, but it was not crushed. TOTAL3 had also risen during this period, meaning BTC was strong, but the altcoins had not fallen completely either. And at that time, the bottom was formed in August 2020 (1 BTC = 28 ETH). The peak came in December, then the altcoin rally began. 🔹 Purple area (2021 period) In January 2021, it was at 1 BTC = 24 ETH. The ratio went up to 32, then ETH and altcoins strengthened. While BTC dominance decreased, BTC, ETH and TOTAL3 increased together. That's where the big altcoin rally began. When the ratio dropped to 12 ETH levels, the bear season started. Let's come to today... If we are going to wait for a bear season, then on this chart, 1 BTC must fall to at least 14-15, or even a maximum of 12 ETH, so that we can say "the bear has started". We have not seen this painting yet. ETH and TOTAL3 are currently weak relative to BTC. It continues faithfully to the BTC loop, but the ETH side is not as strong. Although this situation is similar to the turquoise area in 2020, there are some differences. In September–October 2020, while BTC dominance was increasing, BTC, ETH and TOTAL3 were increasing together. Today, only BTC is strong, ETH and TOTAL3 are lagging behind. In other words, the table is not exactly the same, even though there is a cyclical similarity, we are progressing asymmetrically. So what should we do and what should we expect? If we are experiencing a turquoise zone, we should see BTC, ETH and TOTAL3 rise together in November–December 2025 and a rally in January–May 2026. Just as BTC dominance increased in November-December 2020 and started to decrease in January 2021, we can see the same picture between 2025-2026. But for this scenario to be valid, BTC, ETH and TOTAL3 must move together. If these three do not rise at the same time and we see a negative atmosphere, the turquoise scenario will be canceled. If there is a purple zone, that is, if we are in a process similar to the 2021 cycle, BTC dominance should decrease, BTC and ETH should increase and TOTAL3 should show the strongest performance in the coming weeks. Then we may see a rally between November 2025–February 2026. But if neither turquoise nor purple scenario works, If BTC breaks SMA 50 and persists below $100 thousand, ETH and TOTAL3 will go out of the cycle. And for the first time in history, a bear season will occur without ETH making a new ATH and without the BTC/ETH rate falling to 12–14–16 levels. In this case, the bear season begins for BTC and ETH will probably fall harder than BTC. The ratio can also remain horizontal for a long time between 1 BTC = 26–34 ETH. This chart implies a clear bear market through 2026. All of this is conjecture, a loop-within-a-loop analysis. I personally think the purple zone scenario will come true. I hope we are not mistaken. But even if I'm wrong, I'll say here, frankly, "we failed." With love.