
CryptoPilot
@t_CryptoPilot

What symbols does the trader recommend buying?
Purchase History
پیام های تریدر
Filter
Signal Type
CryptoPilot
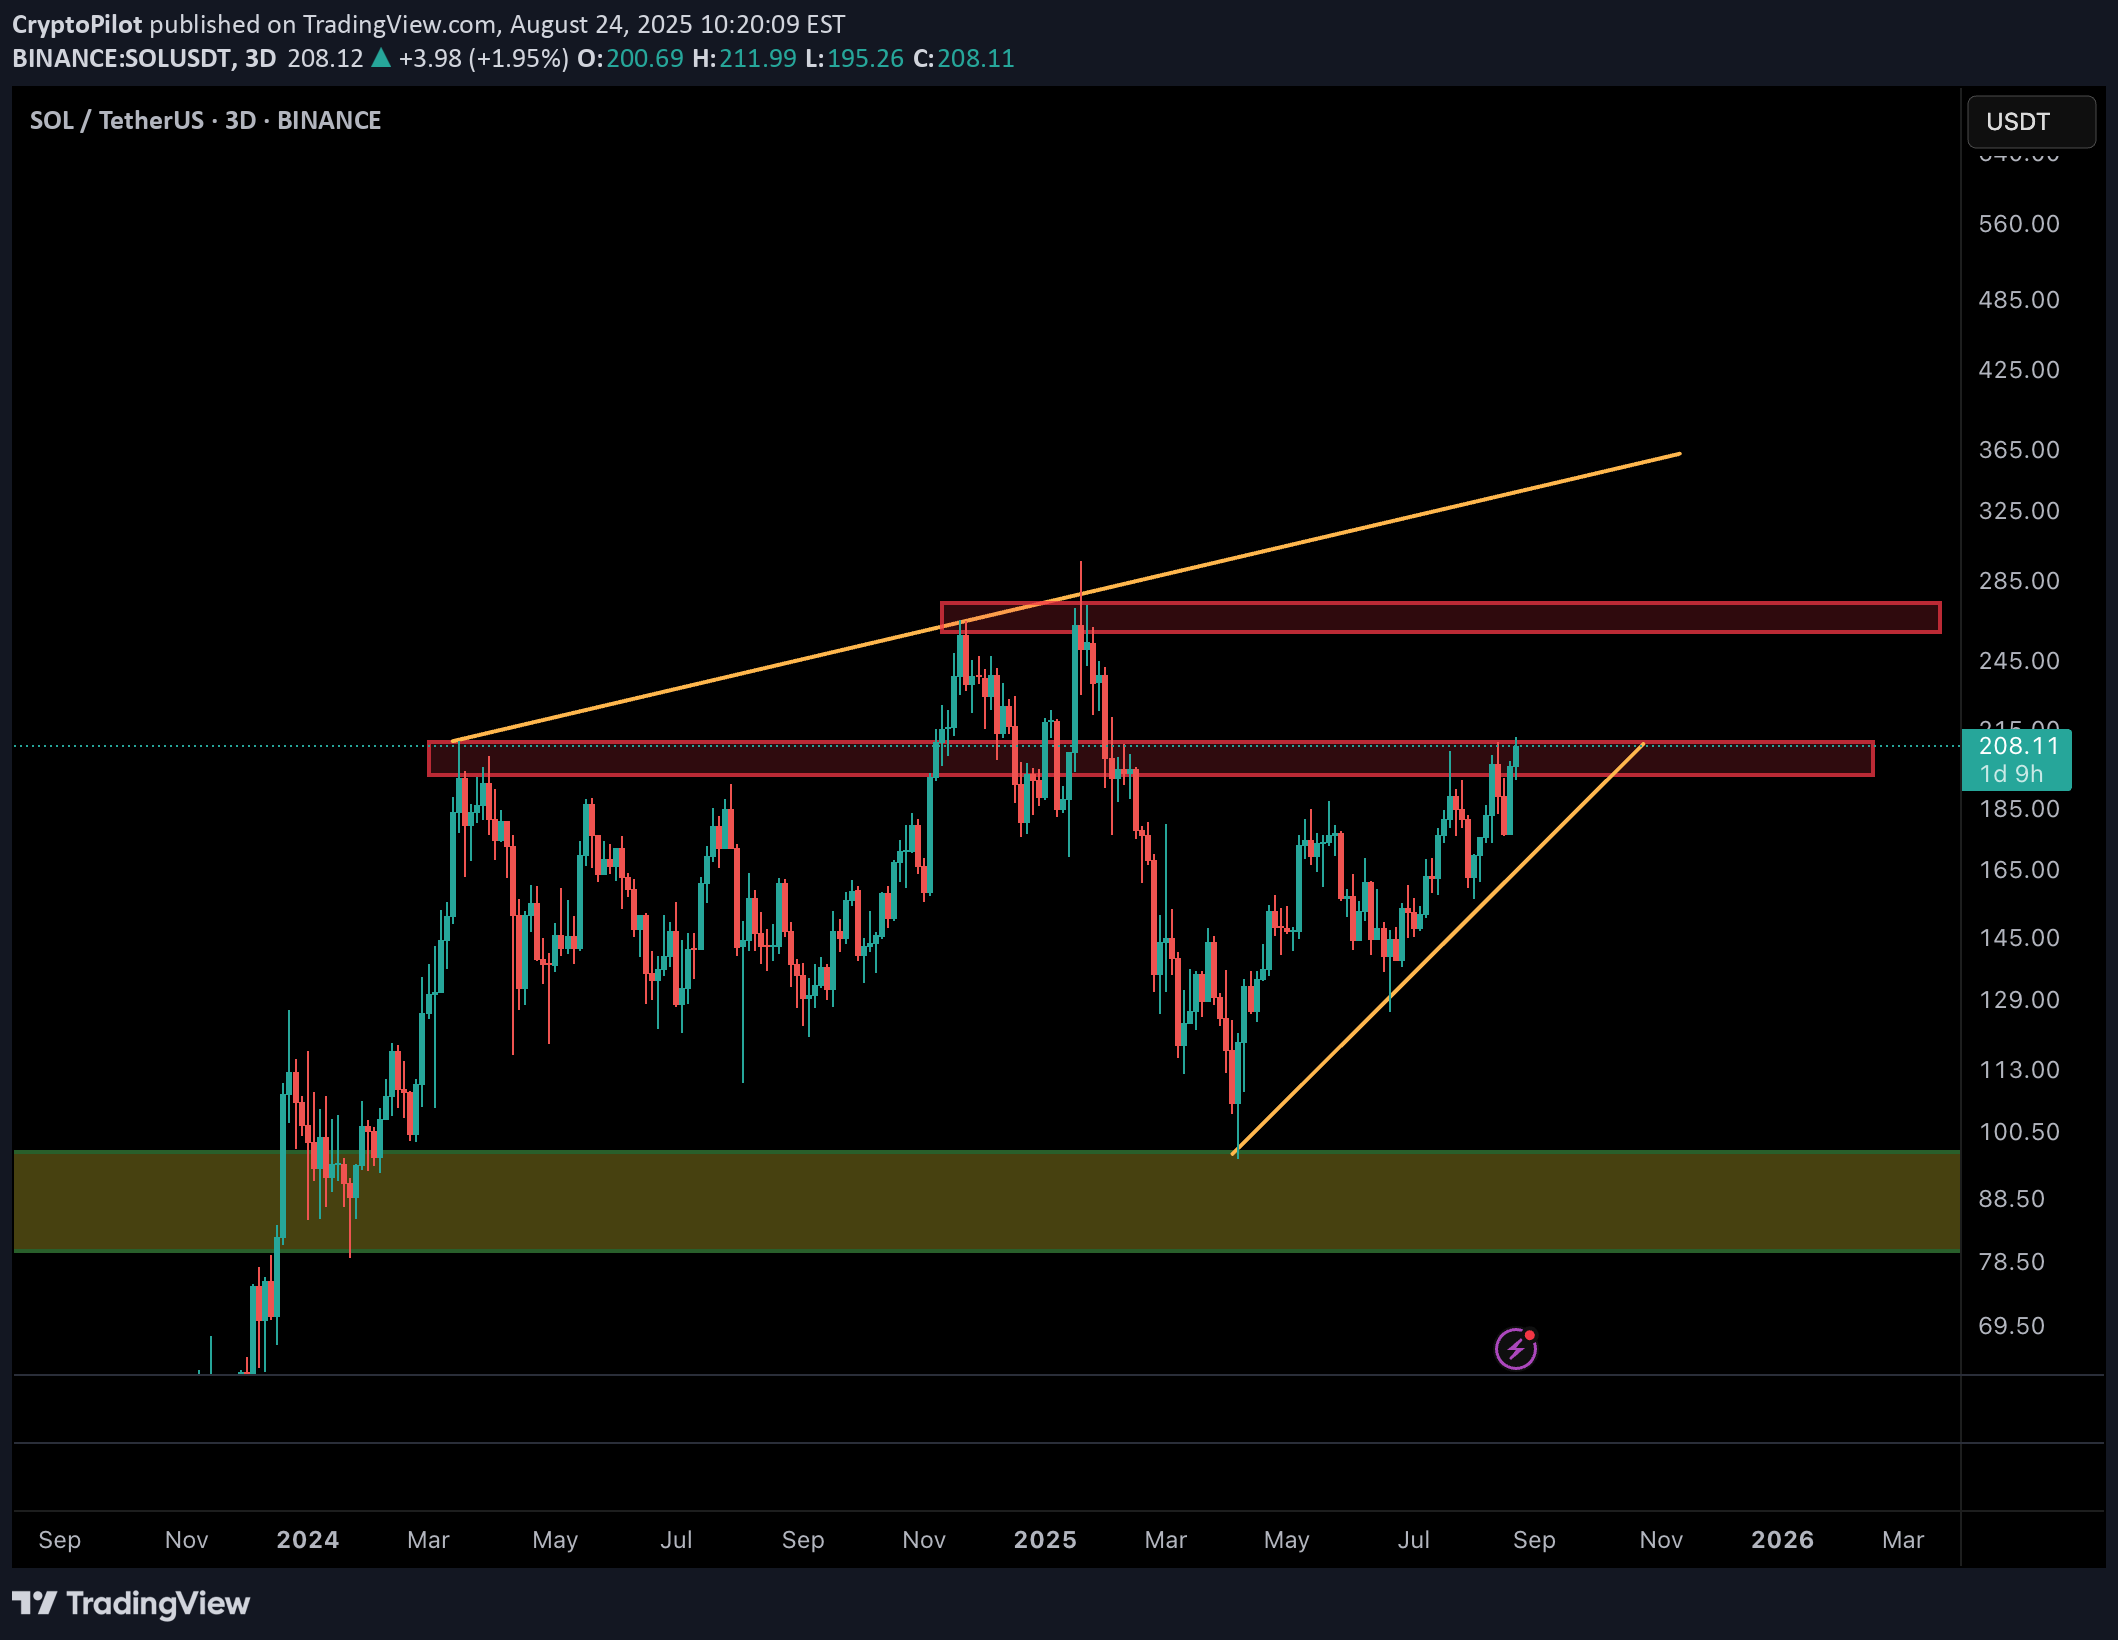
Solana (SOL/USDT) has been recovering strongly since bouncing from the $110 area and is now testing the critical resistance zone around $205–213. This level has acted as a major barrier multiple times in the past, making it a true “make-or-break” point. 📌 Bullish Scenario (more likely if $213 holds): •A confirmed breakout and daily/3D close above $213 could trigger a rally toward the next major resistance at $270. •A successful move beyond $270 may even open the path toward the long-term resistance trendline near $320–340. 📌 Bearish / Alternative Scenario: •If Solana fails to hold above $213, a pullback toward $180–175 is possible. •Stronger support lies around $100, which remains the key level to defend for bulls. ⚡ Conclusion: As long as SOL stays above $200, the structure remains bullish. A breakout above $213 would confirm momentum and unlock a potential move toward $270, while rejection could mean another corrective dip before the next attempt.
CryptoPilot
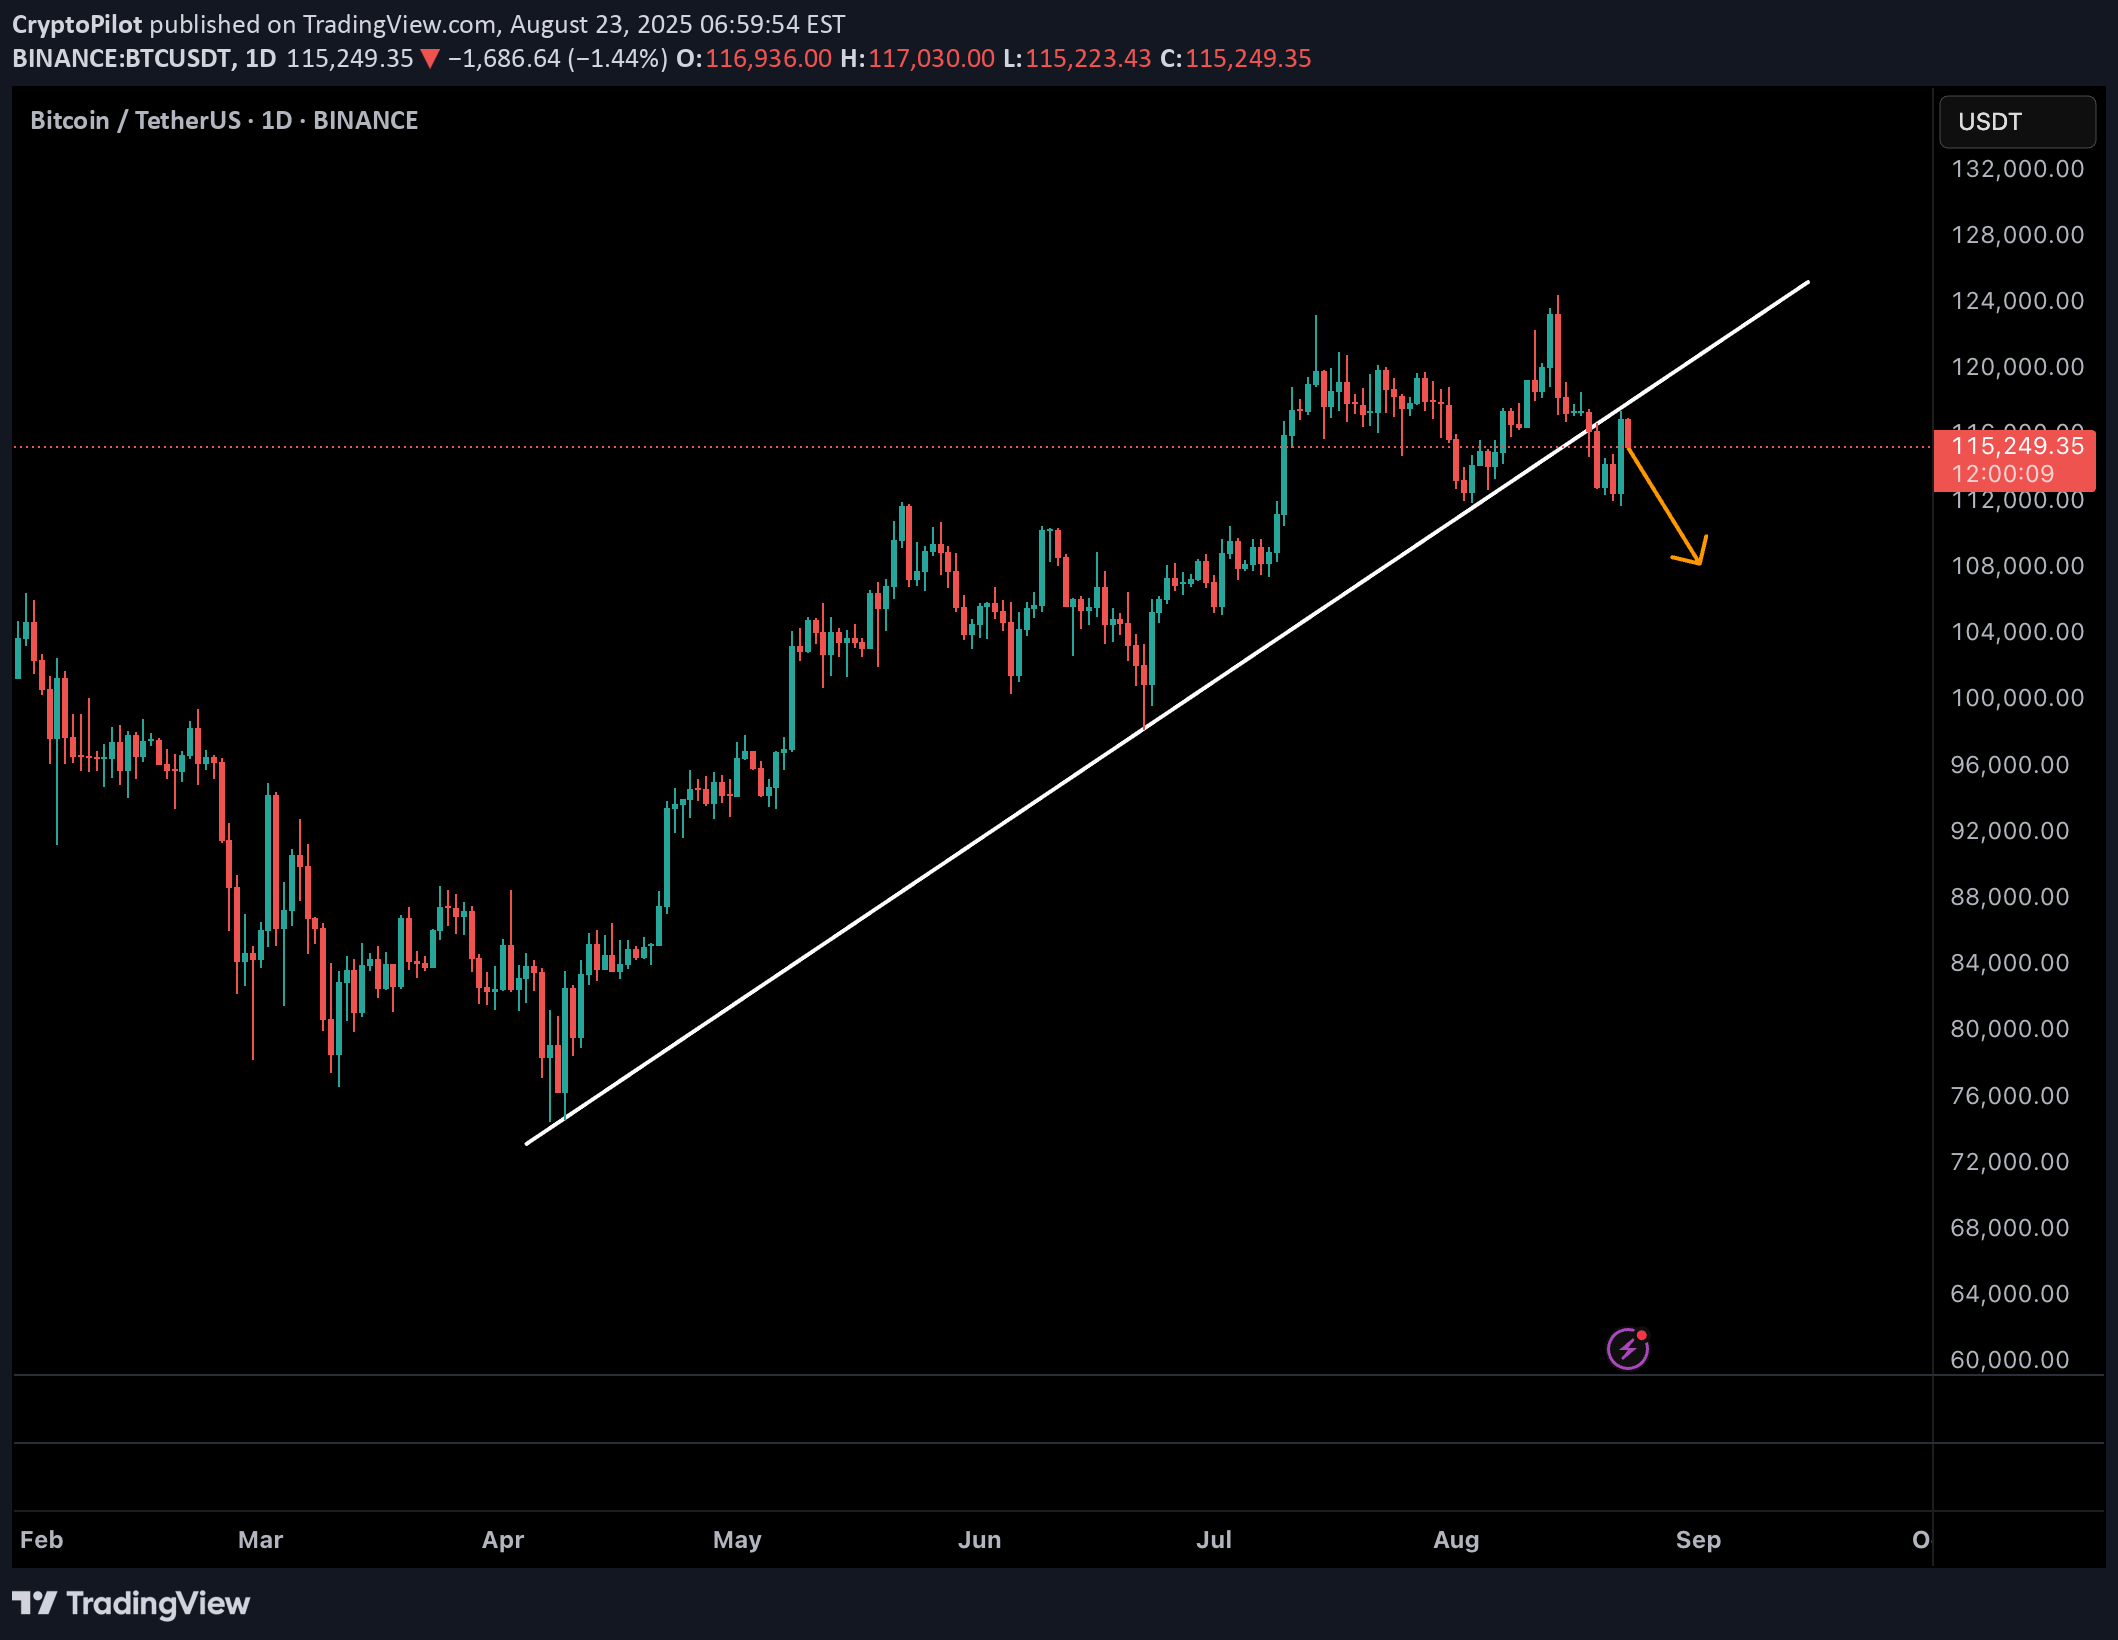
Bitcoin has officially broken its ascending trendline on the daily chart — a strong technical signal that the bullish momentum is weakening. Yesterday’s sharp pump was nothing more than a classic pullback to retest the broken trendline, and price is now showing signs of rejecting it. From a price action perspective, this setup often acts as a trap for late buyers, with the market typically retracing the entire pullback move. 🔑 Key Points: •Daily ascending trendline has been broken. •Yesterday’s rally = pullback retest of the broken structure. •Market likely to erase yesterday’s gains and resume downward momentum. 📊 Key Levels to Watch: •Support 1: $112,000 •Support 2: $108,000 •Invalidation: A daily close back above yesterday’s high (~$117,000). 🎯 Trading Strategy: •Wait for confirmation on lower timeframes (1H/4H) such as a CHoCH (Change of Character) or BOS (Break of Structure). •Short entries become favorable if price fails to reclaim $117k. •Initial targets: $112k → $108k. •Keep stops above the recent swing high to control risk. ⚡ Summary: The break + retest of the ascending trendline is a bearish sign. As long as BTC trades below the retest zone, the path of least resistance is down. Traders should stay patient, wait for proper entry signals, and avoid being trapped by the pullback. ⸻
CryptoPilot
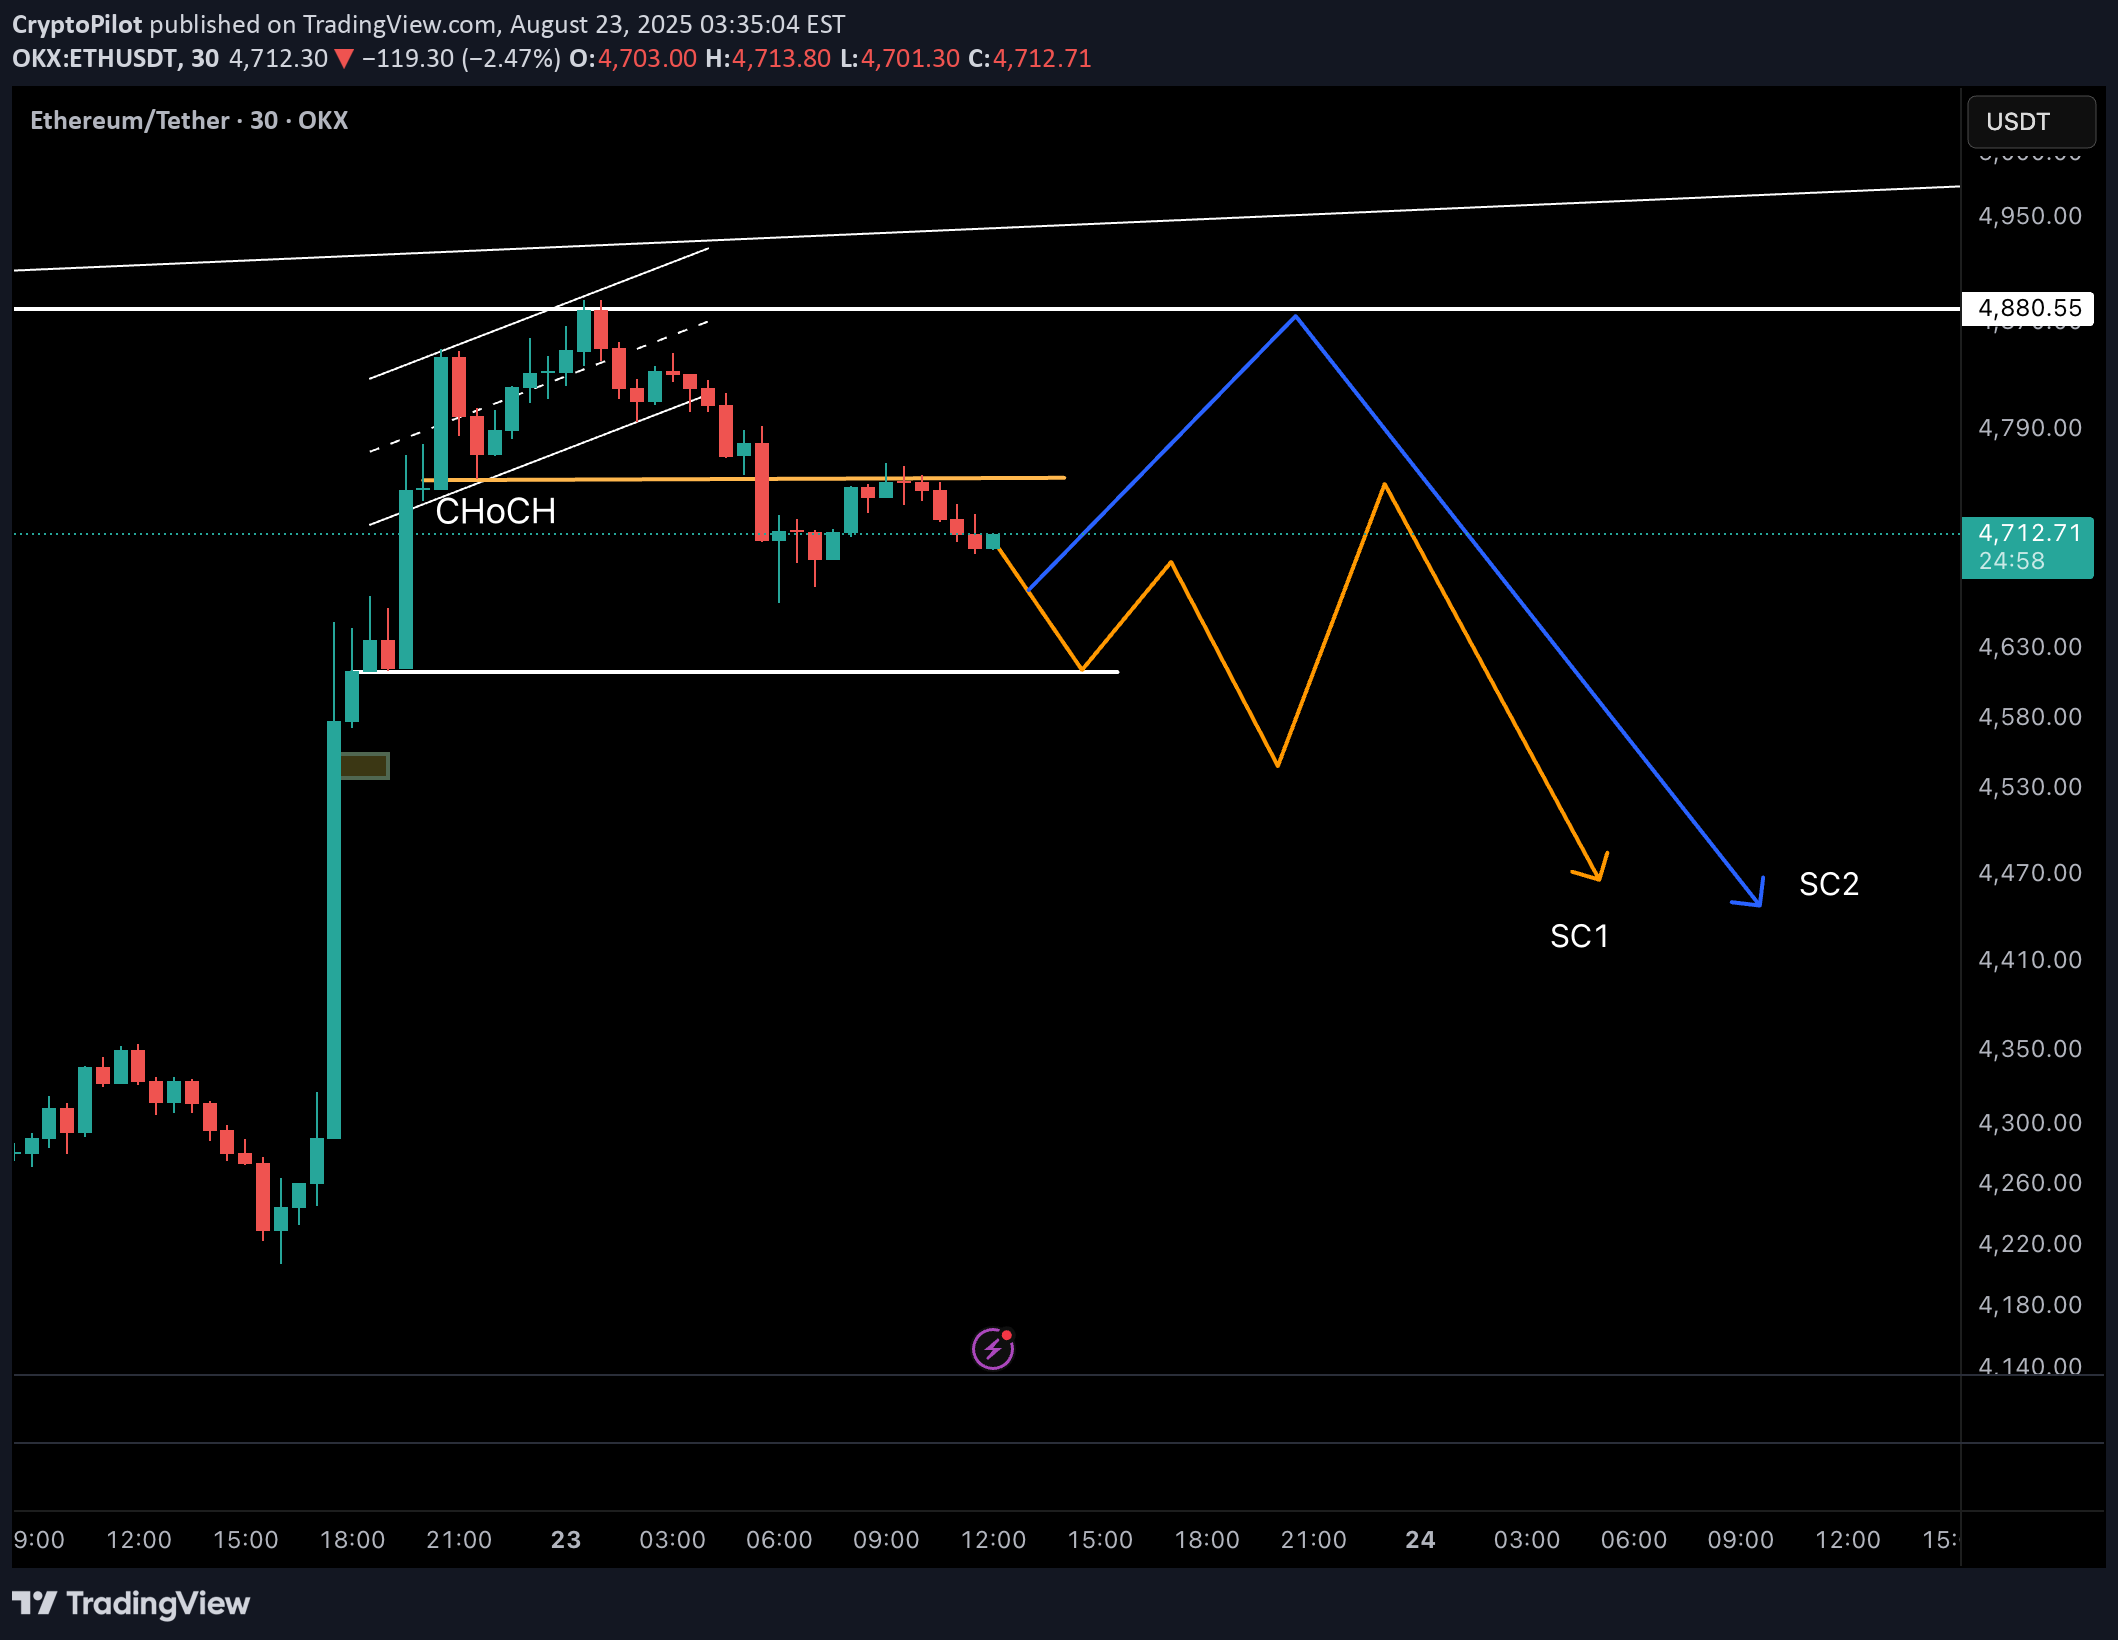
As mentioned in my previous Ethereum analysis, ETH has completed its 5-wave impulsive rally and is currently inside wave B of a corrective ABC structure. Wave B often breaks above the wave ⑤ top to trap liquidity before a sharp wave C sell-off. 📊 Latest Price Action (30m TF): •ETH has already shown a CHoCH by breaking the first key support at $4,753 and retesting it. •The next crucial support lies at $4,613. If this level also breaks, it would confirm a BOS (Break of Structure) and strengthen the bearish case. 🔀 Two Possible Scenarios from Here: 1.Price retests the broken $4,753 level as resistance → then resumes the downtrend. 2.A deeper pullback toward $4,845 (acting as a left shoulder liquidity zone) → before the real wave C decline begins. 🎯 Trading Strategy: •Wait for confirmation of BOS at $4,613. •Once confirmed, look for bearish entry triggers (CHoCH / MSB) on lower timeframes. •First targets: $4,100 → $3,800. •Stop-loss invalidation above the swing high at $4,845 to maintain strict risk control. ⚠️ Remember: patience is key. Don’t get trapped in wave B’s fake breakouts — let the structure confirm wave C. 👉 Like & Follow to stay updated as we track ETH’s potential wave C move step by step!
CryptoPilot
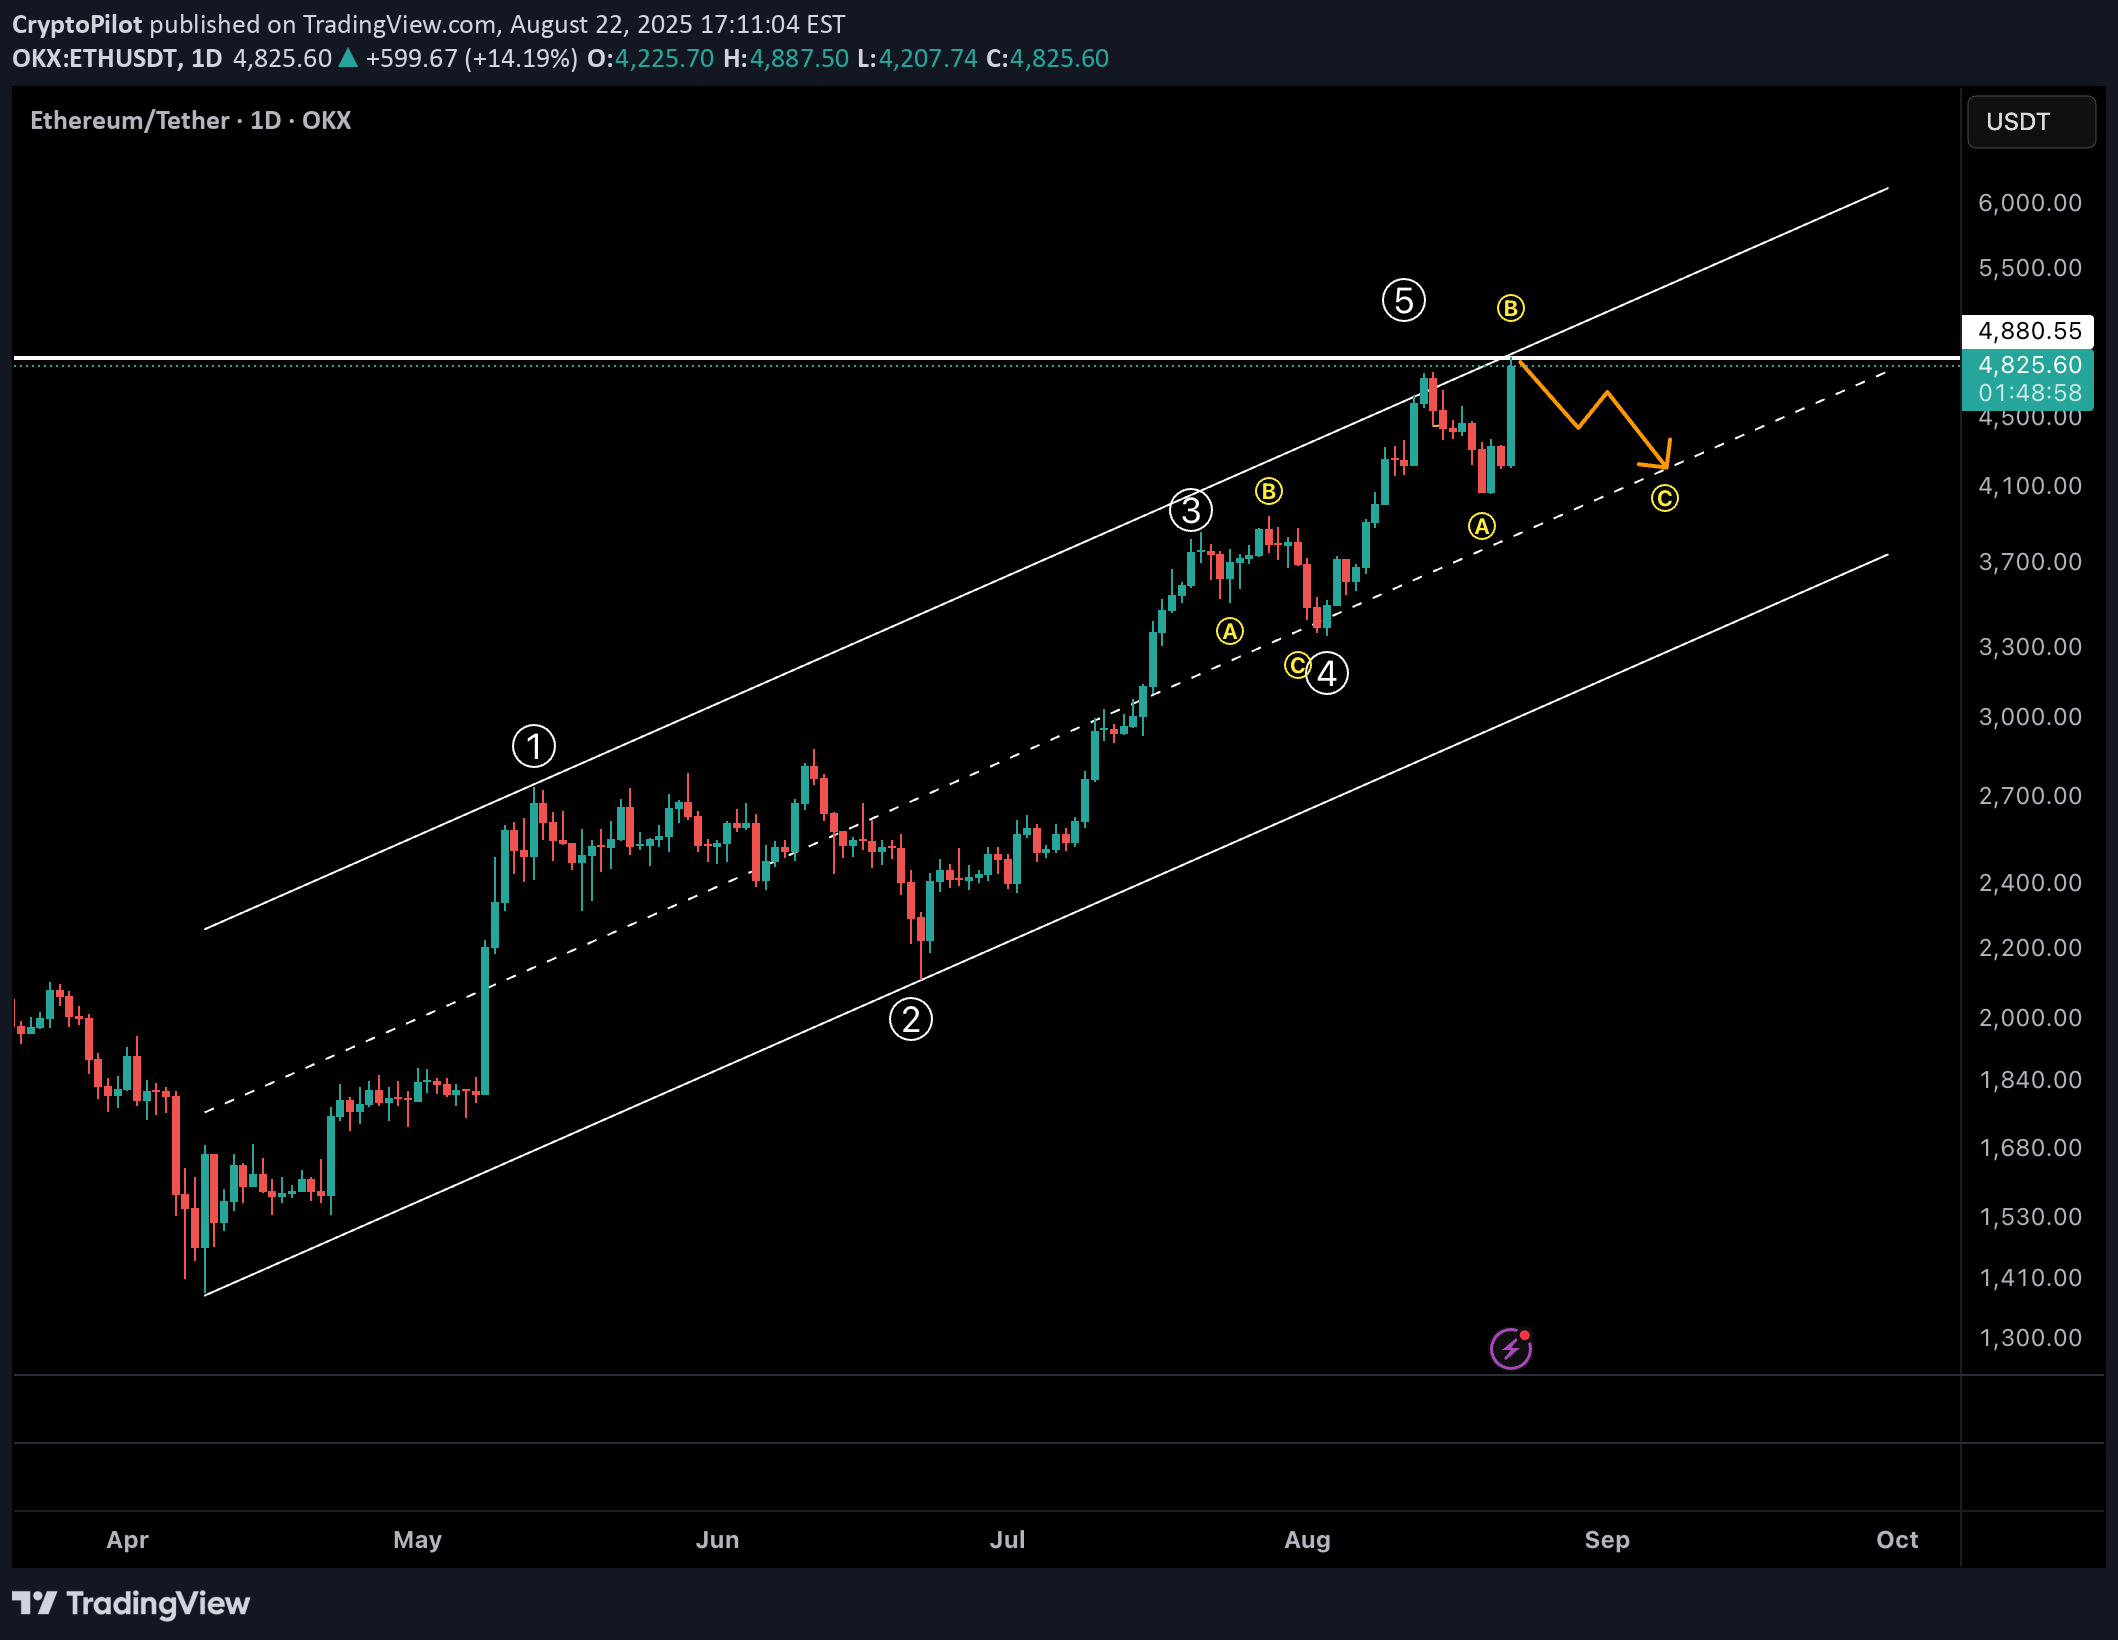
As mentioned in my previous two analyses, Ethereum rejected the $4,740 high and dropped to the $4,050 support zone, where it bounced exactly as projected. From an Elliott Wave perspective, ETH has already completed a 5-wave impulsive structure and is now inside a corrective ABC phase. At the moment, price action is developing within wave B. Historically, wave B has the tendency to break above the top of wave ⑤, creating a bull trap and sweeping liquidity before the real wave C sell-off begins. 📉 What does this mean for traders? Wave C is usually sharp, aggressive, and offers great risk-to-reward opportunities on the short side. But instead of rushing into shorts, the smart play is to wait for confirmation. 🎯 Trading Strategy: 1.Allow wave B to complete – watch for a liquidity grab above the $4,840–$4,800 zone. 2.Look for a CHoCH (Change of Character) / market structure break on lower timeframes (4H / 1H) as your entry trigger. 3.Enter short after confirmation, targeting the $4,100 → $3,800 zones first, with potential extension lower depending on momentum of wave C. 4.Place invalidation above the recent swing high to keep risk controlled. ⚡ This is a high-probability short setup forming, but patience and timing are crucial — don’t get trapped in wave B’s fake breakout. 👉 Follow for updates as we track the confirmation of wave C and refine the short targets!
CryptoPilot
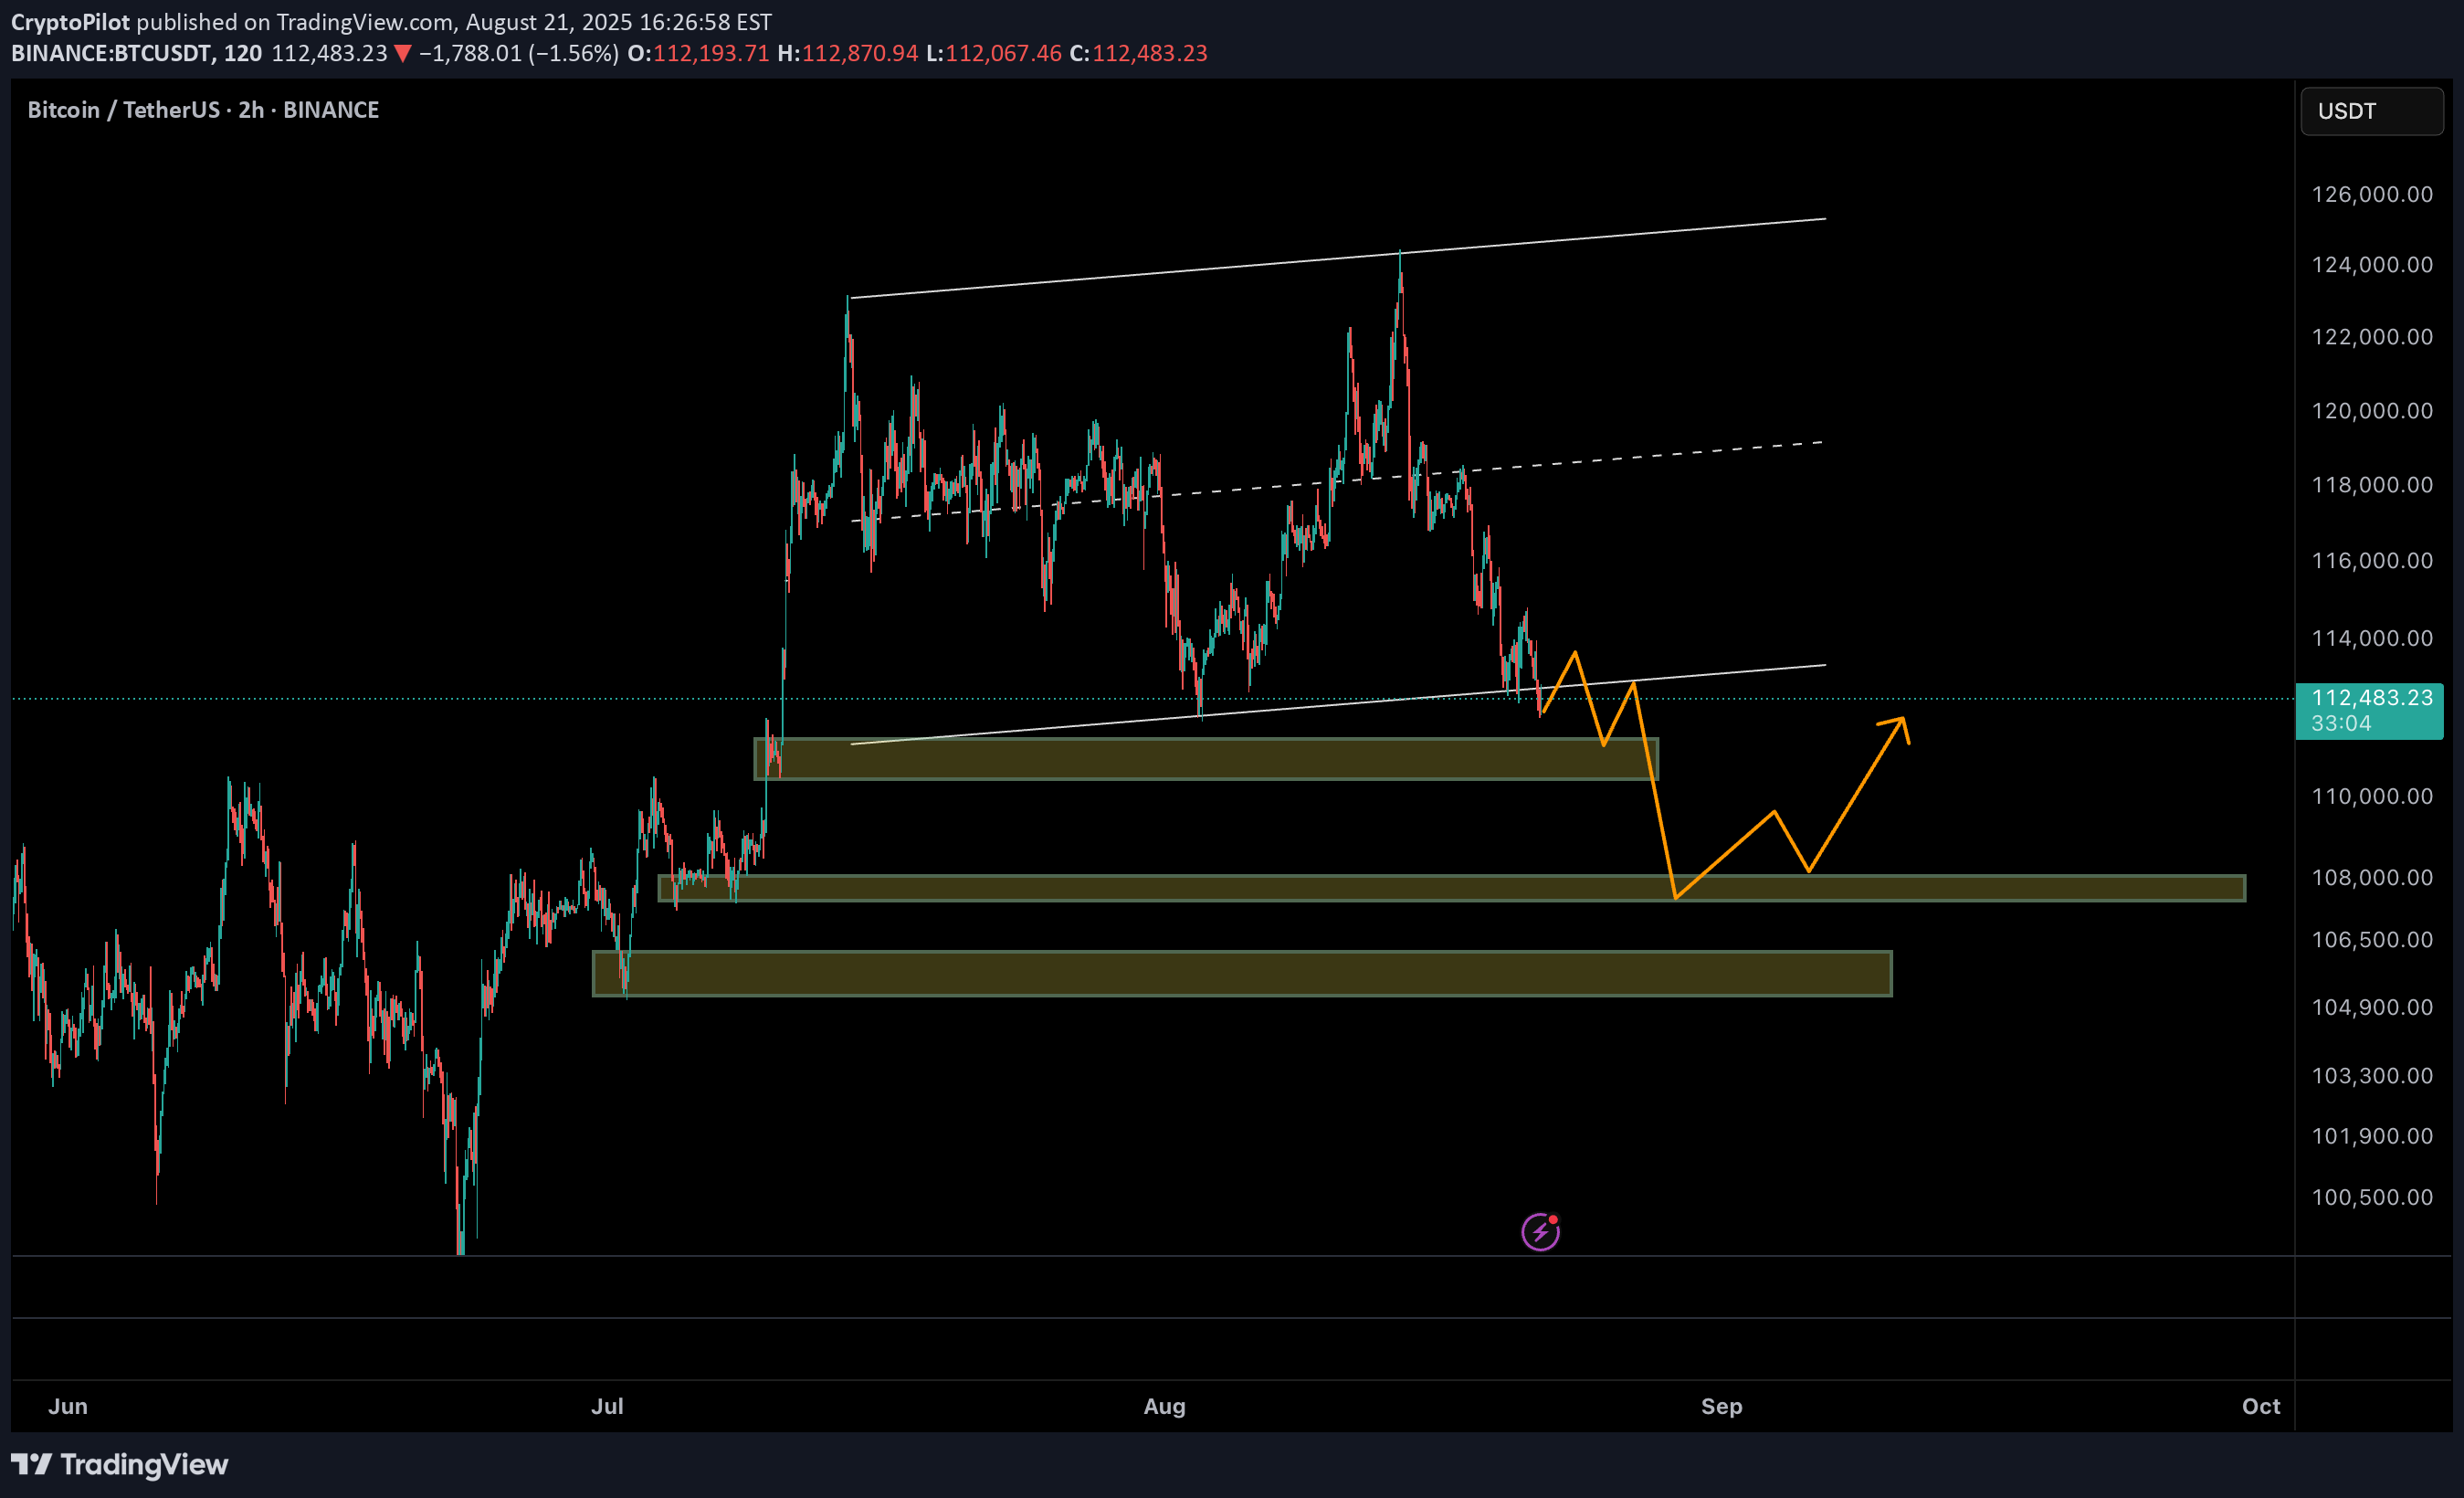
🔔 Following our previous analysis predicting BTC drop to ~112k, we now update the market scenario using Smart Money & Price Action concepts. 📉 As expected, BTC entered a bearish phase after a Break of Structure (BOS) and distribution phase, currently approaching the key liquidity zone 108k–110k. This zone is a strong area for liquidity grab and institutional buy orders. 📌 Probable Scenario: • BTC may touch 108k and then perform a corrective move to 113k–114k. • A breakout above this range (e.g., towards 120k) is not guaranteed and requires reassessment of Price Action at that time. 🔑 Key Points (Smart Money Concepts): • Liquidity below recent lows is still unfilled. • The 108k–110k range acts as a higher timeframe Order Block. • Pullback to 113k–114k could simply be a retracement to the Supply Zone. 📍 Summary: Short-term: higher probability of BTC drop to 108k, followed by a limited recovery to 113k–114k. Further upside continuation or breakout needs reevaluation at that time.
CryptoPilot
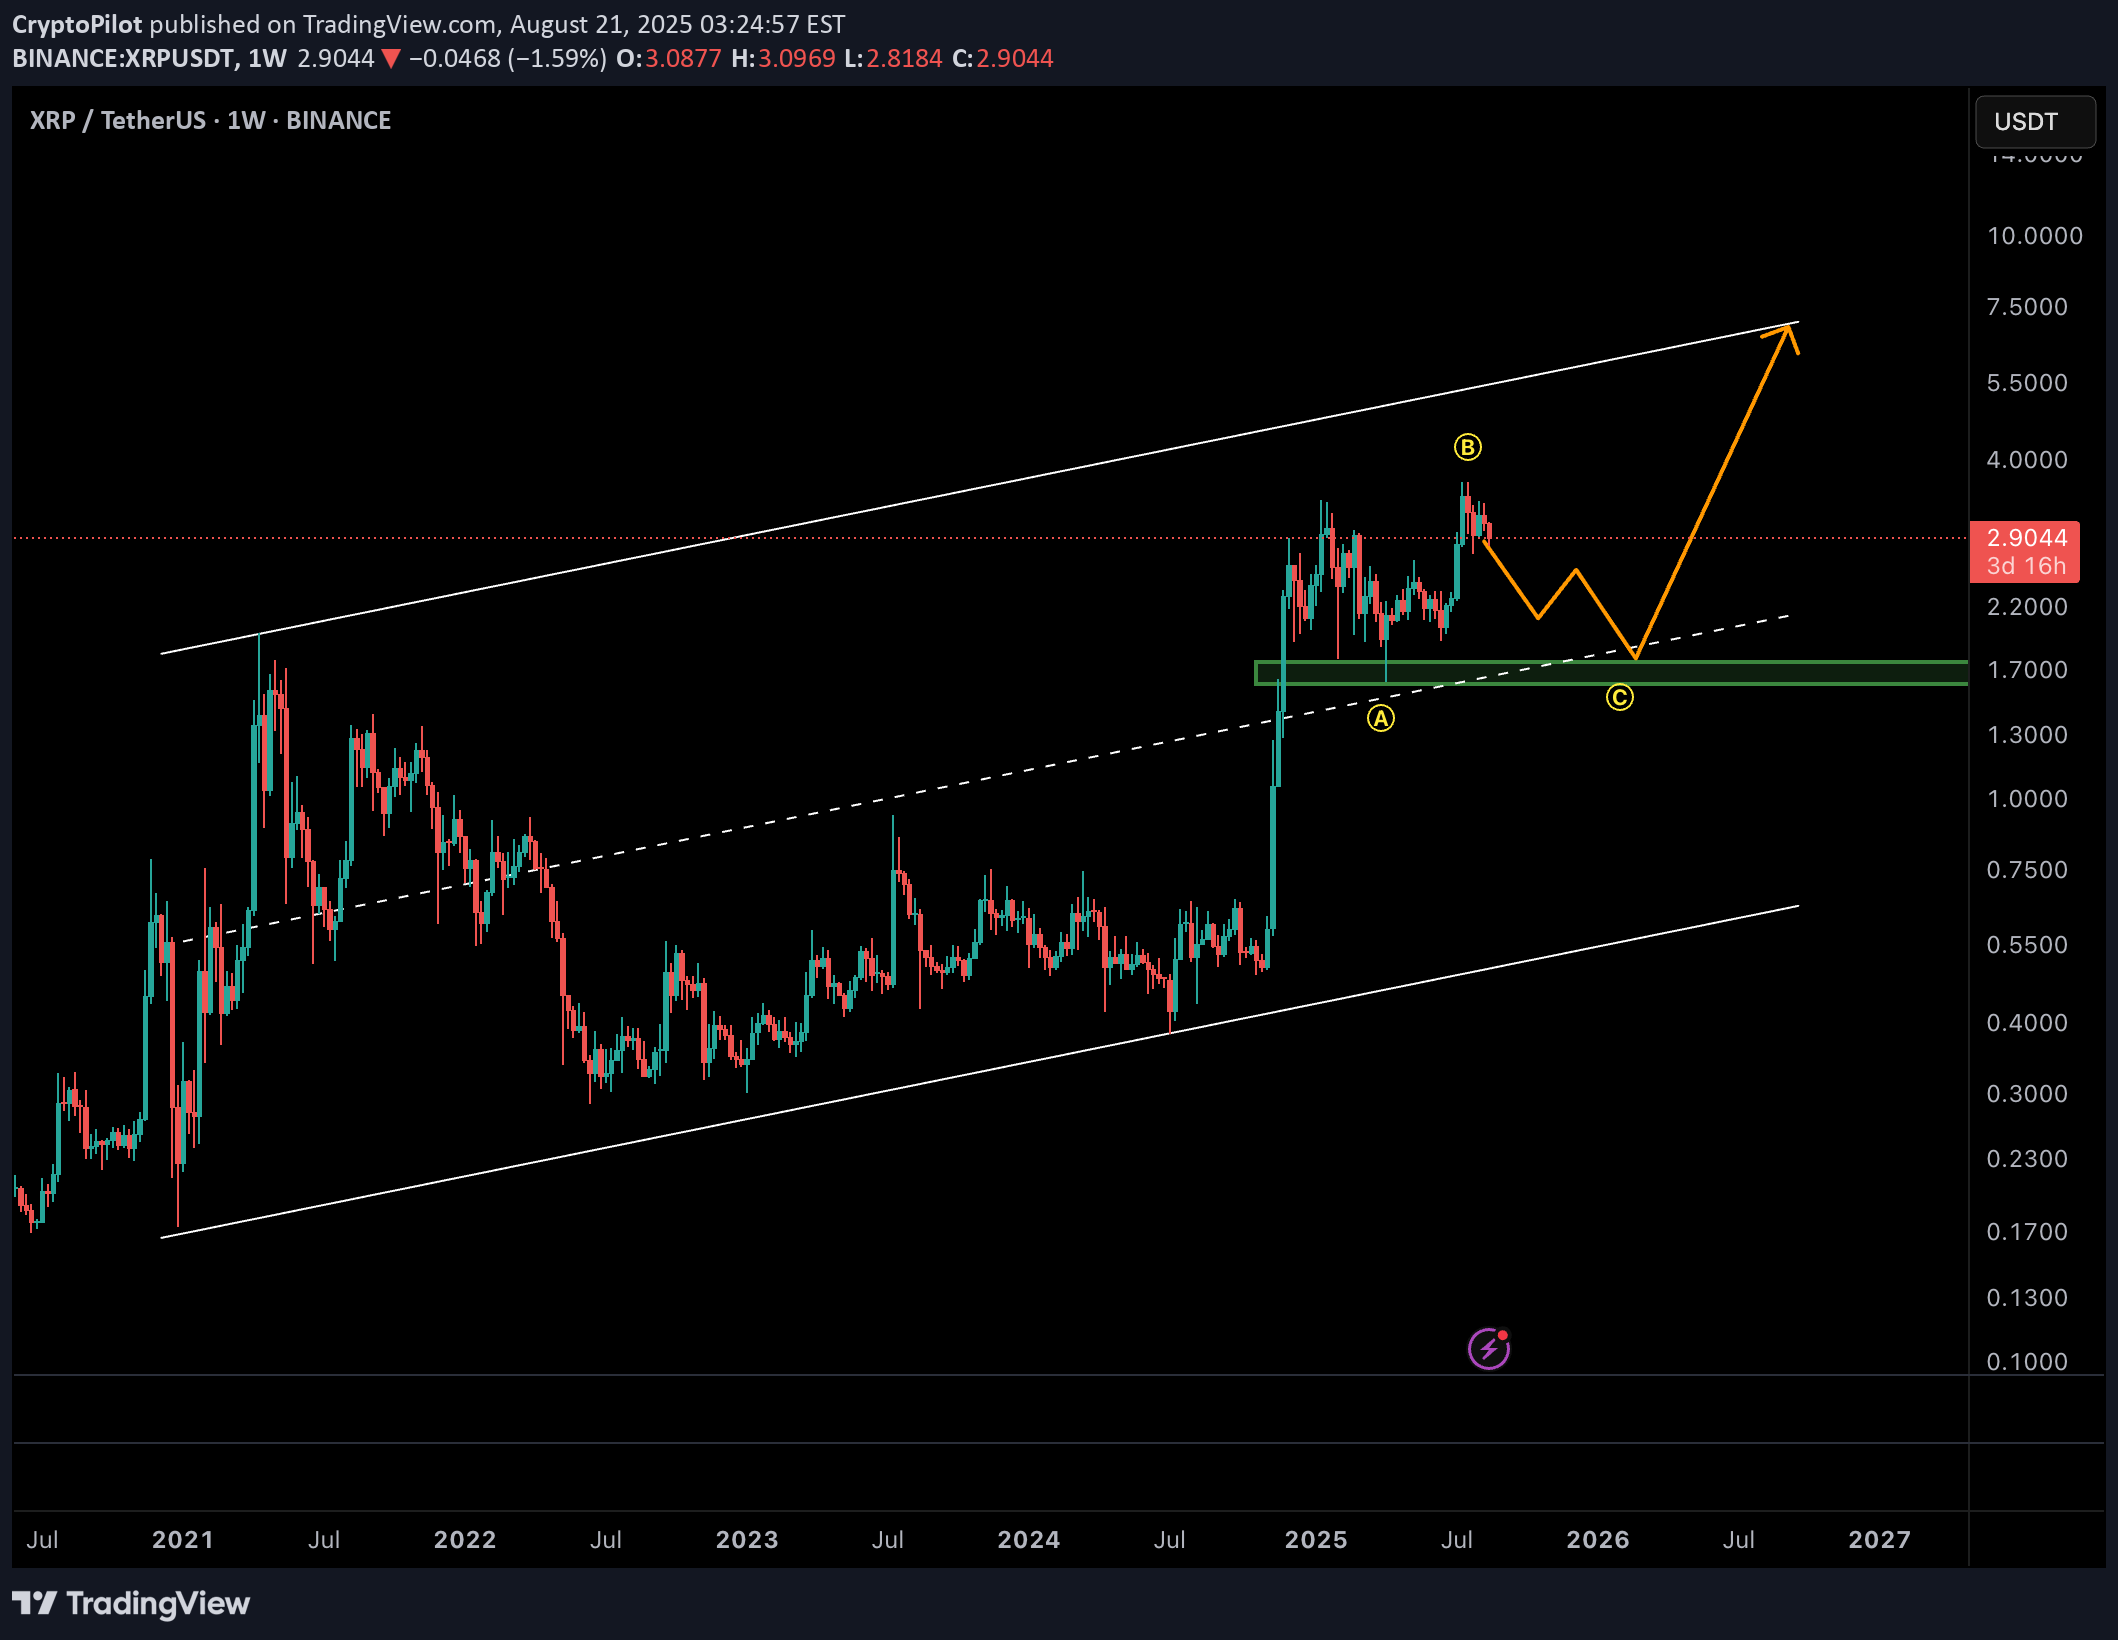
XRP is currently showing signs of completing a corrective structure after its strong bullish rally earlier this year. 🔹 Technical Outlook: •Price is trading inside a long-term ascending channel. •After marking the swing high near $4.0, price seems to be unfolding a ABC corrective wave. •Currently in wave C, with potential downside extension toward the midline of the channel (~$1.9 – $2.0). •This zone also aligns with strong historical support and the 0.618 Fibonacci retracement of the last impulse (confluence area). 🔹 Possible Scenario: 1.Completion of wave C around $1.9 support. 2.Start of a major impulsive leg targeting the upper boundary of the channel around $6.5 – $7.0. 📊 Market Implication: Short-term caution is needed as corrective pressure might continue, but long-term structure still supports a bullish outlook. ✅ Conclusion: As long as XRP holds above $1.7 – $1.9 support zone, the bullish scenario remains valid. Mid/long-term traders may watch this level as a potential re-accumulation zone before the next impulsive rally.
CryptoPilot
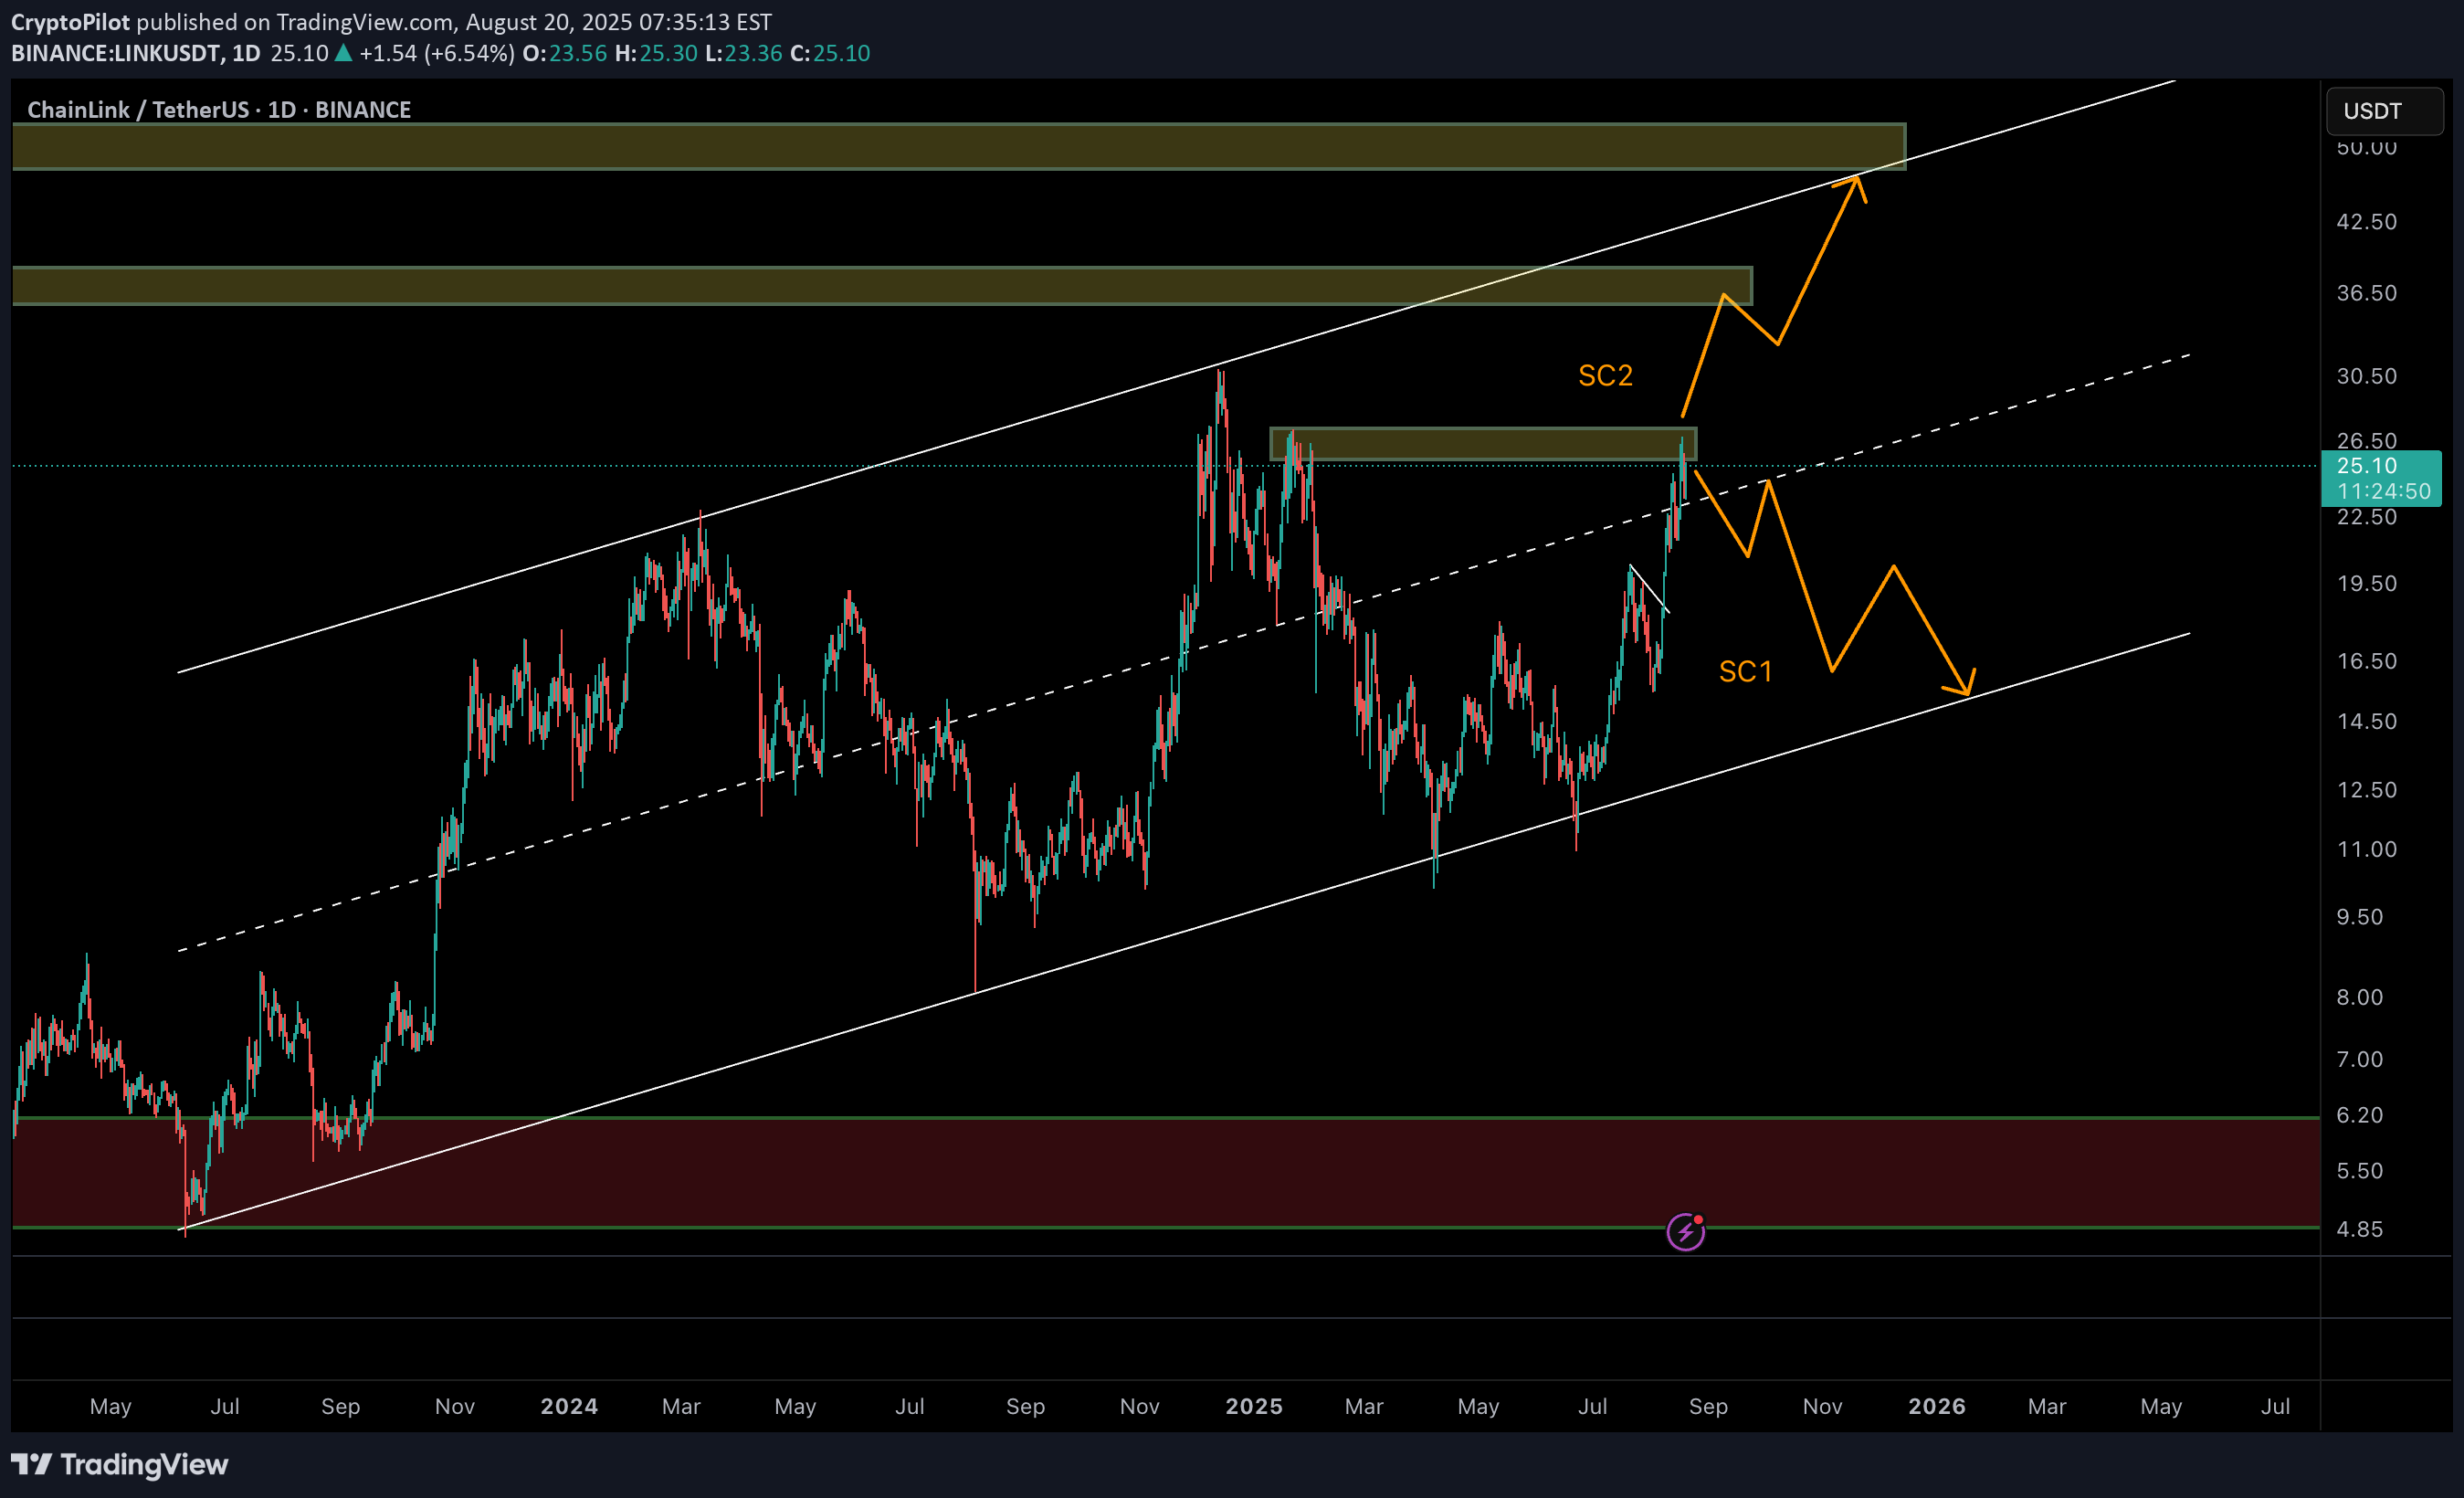
Chainlink is currently trading at $24.9, right below a major resistance zone around $27.3. The price has been moving within a long-term ascending channel since mid-2022, and right now it’s at a decisive point. 🔹 Scenario 1 (More Probable – Bearish Rejection) If LINK fails to break $27.3, we could see a rejection that triggers a correction towards the lower boundary of the ascending channel, around $15–17 (SC1). This aligns with the overextended move and prior rejection patterns. 🔹 Scenario 2 (Bullish Breakout) A successful breakout above $27.3 with strong volume could fuel a rally toward the channel top, targeting the $45–52 zone (SC2). 📊 Technical Notes: •Current resistance: $27.3 (critical decision point). •Support levels: $18–19, then $15–17 (channel support). •Next resistance above $27.3: $34, then $45–52. •Structure: Ascending channel since mid-2022. ✅ Conclusion While both scenarios are valid, the bearish rejection (Scenario 1) seems more likely unless LINK breaks $27.3 with conviction. Traders should watch for rejection signals at current levels before committing.
CryptoPilot
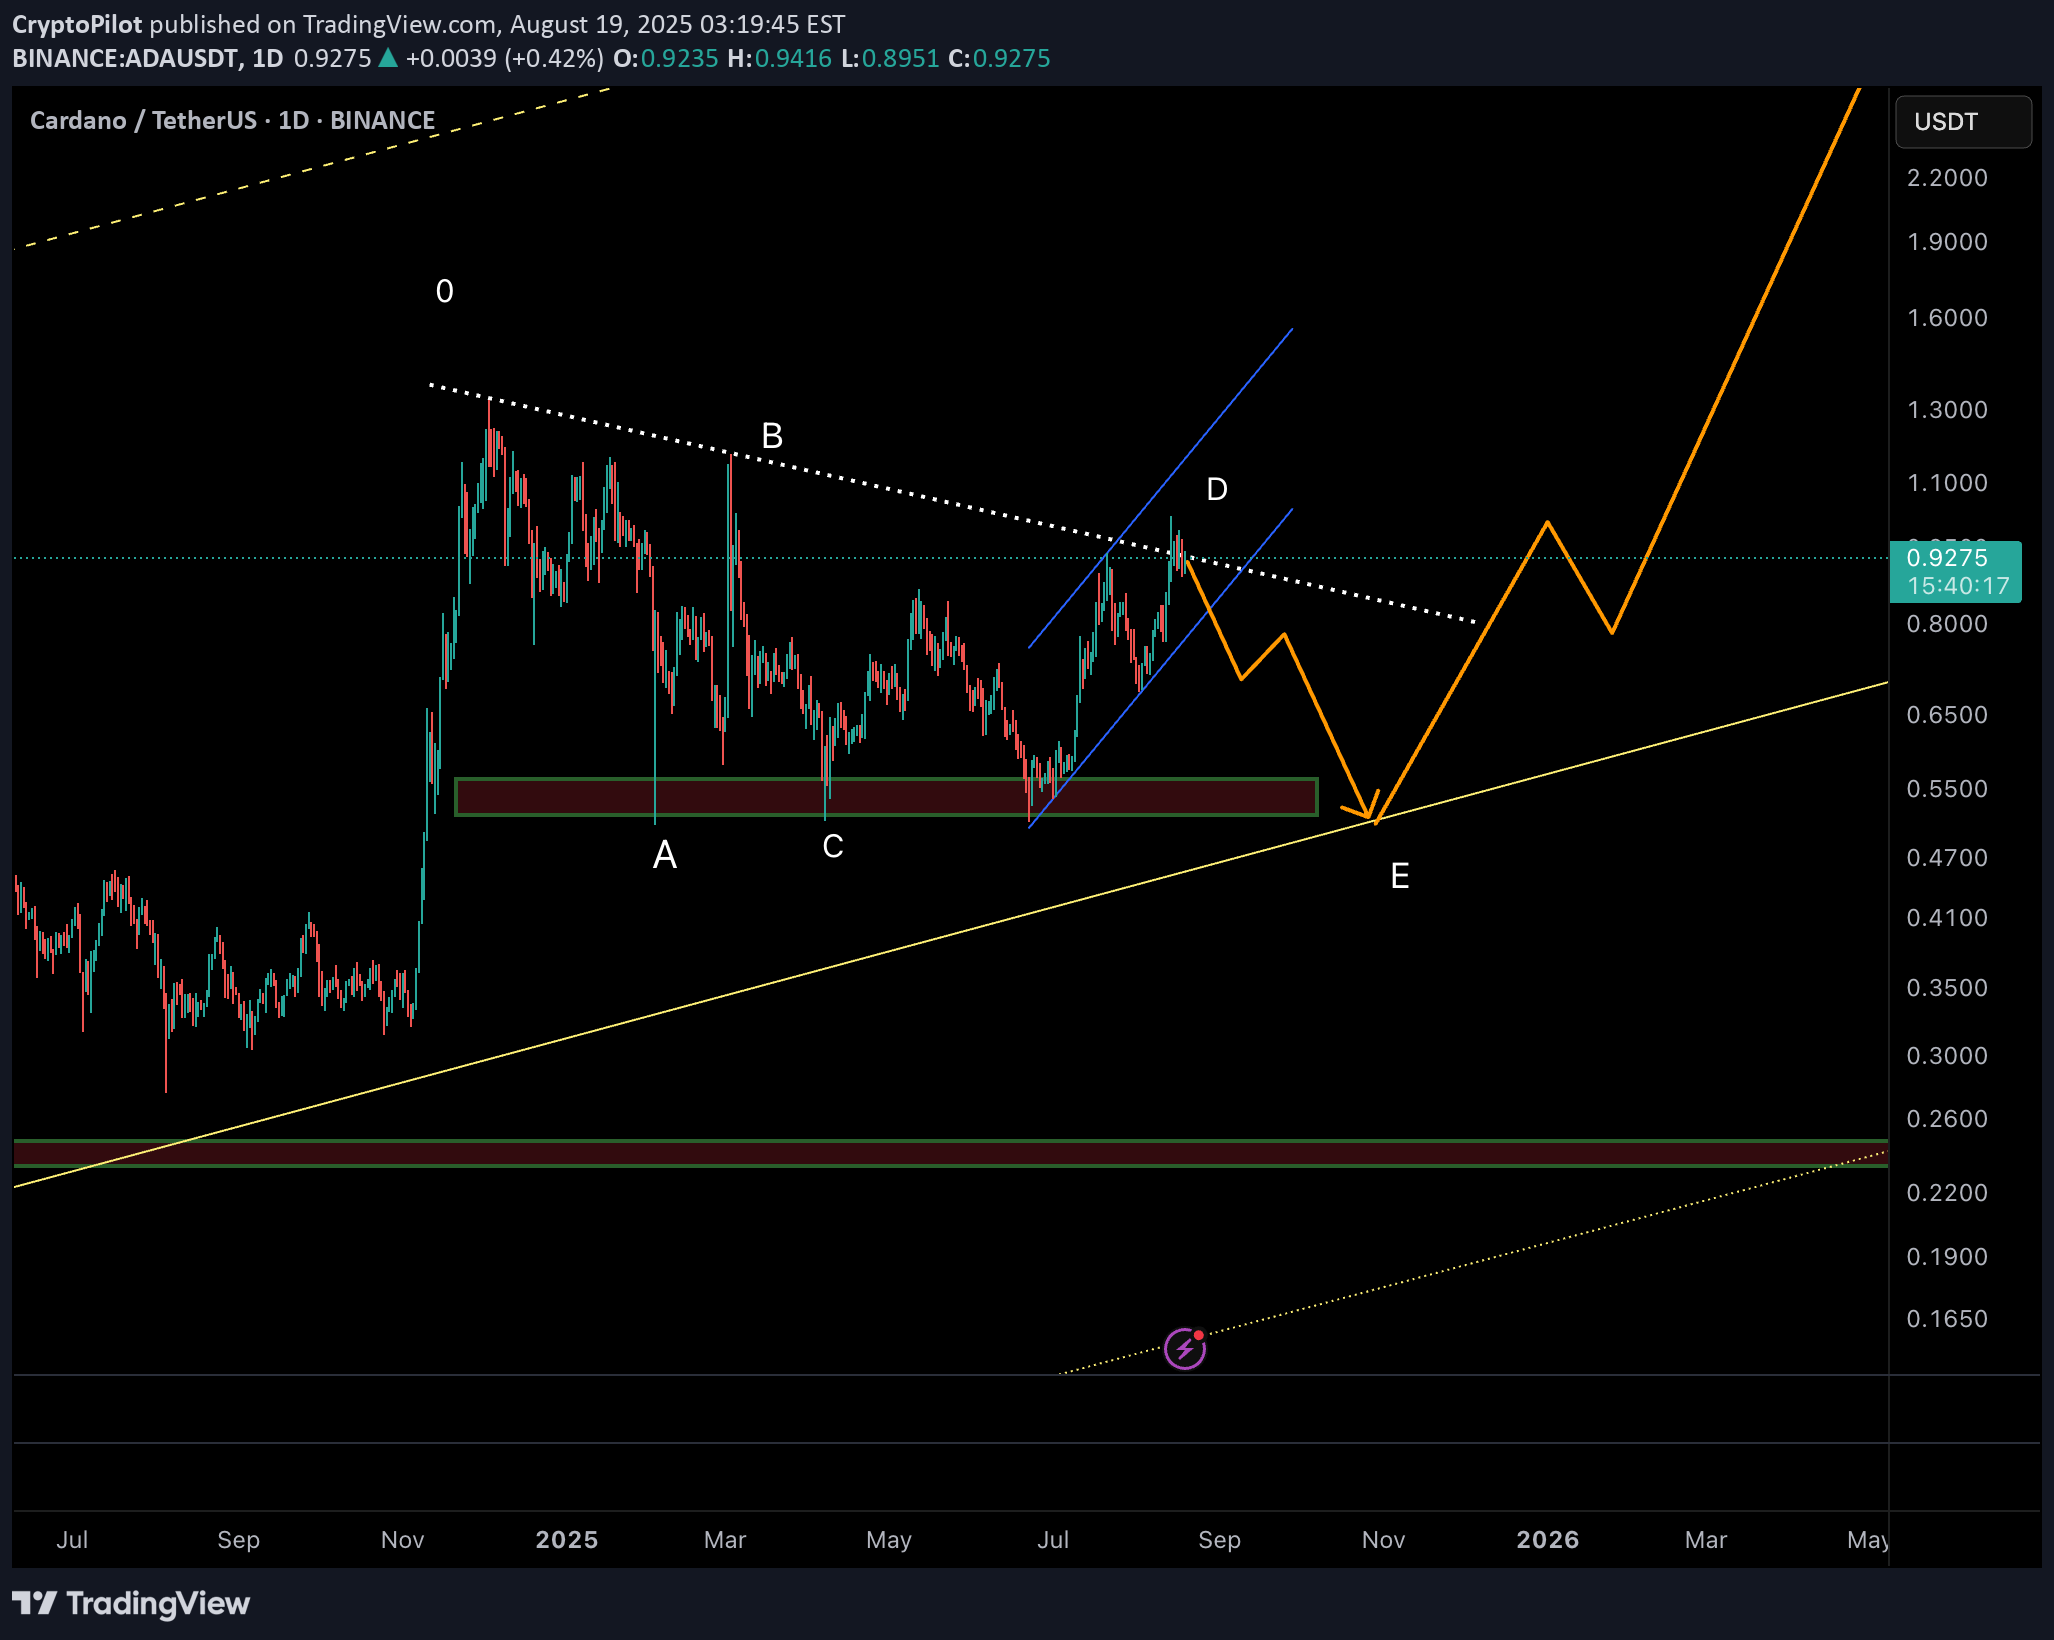
📊 Pattern Overview Cardano is shaping a classic contracting triangle on the daily timeframe, with all legs unfolding as 3-wave zigzags, fully compliant with NeoWave rules. •Wave A: $1.33 → $0.51 (zigzag decline) •Wave B: $0.51 → $1.18 (zigzag rally, ~82% retrace of A) •Wave C: $1.18 → $0.52 (zigzag decline, ~99% retrace of B) •Wave D: $0.52 → $0.92 (zigzag rally, ~61% retrace of C, currently in progress) •Wave E: Expected $0.92 → $0.51 (projected zigzag, targeting channel support) This setup aligns with a contracting triangle, with converging trendlines projecting an apex around November 2025. ⸻ 📉 Near-Term Expectation •Wave E is anticipated to pull ADA back toward $0.51 (long-term channel support). •This would complete the triangle and set the stage for a powerful bullish thrust. ⸻ 🚀 Post-Triangle Outlook •A bullish breakout from the triangle could target: •$1.5 (TP1) •$1.8 (TP2) •This aligns with NeoWave projections of a 75–125% thrust of the channel width. •Break of $0.92 (BOS) will be the confirmation trigger for the rally. ⸻ 🎯 Trading Plan •Entry: Wait for pullback to ~$0.51 (Wave E completion) and BOS confirmation. •Targets: $1.5 – $1.8 •Stop Loss: Below $0.45 •Risk Management: 1–2% capital per trade, trail stops above $1.0 once thrust begins. ⸻ ⚠️ Key Levels •Support: $0.51 (channel bottom) •Resistance: $1.0, then $1.5–$1.8 •Invalidation: Break below $0.45 ⸻ ✅ Summary: Patience is key. A final pullback toward $0.51 could be the last shakeout before a major bullish breakout.
CryptoPilot

CryptoPilot
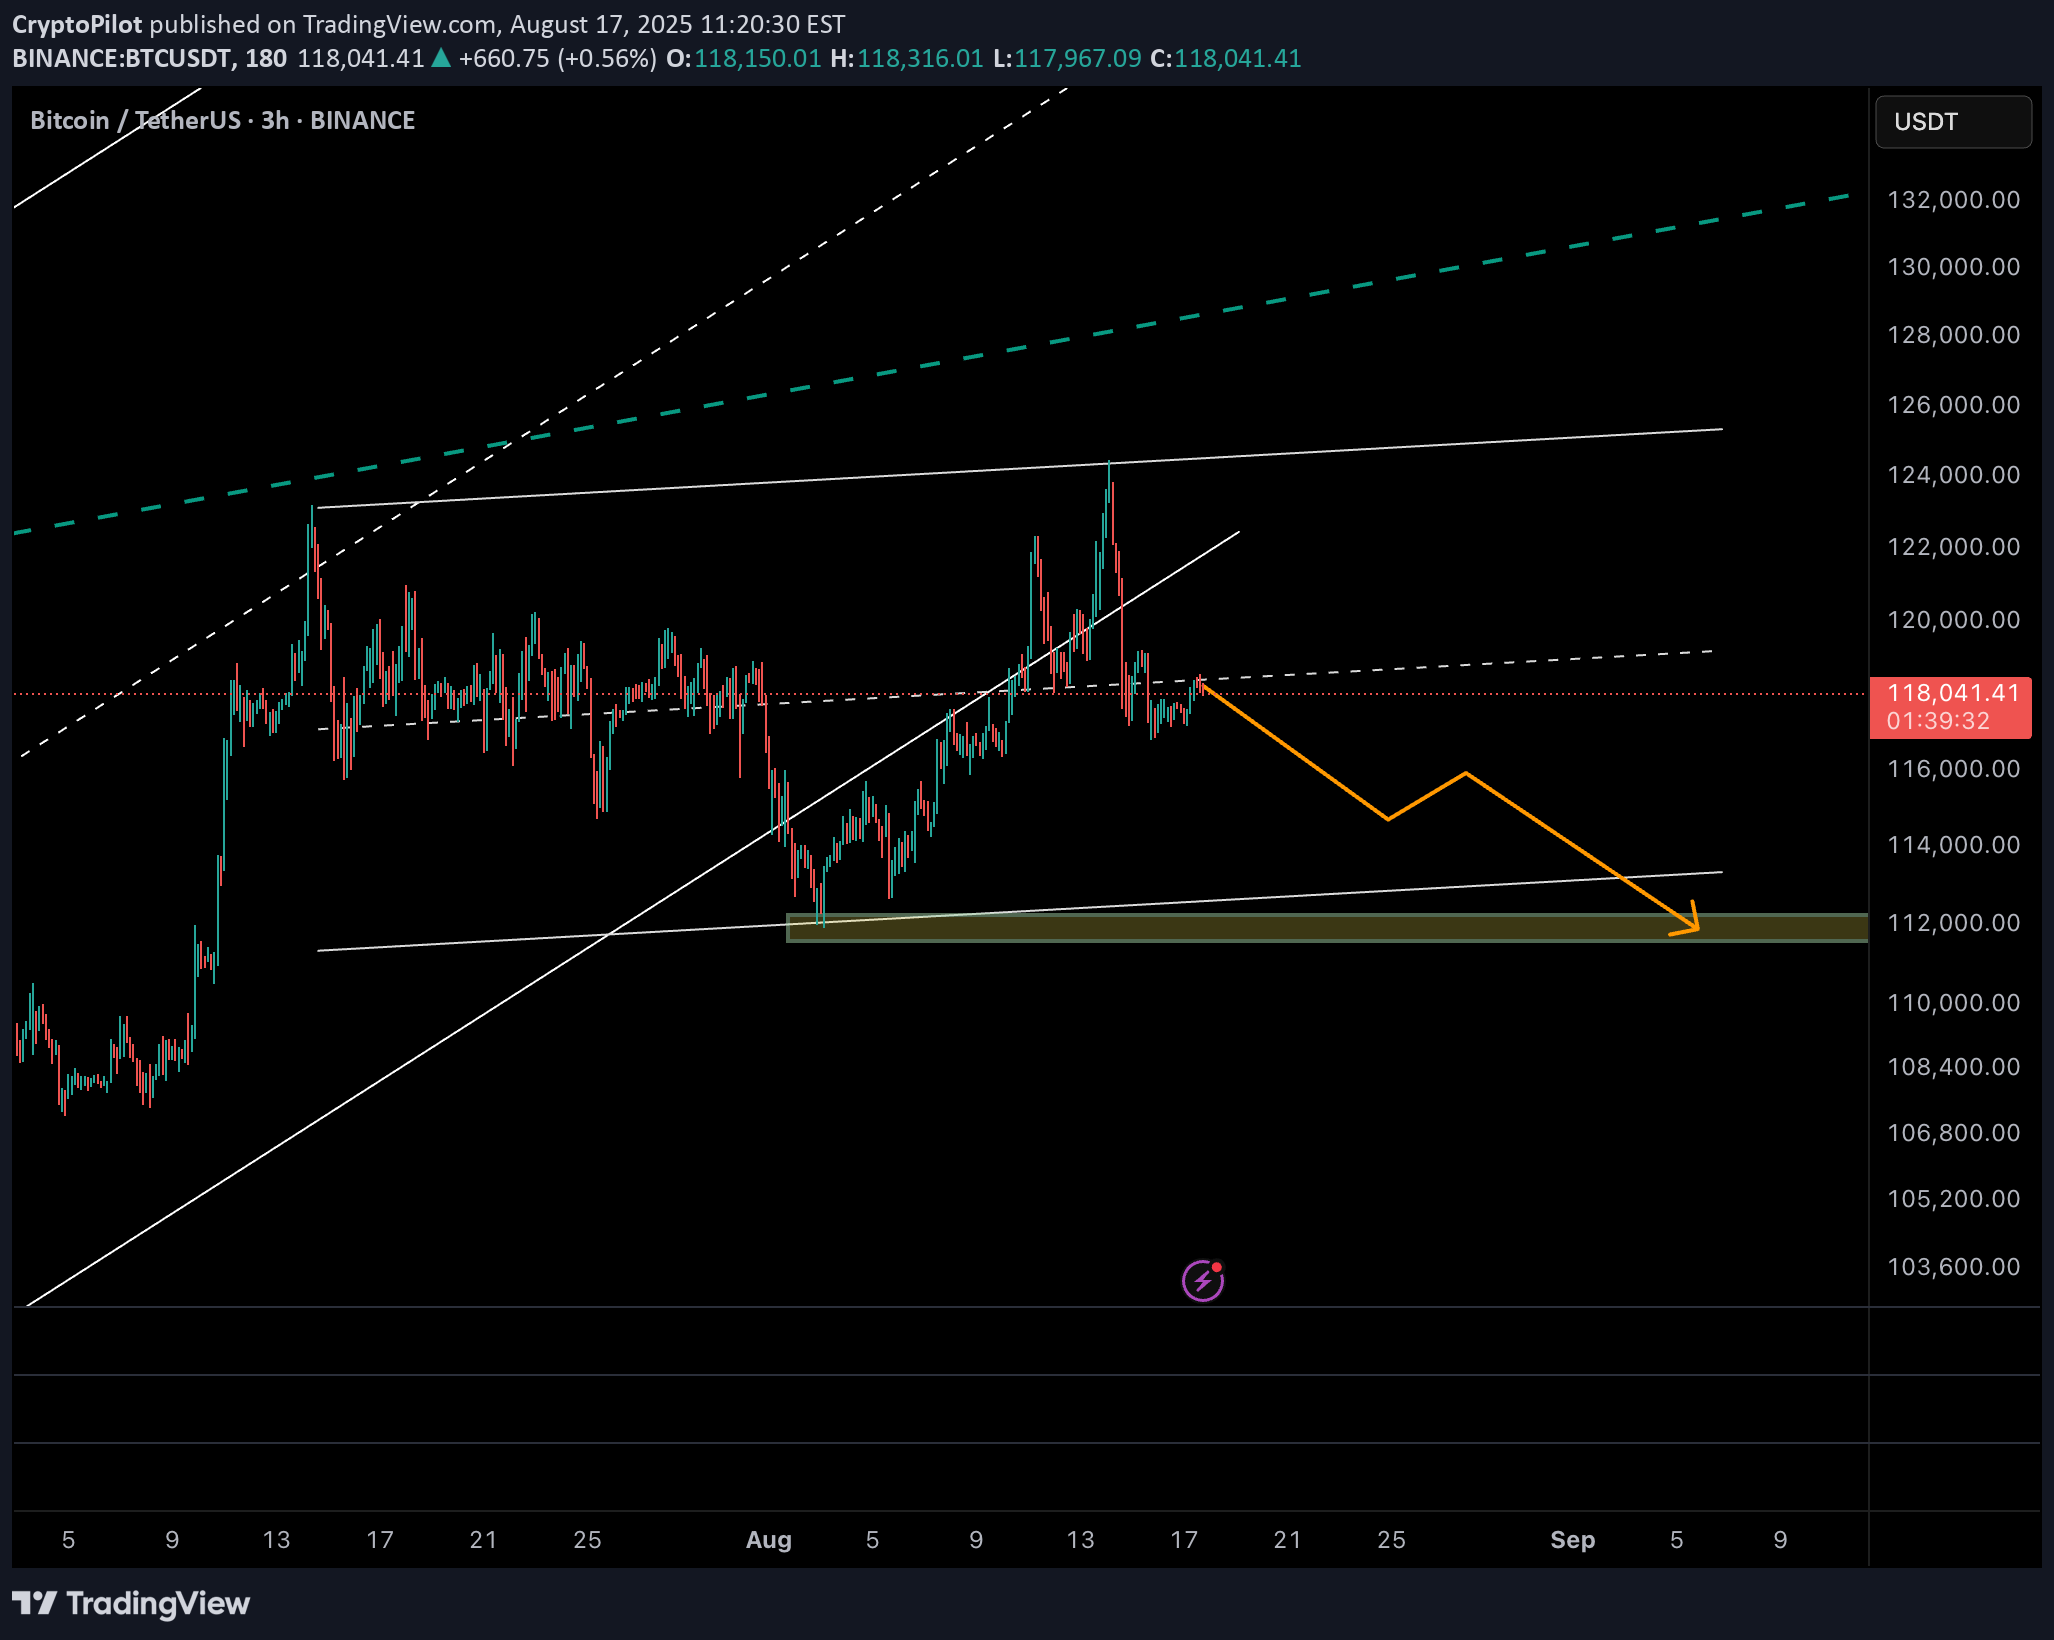
On the 3H chart, Bitcoin is showing signs of weakness after failing to hold above the mid-channel resistance. Price action is rolling over, with a clear break of the short-term trendline and rejection at ~118.5k. 🔹 The structure suggests BTC is forming a corrective leg, with the next major liquidity pool resting near 112,000 – 111,500 (highlighted green zone). This level also aligns with: •Prior demand block & consolidation base •Lower boundary of the short-term channel •Key Fibonacci retracement cluster If buyers fail to defend this zone, we could see acceleration toward the deeper supports around 109k. 📊 Scenario Path (Orange Projection): •Short-term consolidation under 118k •Breakdown continuation toward 114.5k (intermediate support) •Final sweep into 112k liquidity zone before any strong rebound attempt ⚠️ Risk factors: •A reclaim of 121.5k invalidates the bearish scenario and opens the door to retesting 125k. •Watch funding rates & BTC.D — a sudden risk-off move in alts could accelerate the drop. 🎯 Trading Outlook (Not Financial Advice): •Short bias while below 118.5k–121.5k •Main target: 112k •Tight stops required due to volatility
Disclaimer
Any content and materials included in Sahmeto's website and official communication channels are a compilation of personal opinions and analyses and are not binding. They do not constitute any recommendation for buying, selling, entering or exiting the stock market and cryptocurrency market. Also, all news and analyses included in the website and channels are merely republished information from official and unofficial domestic and foreign sources, and it is obvious that users of the said content are responsible for following up and ensuring the authenticity and accuracy of the materials. Therefore, while disclaiming responsibility, it is declared that the responsibility for any decision-making, action, and potential profit and loss in the capital market and cryptocurrency market lies with the trader.