
CryptoNikkoid
@t_CryptoNikkoid

What symbols does the trader recommend buying?
Purchase History
پیام های تریدر
Filter
CryptoNikkoid
اتریوم در آستانه سقوط بزرگ؟ راز کف قیمتی ۲۱۰۰ دلار فاش شد!
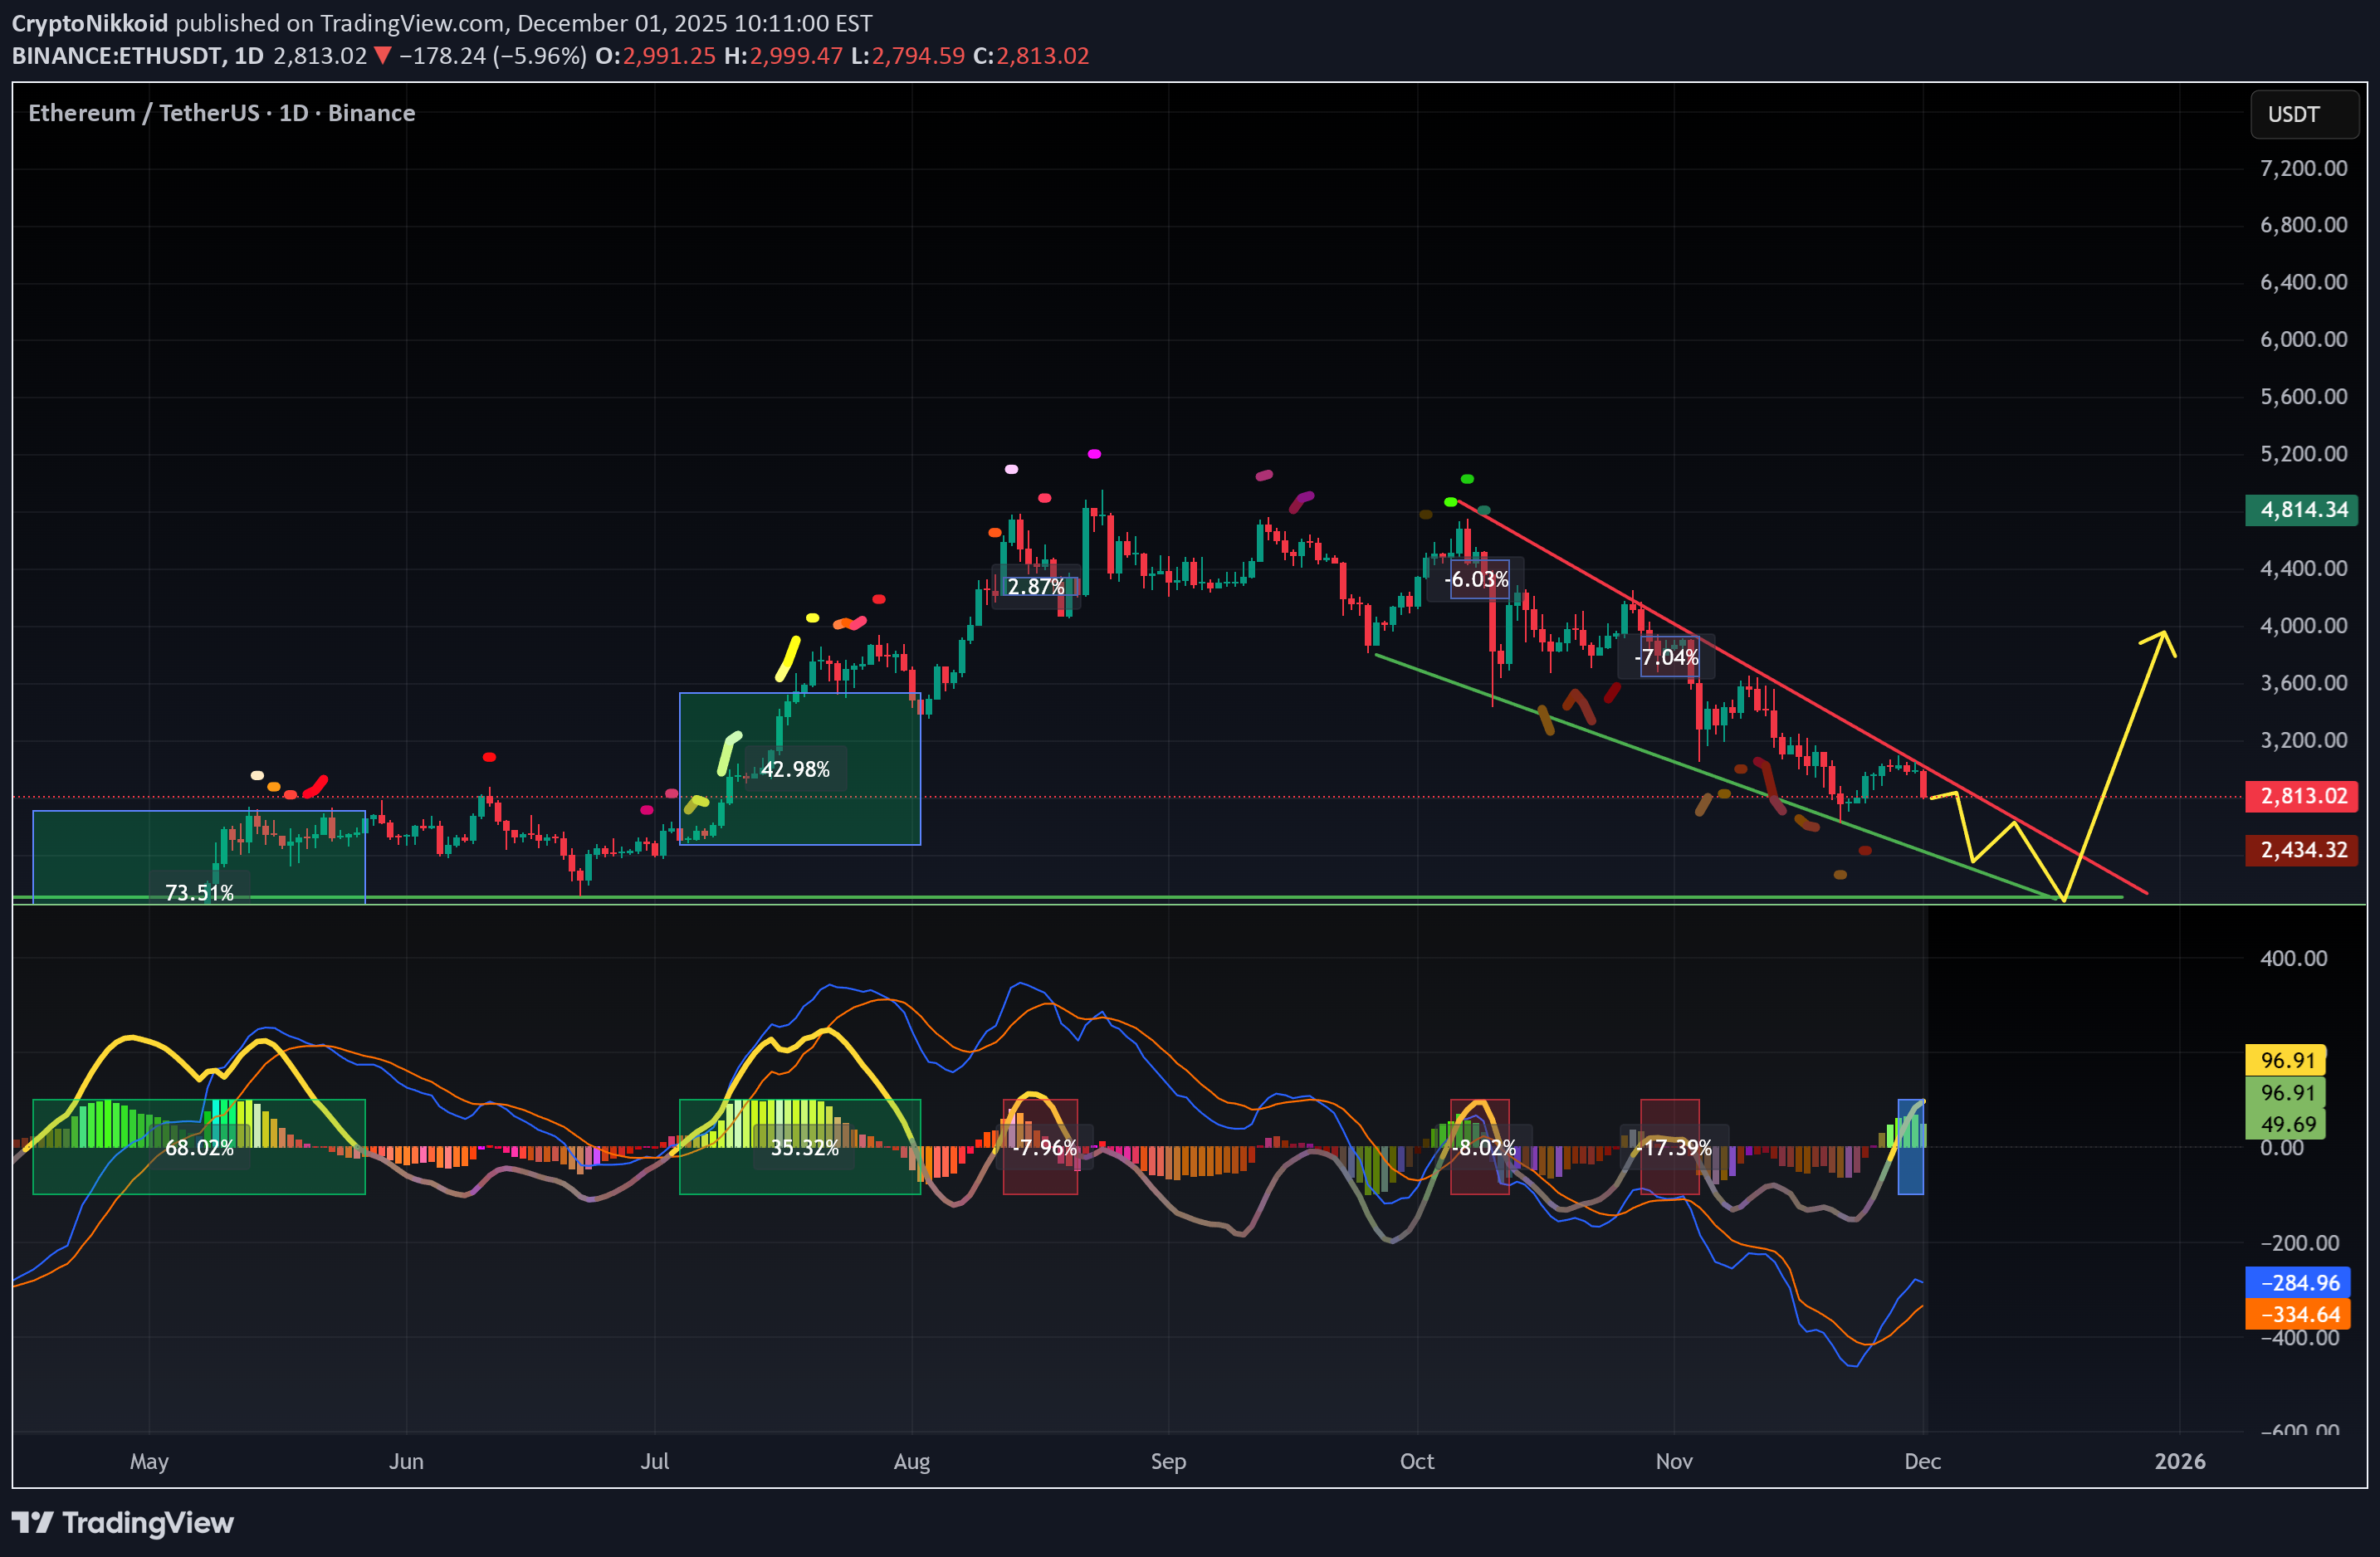
What I’m seeing on the daily chart is pretty clear: The MACD is already deeply oversold, yet Ethereum continues to fall. Normally, such a setup would trigger a technical rebound — but the price action is not following. This tells us one thing: bearish absorption. Whales are unloading into every attempt to push upward, absorbing the buys and slowly forcing the price down. The ETH being sold is still changing hands, and until this process completes, ETH remains pressured to the downside. Because the MACD is extremely oversold, we should expect some technical bounces — but opening a long here is extremely risky. Patience is better than gambling in a downtrend without support beneath your feet. Right now, $2100 looks like the strongest support zone and a likely level for a meaningful bounce. But in a broader bearish environment, even that bounce could just be a short-term relief before a new leg down or a reaccumulation phase. So there’s no need to rush or FOMO into every green candle. Bounces are normal — the trend remains bearish until ETH reaches the demand zone around $2100. And if ETH doesn’t react at that level… that would be a very bad signal. Statistically, $2100 has a high probability of being reached and acting as a solid reaccumulation zone. DYOR #Ethereum #ETH #CryptoAnalysis #TechnicalAnalysis #Altcoins #CryptoTrading #MACD #PriceAction #BearishTrend #SupportZone #CryptoMarket #BTC #CryptoNewsDamn! ETH loves to trap me — not the first time. The day right after I posted this idea, it broke the consolidation channel to the upside. Now every influencer who was depressed 48 hours ago and calling for the end will suddenly flip into full FOMO mode. But let’s stay rational. On the 1D chart, this move is just a small bump. Yes, it’s a breakout — but I still need confirmation of a true trend reversal, especially from TOTAL and $BTC. So far, whales (Wintermute, Binance, Bitget, etc.) and ETF have accumulated roughly 20,000 BTC, which obviously helped pump Bitcoin. But the SPX500 futures are flat, and this whole move could still be a classic bull trap. I’m not closing this idea as “failed” yet. It already happened many times: the market loves to trap people short-term before proving the initial thesis correct. Wait and see.
CryptoNikkoid
جهش بیت کوین: تله نقدینگی یا آغاز روند صعودی؟ (تحلیل کلیدی که نباید از دست بدهید)
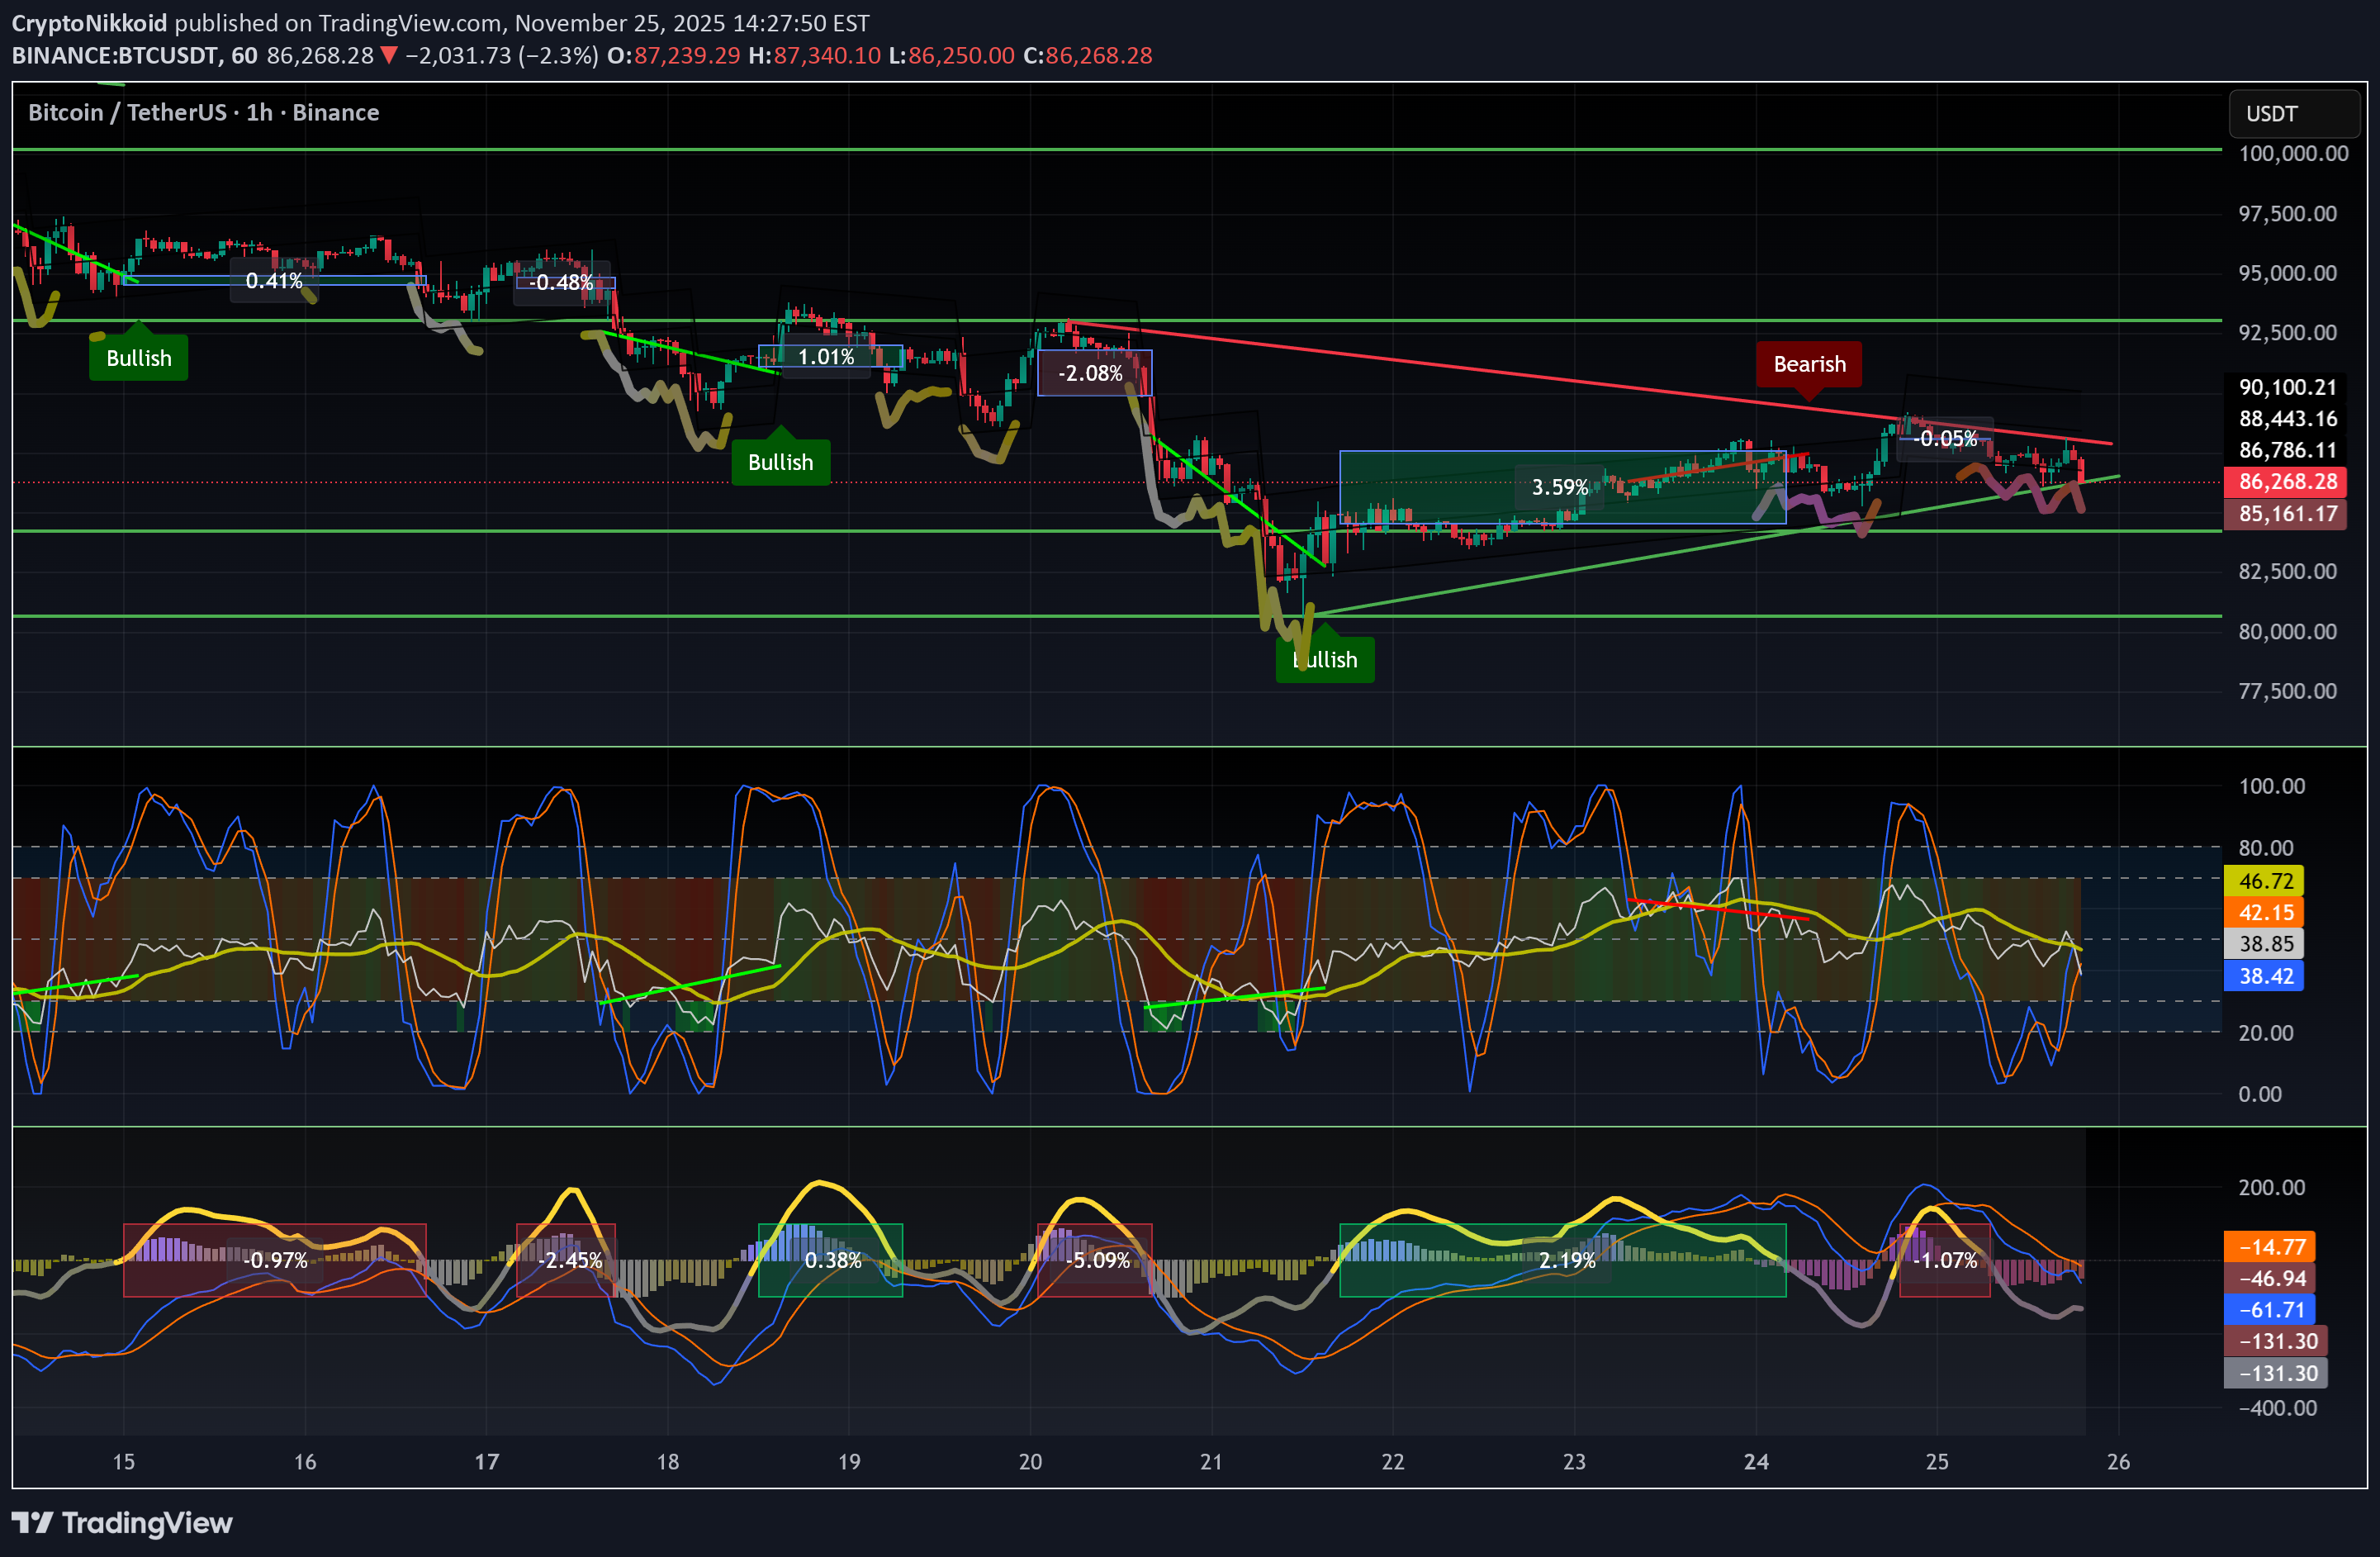
🚫 The Bitcoin bounce is not a trend reversal Here’s why the current move looks more like a liquidity trap than a real bullish reversal: - Momentum is lagging — the rebound isn’t supported by strength. - Liquidity spikes look engineered to squeeze short positions rather than coming from genuine buyers. - ETFs are selling while BTC is pumping → classic exit liquidity behaviour. - We remain in a bearish trend, and the current flag pattern is on the verge of breaking. Statistically, these patterns break down, with targets equal to the size of the previous leg. - Price is rising while volume is falling → this is a hidden bearish divergence on volume. 🎯 What I’m seeing It looks like many institutions were caught off guard by the depth of this downtrend, and now they’re trying to reduce exposure. They appear to be engineering a bounce to attract retail FOMO, allowing them to exit with smaller losses — a classic liquidity extraction move. As I’ve mentioned several times already: 👉 The primary trend remains bearish until Q2 2026, though we should expect bounces and manipulative moves along the way. ⚠️ My advice Don’t deploy all your capital into a fake FOMO rally and become the institutions’ exit liquidity. Wait for a proper bottom confirmation, such as: A W pattern, followed by a successful retest with a higher low. ❌ Invalidation This analysis becomes invalid only if the current pattern breaks upward with strong volume. DYORThe flag pattern broke to the upside, very similar to what happened on the 24th. There’s plenty of liquidity above the range, so another leg up is possible. This move is clearly a liquidity grab, boosted by the SPX pump which is being used as leverage to push BTC upward. The issue with these pumps is always the same: they’re brutal, fast, and leave no time for manual traders to enter. By the time you set up a long (assuming you’re not asleep when it happens), you’re already buying the top or near the top. Then the pump ends, price pulls back –50% of the move, and you’re instantly underwater. (Just look at the chart.) At that point, you have two bad options: Wait for the next leg and hope it recovers (not guaranteed), or Become exit liquidity for the whales, because as soon as you buy, you’re in the red. The only way to catch these moves is basically to roll the dice and hope the consolidation breaks up again at the open — even though the SPX500 futures weren’t really suggesting that. It’s risky, because many times the opposite happens and BTC dumps at the Wall Street open. These are large liquidity deployments by corporations, whales, or exchanges, and insiders know about them in advance. They are designed specifically to leave retail behind. What comes next? Roll the dice… or ask an insider. MACD and RSI are blind here — this is pure price action driven by macro or manipulation. Chart:Most influencers get it wrong, the reason behind the current dump is the 10y bonds in Japan pumping almost 2% The full explanation: x.com/cryptonikkoid/status/1995323559649177720?s=20 The firs to react was the SPX500.F that contaminated BTC then of course all the crypto followed. read my X post to get the full explanation. This means that the odds of a rate cut is fading, and that the consequence of the end of QT will have to wait several months (as expected). Q2 2026 as I always said.
CryptoNikkoid
زمان خرید استراتژیک $PUMP: بهترین نقاط ورود برای سود سریع ۱۰ درصدی!

There’s a strong support zone between $0.02900 and $0.03300. At the current price, PUMP already looks like an attractive buy in my opinion — but if it drops into the green box, I’ll definitely go long. The lower it goes, the better the entry. My plan is simple: ➡️ Enter ➡️ Take profit on a quick +10% move ➡️ Fire and forget This asset is extremely volatile. There will be many more dips and plenty of trading opportunities — so stay cautious, get in and out fast, and don’t get greedy. DYOR.
CryptoNikkoid
سقوط بیت کوین: کف قیمت کجاست و بهترین فرصت خرید چه زمانی است؟

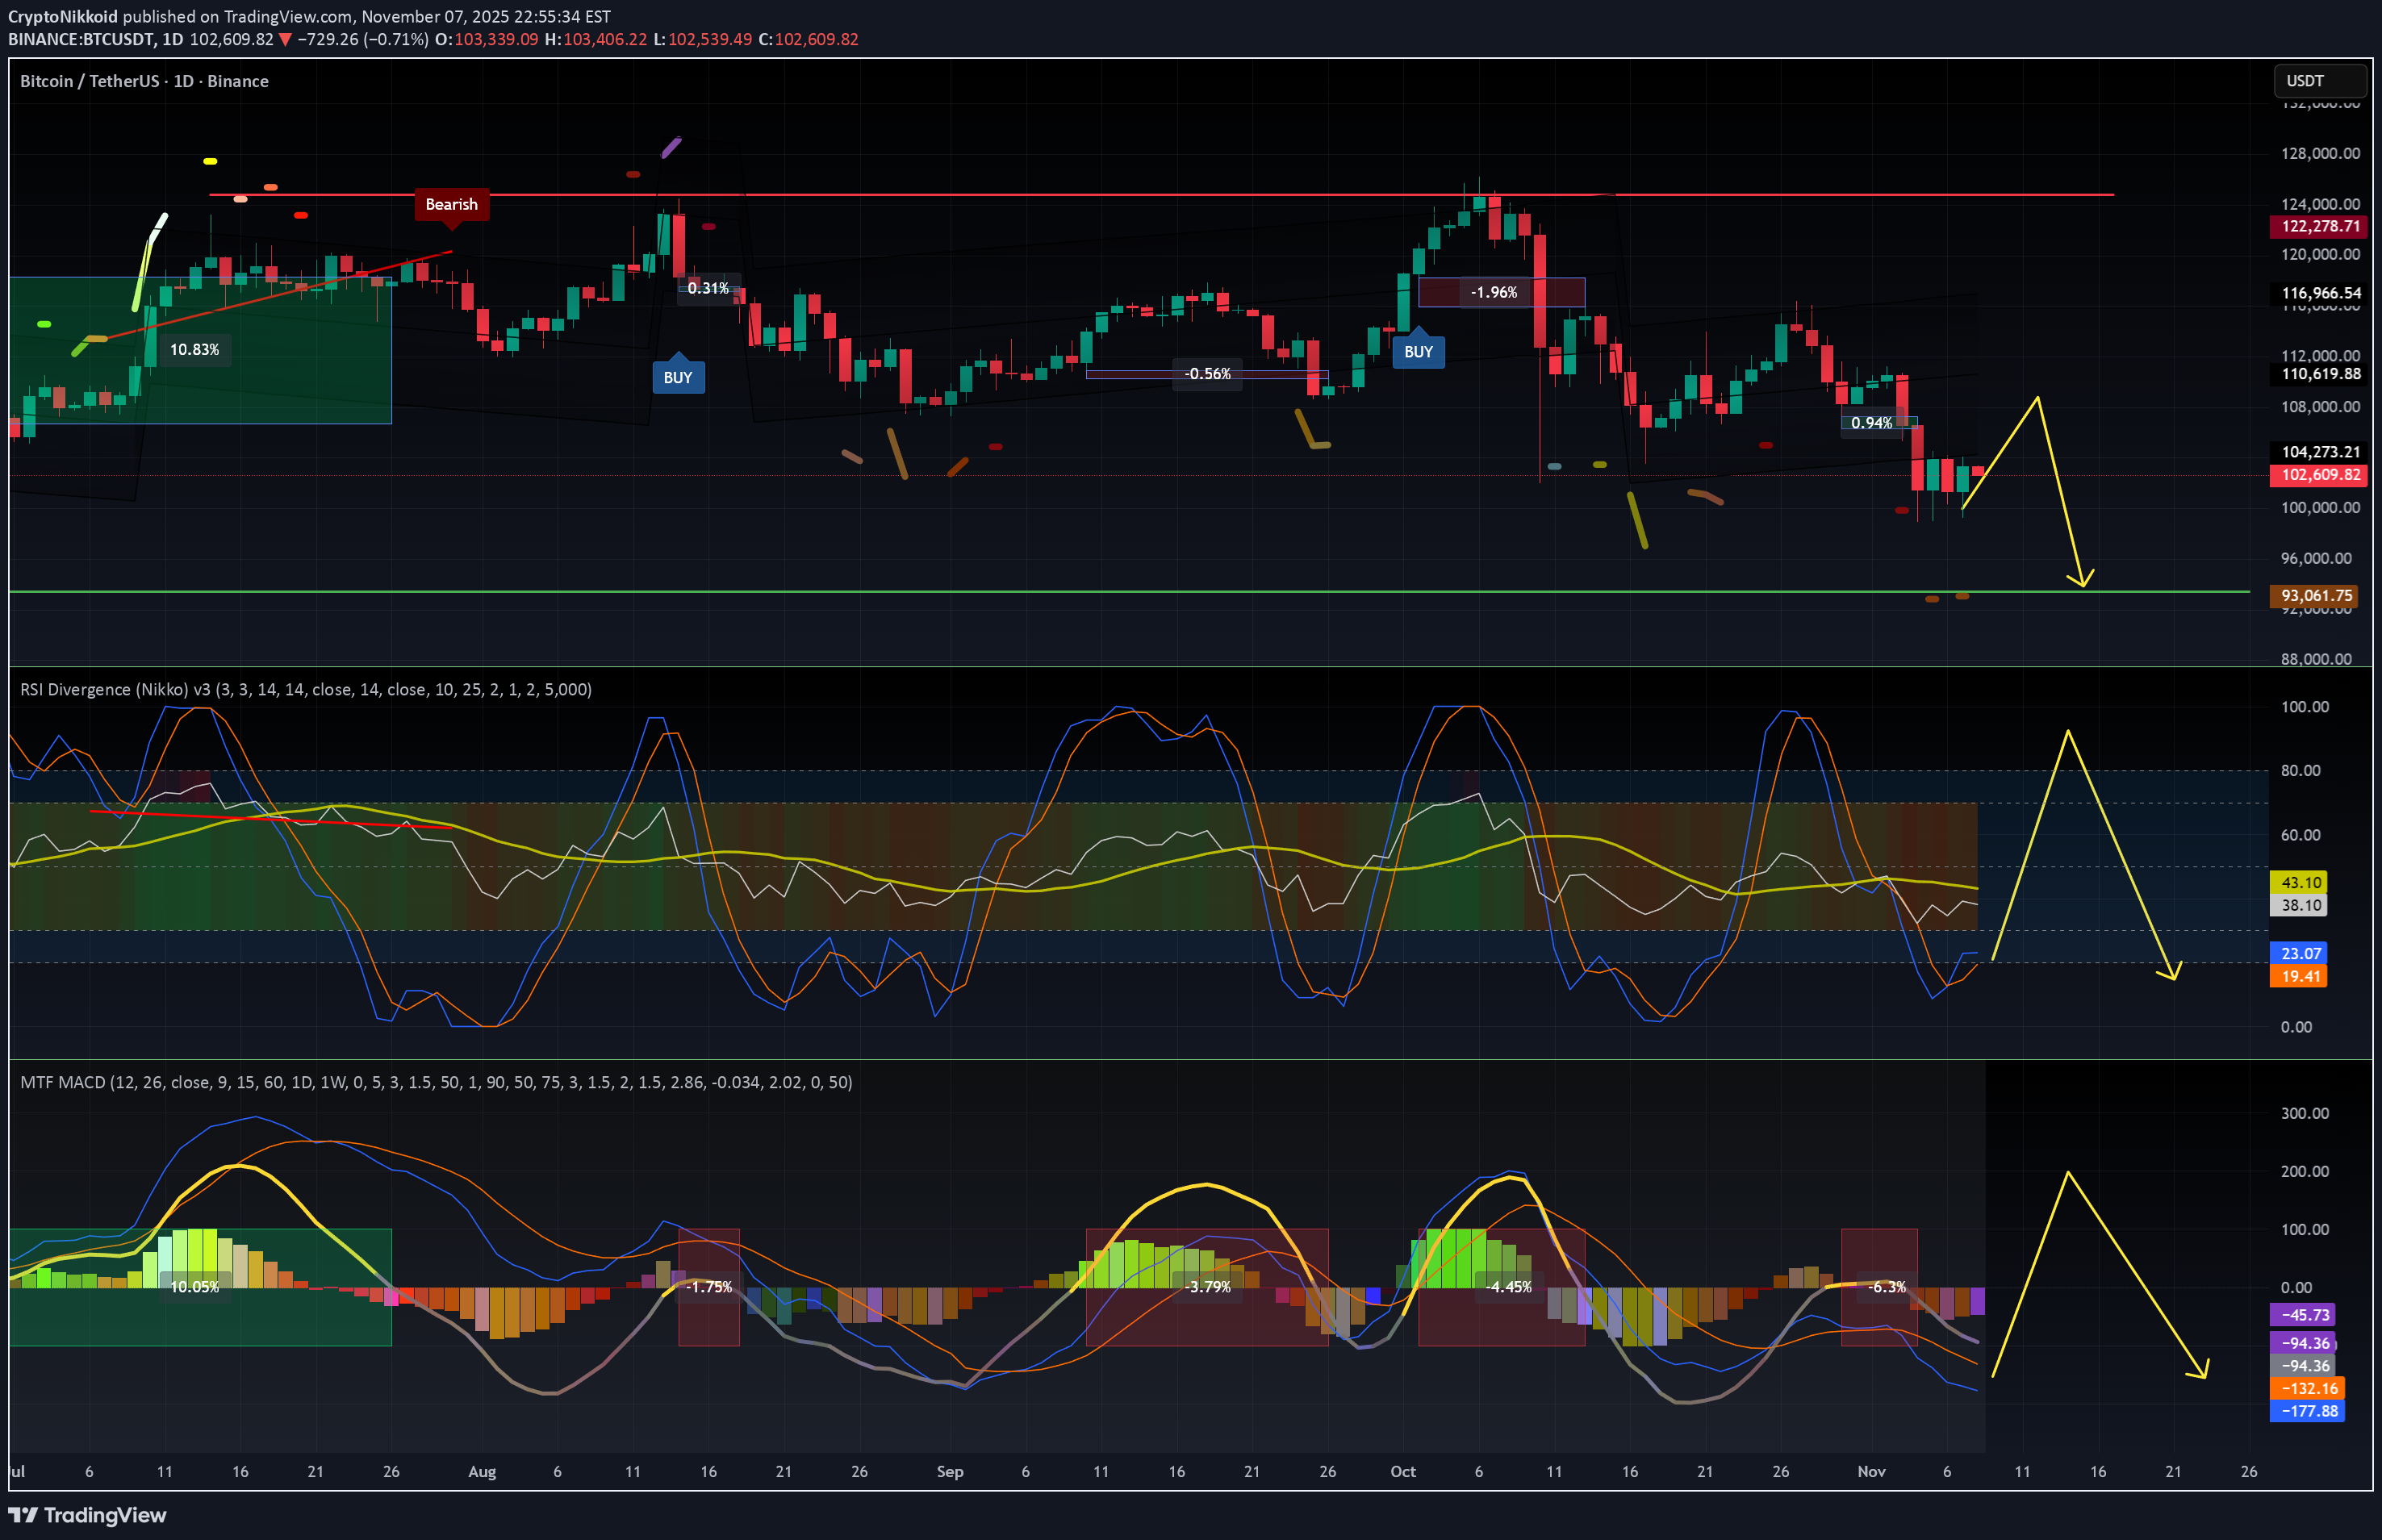
Bitcoin is crashing — and while it looks scary, it’s also one of those rare long-entry opportunities you’ll regret missing once the rebound kicks in. Why is Bitcoin dumping? 1️⃣ A major hedge fund manager shut down his Bitcoin fund. Historically, this kind of event often precedes bubble corrections, creating panic in the market. 2️⃣ The FED won’t publish inflation or unemployment numbers due to the government shutdown. With no data, Powell can’t justify a rate cut. The market is now pricing a “no-cut scenario,” which puts downward pressure on all risk assets — including crypto. 3️⃣ Structural consolidation. I already posted about this: - bullish short-term, - bearish long-term This is exactly what’s happening. The macro downtrend should end around Q2 2026, meaning we’ll likely grind down or range until then. Is this a bear market? Not really. Bitcoin probably won’t see an -80% crash ever again. But a -30% correction? Absolutely possible. What does the chart say? The current correction has a support zone at $94–95k. If that breaks, the next zone is $88k — less likely but still possible. Between now and Q2 2026, we’ll get several relief bounces. If you go long without leverage on strong support zones, you can ride these bounces safely. Where is the opportunity? Buy the fear, sell the greed — classic strategy. Altcoins will bounce even harder than BTC: PEPE , FUN , DeFi coins, memecoins — these always react with double-digit rebounds. The key idea 👉 The best entries happen when everyone is panic-selling. 👉 The best exits happen when everyone is euphoric. Stay smart, stay patient. DYOR. #Bitcoin #CryptoCrash #BTC #Altcoins #CryptoTrading #CryptoAnalysis #CryptoMarket #CryptoInvesting #BTCPrice #BuyTheDip #MarketUpdate #TradingStrategy #TechnicalAnalysis #Macro #RiskManagement #HODL #CryptoNewsFirst target reached at $94k Hopefully Bitcoin will form a bottom and consolidate without further decrease. That was fast. $91k then $88k if this support cannot hold.
CryptoNikkoid
پامپ ناگهانی بیت کوین: تله نهنگها برای نجات داراییها یا شروع رالی جدید؟
On the Macro Side: Metaplanet was on the verge of bankruptcy — their stock dropped from $1,900 to $415 in just five months. Their average Bitcoin buy price sits around $104K, and they had to take on more loans to buy even more BTC, in an attempt to lift the price and save their position. Michael Saylor and MSTR are in a similar situation. MicroStrategy’s stock has fallen from $460 to $236, with an average Bitcoin purchase price around $66K. This puts huge pressure on these institutional treasuries — they cannot afford a bear market. They’re forced to keep buying Bitcoin to prevent a BTC dominance collapse ( BTC.D ) and hold market confidence. In the last two days, altcoins ( OTHERS ) have been outperforming Bitcoin, signaling a possible rotation from BTC to alts. That alone was enough for these mega whales to ignite a quick pump before the weekend, trapping retail traders and preventing massive ETF sell pressure from retail-driven redemptions. On the Chart: Bitcoin is oversold on both RSI and MACD across multiple timeframes. This aligns perfectly with the whales’ attempts to spark a rebound — and may support a short-term bounce lasting 5–7 days. However, don’t be fooled — this looks more like a desperate defense pump than a true trend reversal. The weekly trend remains bearish until at least Q2 2026, and we’ll likely see more bounces and dips along the way. A new all-time high seems unlikely in this macro environment, with a maximum target around 108K before another correction. Stay cautious. Don’t FOMO into this move — it’s engineered to protect treasury positions, not to start a new bull run. Things will truly turn bullish only when Powell is replaced, QE restarts, or a major macro catalyst (like a government resolution) happens. DYOR. Stay smart. Don’t chase hype. #Bitcoin #CryptoMarket #BTC #Altcoins #CryptoNews #CryptoAnalysis #Macro #Whales #MarketUpdate #BTCUSD #AltcoinSeason #Investing #Trading #CryptoTrends #MSTR #Metaplanet #CryptoCrash #CryptoStrategy #DYOR
CryptoNikkoid
خرید مجدد آوالانچ (AVAX): آیا این کف قیمت برای پامپ بزرگ بعدی است؟
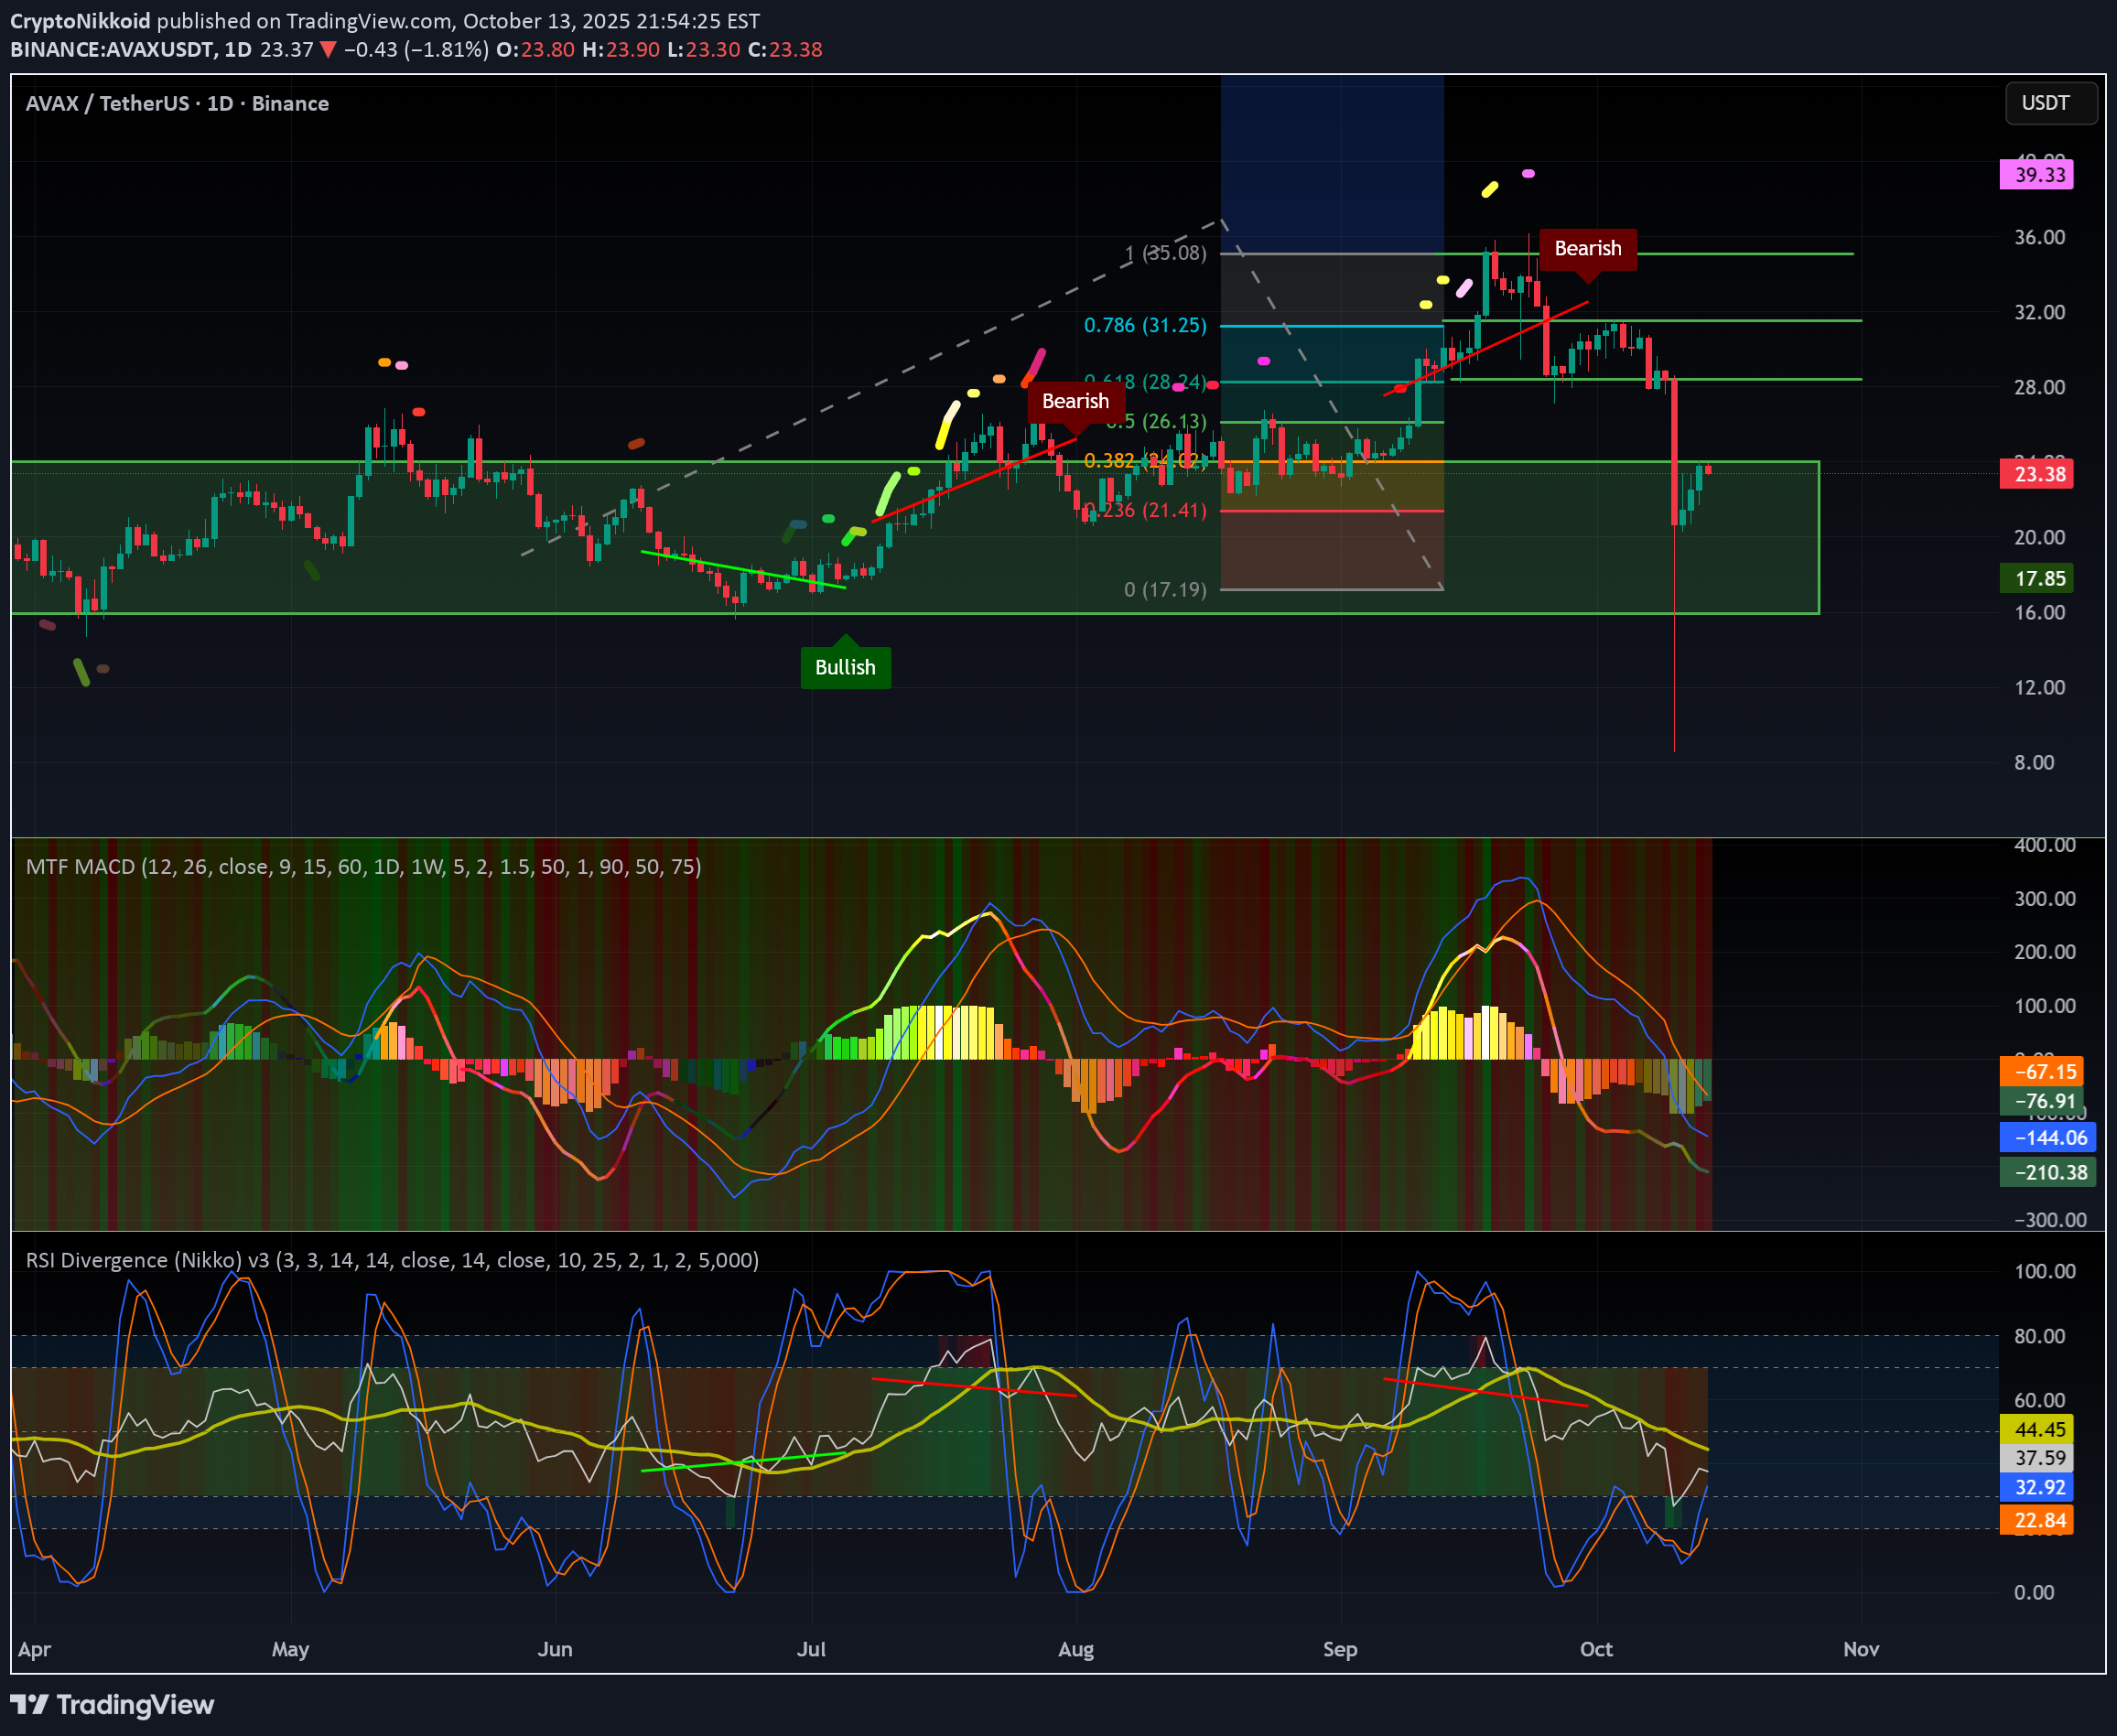
AVAX remains a solid project that’s not going anywhere. It’s now evolving into a game-oriented blockchain, which adds an interesting new use case to what was once a fairly mature ecosystem. The current price range of $22–$23 sits in a strong demand zone, a level that has historically triggered major pumps. With the Multi Timeframe MACD deeply oversold, the RSI low, and the Stochastic RSI bottomed out on the 1D, this looks like an excellent opportunity to build a position with a favorable risk/reward ratio. It may take some time to fully clear the bearish divergence from the last rally, but the October 11th crash likely reset the structure — suggesting a bullish outlook moving forward. Fibonacci targets: 🎯 TP1: $28.5 🎯 TP2: $31.4 🎯 TP3: $35.08 If the market enters a true altseason, AVAX could climb significantly higher — but for now, these are the most reasonable targets. As always, DYOR before entering any trade. #AVAX #CryptoAnalysis #Altcoins #TechnicalAnalysis #RSI #MACD #StochasticRSI #TradingSetup #Bullish #GameFi #Altseason #DYOR
CryptoNikkoid
خرید INJ در منطقه طلایی: آیا زمان پر کردن کیفها فرا رسیده است؟
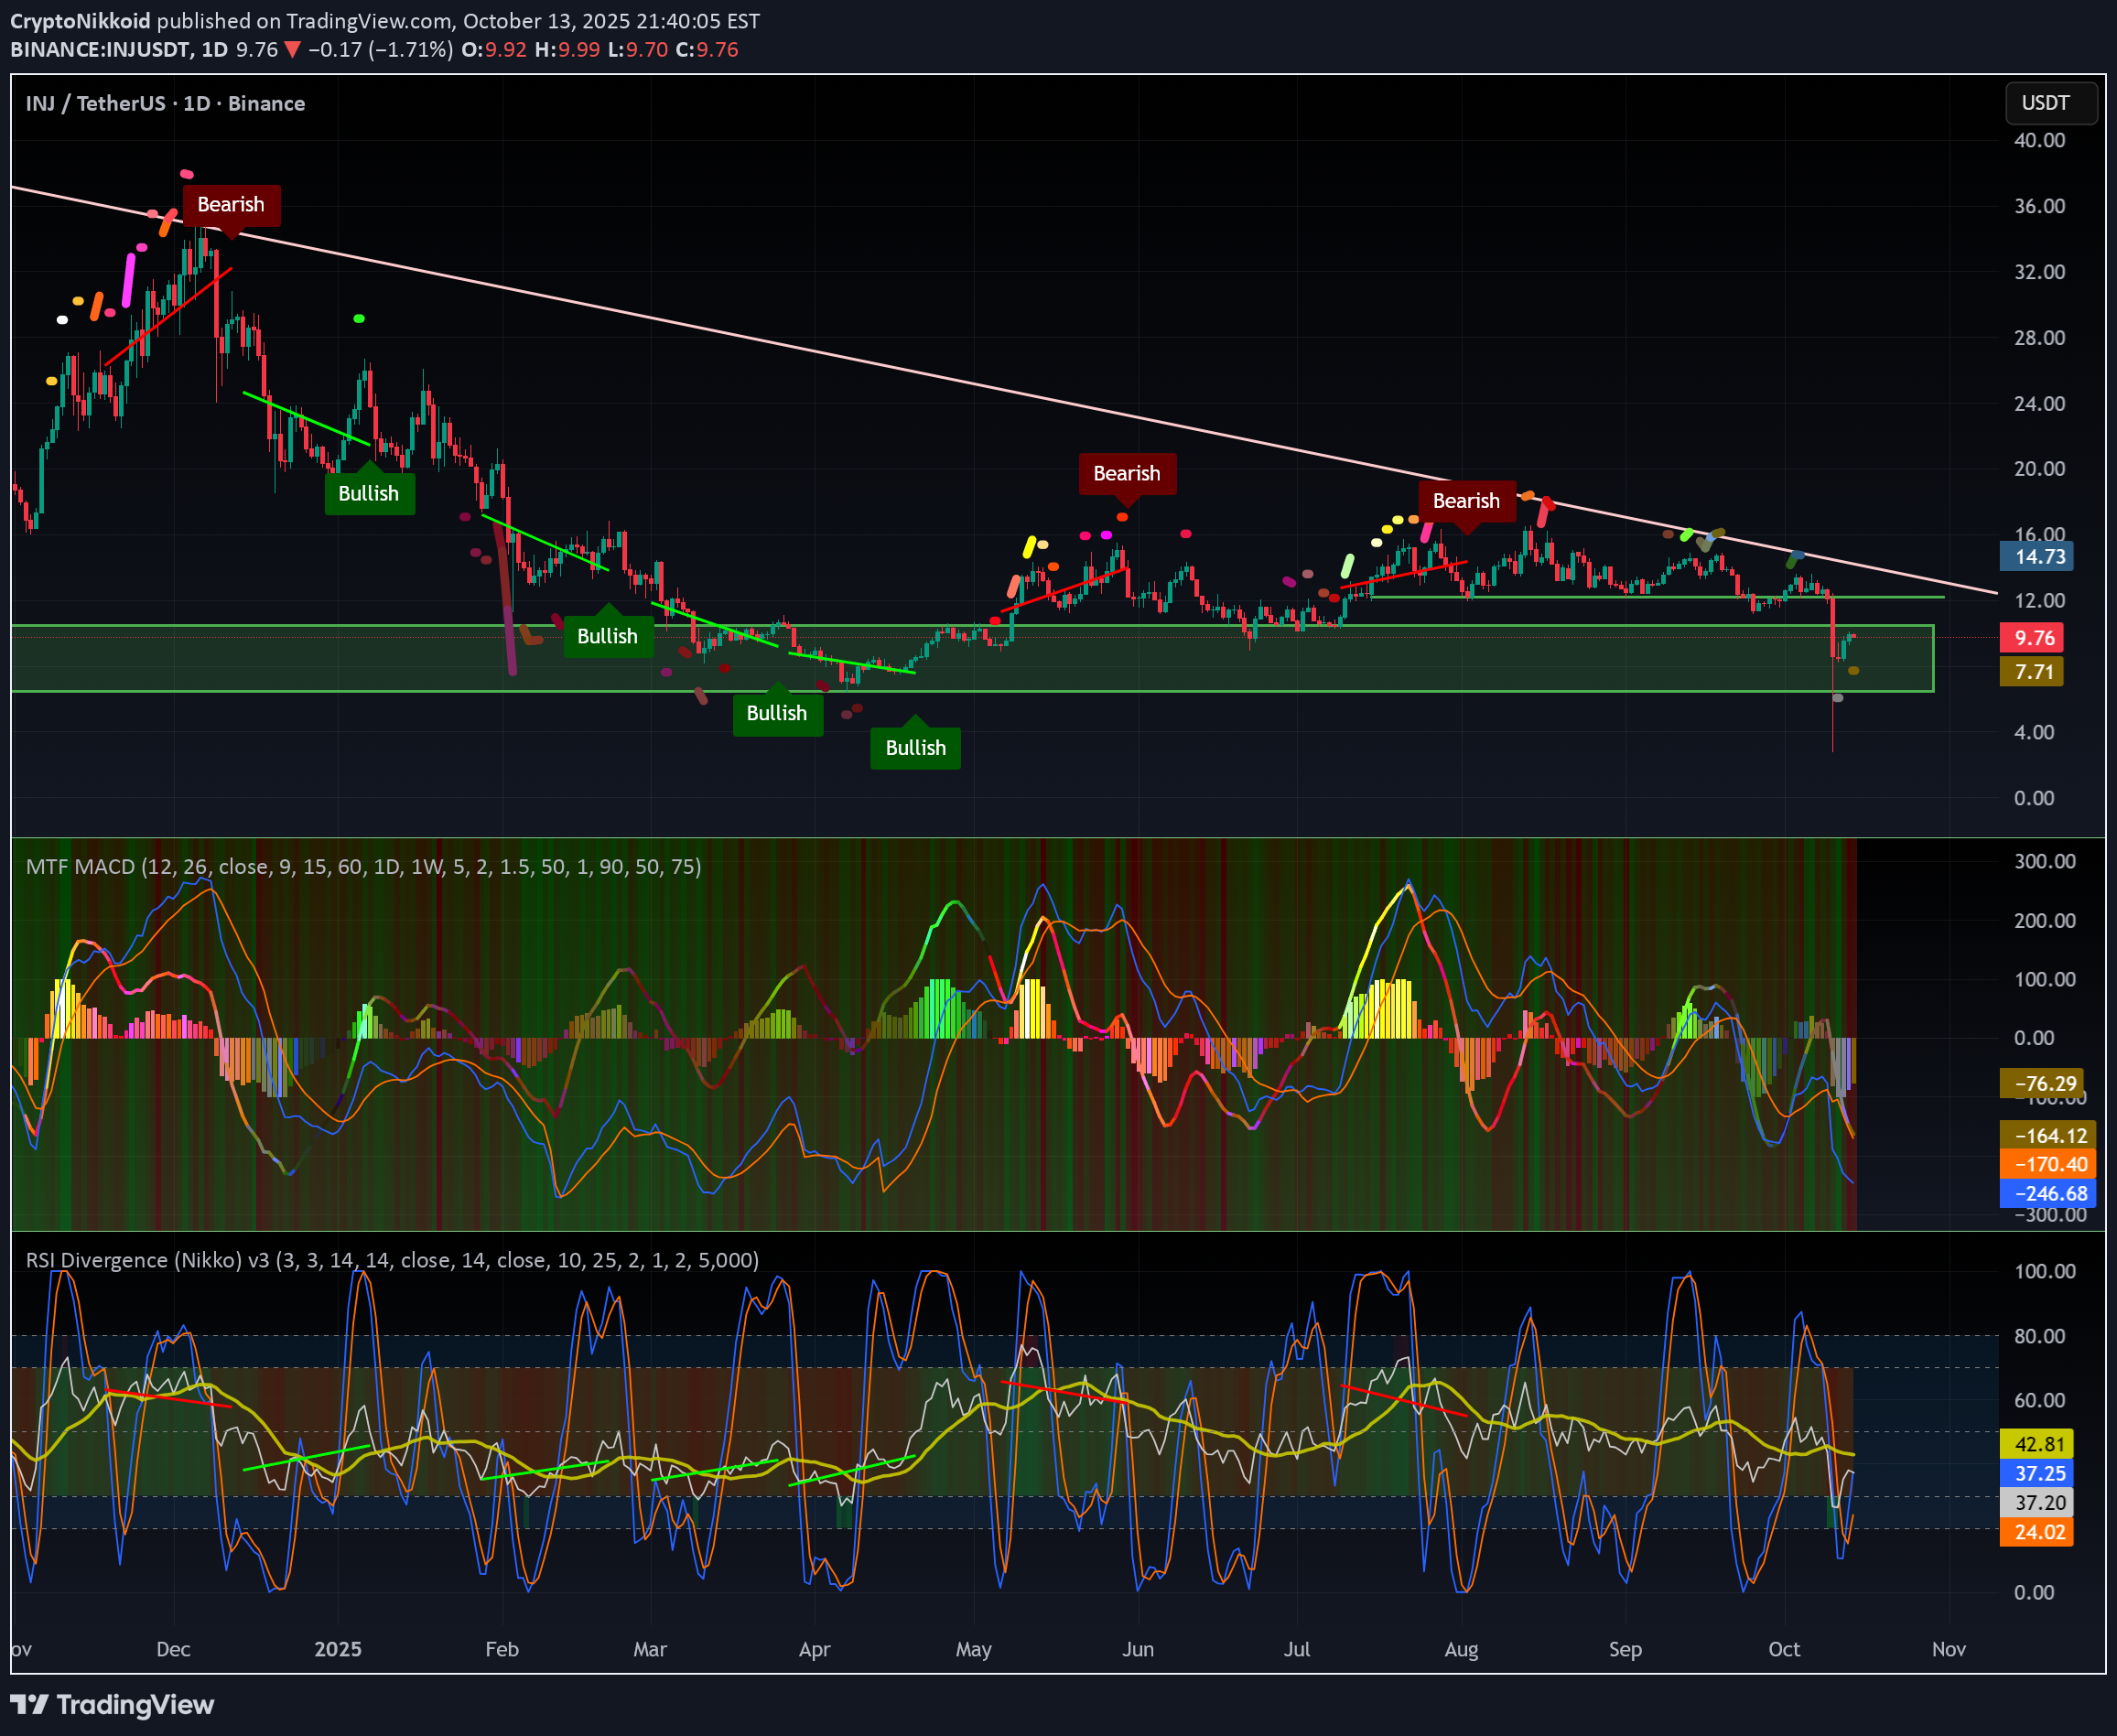
INJ is now sitting in a strong demand zone — a level that has triggered massive pumps three times in the past. There’s a major resistance line around $14 (yellow line) that INJ still needs to break through. The RSI is low, the Stochastic RSI shows a bullish crossover at the bottom, and the Multi Time Frame MACD is turning bullish across all timeframes — it doesn’t get much lower than this. Given these signals, the odds of a medium-term uptrend are very high. This could be a great opportunity to build a position for a multi-month rally. Historically, INJ tends to make explosive moves followed by long consolidation periods. If it breaks above $14, the next targets could be: 🎯 $16, $22, $27, and $32 — key resistance levels to watch. Always keep an eye on macro and economic data, and DYOR before entering any trade. #INJ #CryptoAnalysis #TradingSetup #Altcoins #Bullish #RSI #MACD #StochasticRSI #TechnicalAnalysis #DYOR #Breakout #CryptoMarkets
CryptoNikkoid
بامبوک (BONK) در آستانه انفجار قیمتی؟ وقت پر کردن کیفهاست!
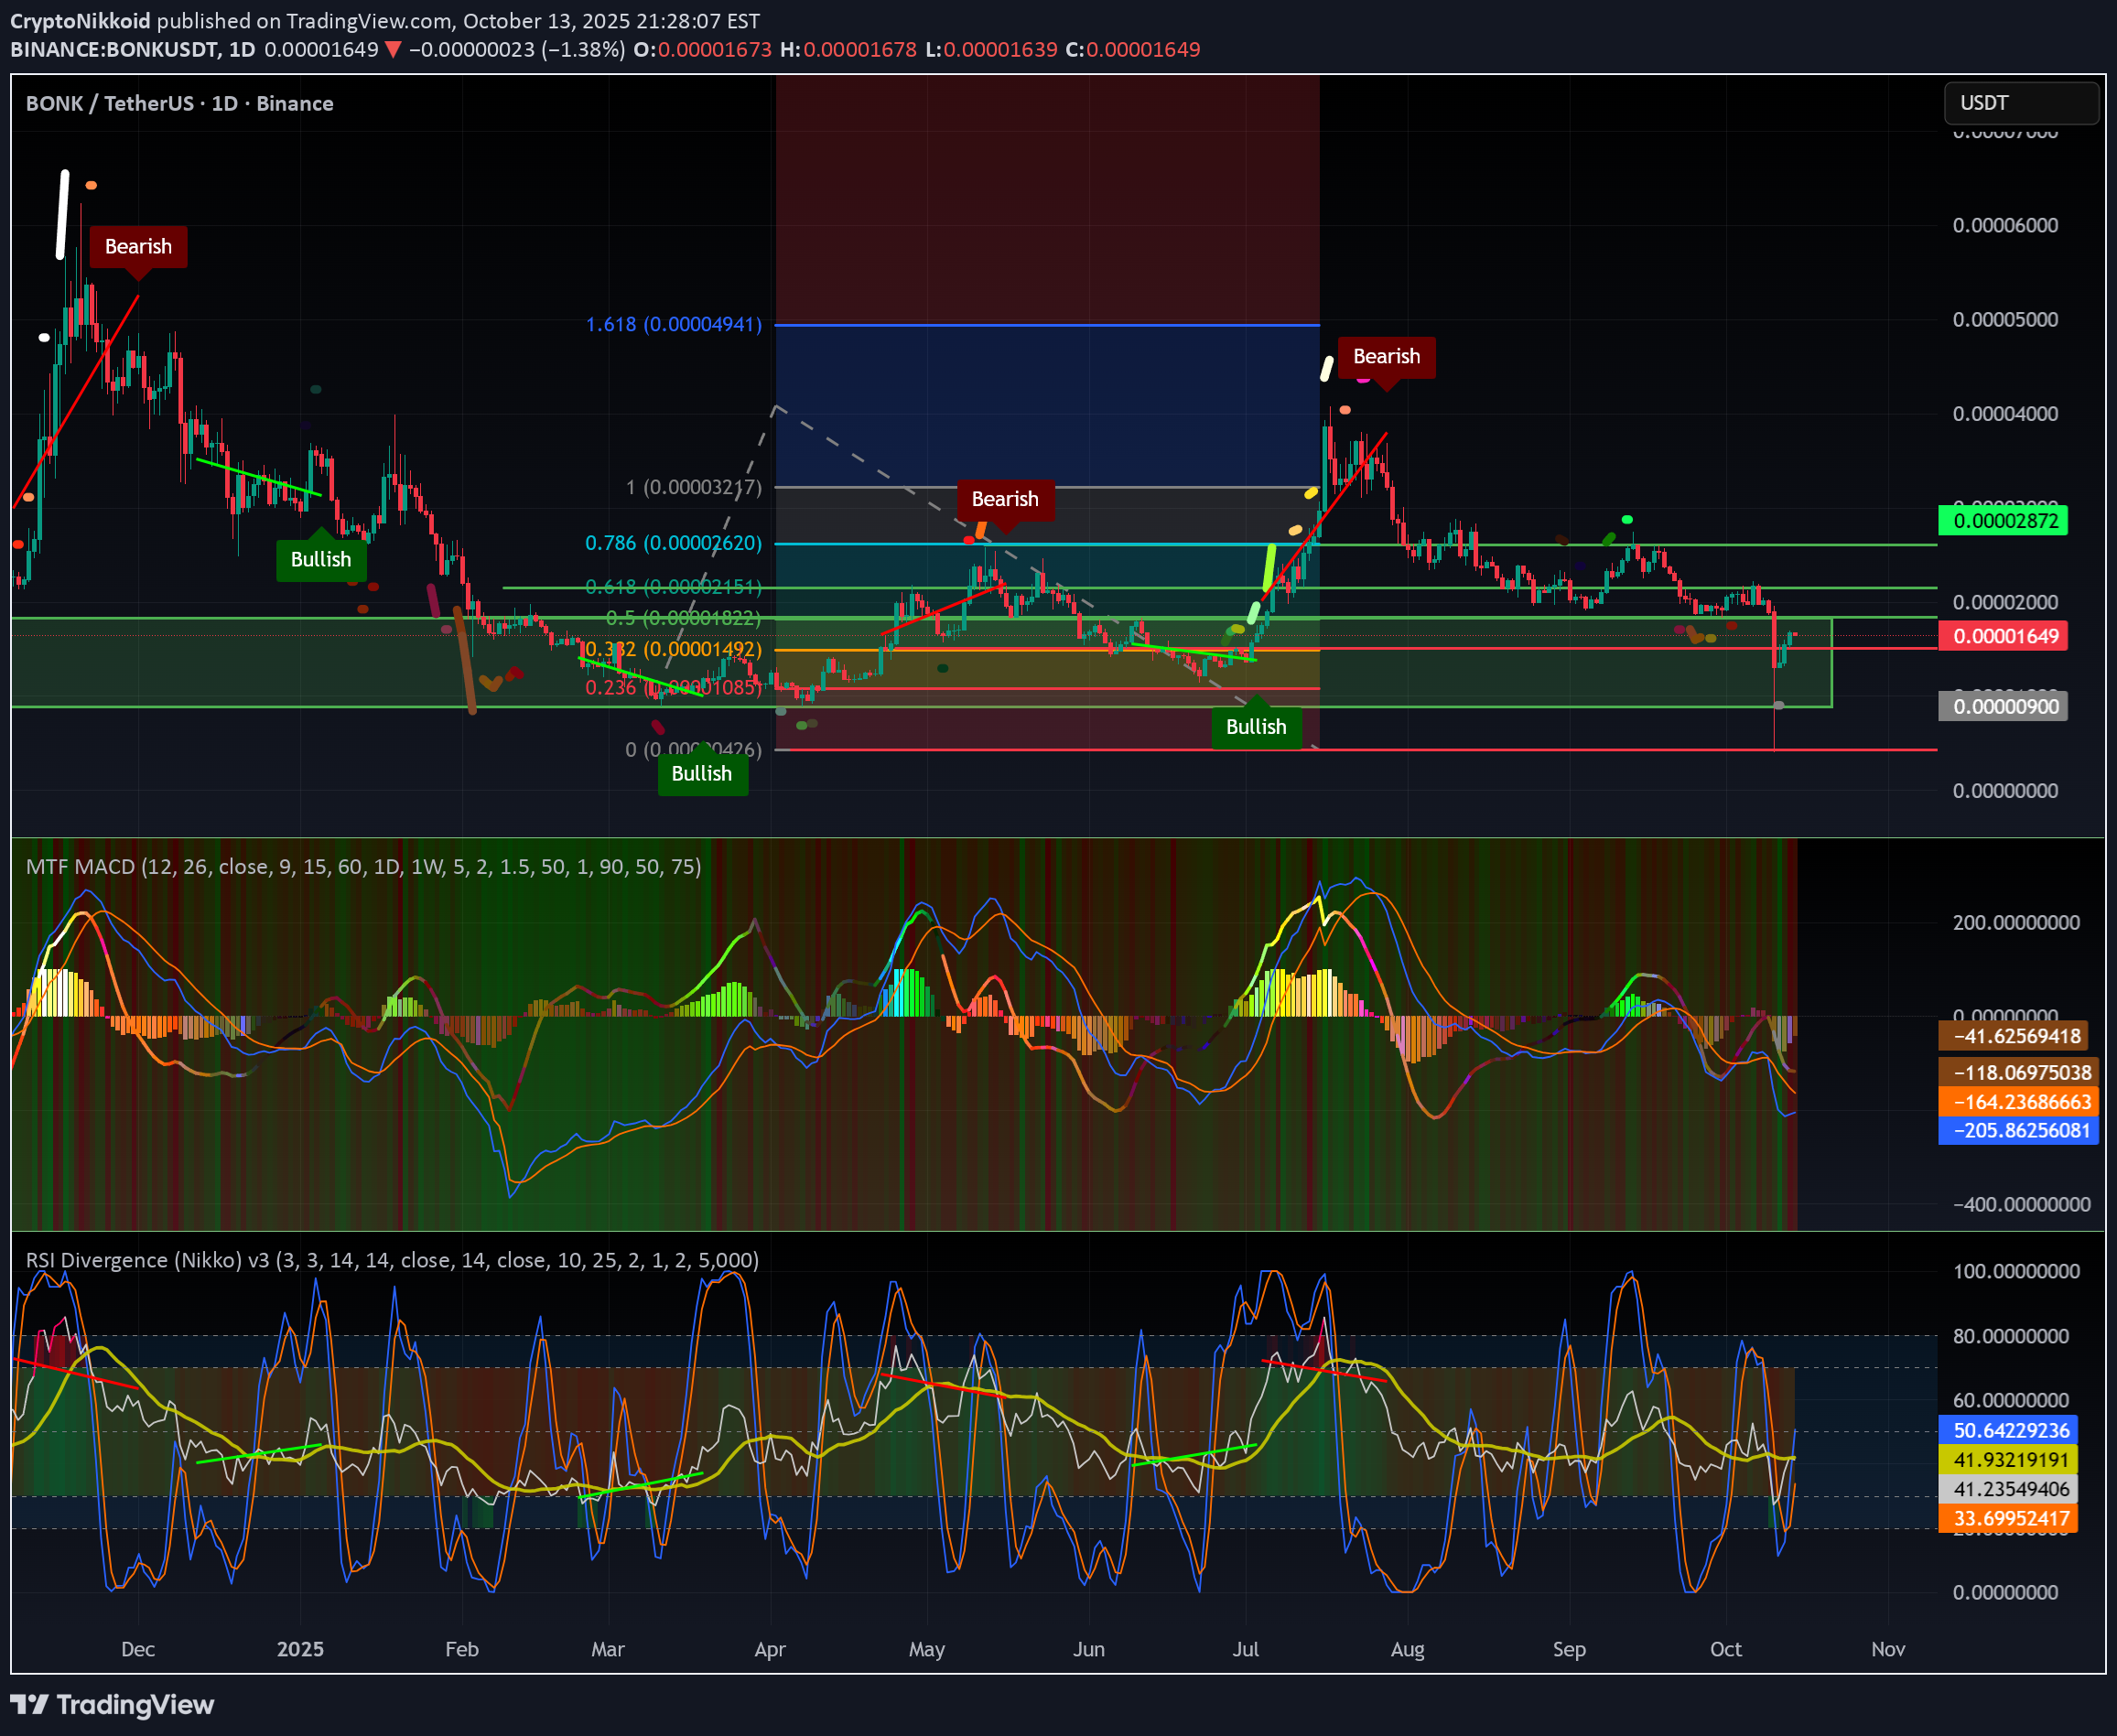
I believe we’re heading toward a new all-time high for Bitcoin (BTC). Both OTHERS and TOTAL3 are showing strong bullish momentum, entering extremely oversold territory — a signal often preceding a major recovery. November is also a historically bullish month for altcoins, which strengthens the case for an upcoming rally. The probability of a +100% uptrend is very high. The head and shoulders pattern was invalidated by the October 11th event, which completely shifted the market structure. In my view, this is the perfect time to take positions and patiently wait for the market reset to play out. 🎯 Take-Profit Targets (based on Fibonacci levels): TP1: $0.00001865 TP2: $0.00002145 TP3: $0.00002600 TP4: $0.00003220 Historically, when B BONK starts pumping, it almost always reaches around $0.00003200 — and if that happens, we could see a parabolic move up to $0.00005000, marking the top of the altseason. DYOR (Do Your Own Research). #BTC #BONK #Altseason #CryptoMarket #Bullish #TradingSetup #Fibonacci #CryptoAnalysis #NovemberRallyYou should have refilled your bags by now. An upward movement will probably happen next, do not forget to sell and take profit, these coins are not to be kept long time, they are short term profit only.
CryptoNikkoid
هشدار فوری: چرا باید همین حالا از سرمایهگذاری روی BNB خارج شوید؟ (احتمال سقوط بزرگ)

Remember — this is only my personal opinion, it’s emotional, and maybe you shouldn’t trust me. But here’s what I see happening right now. This BNB pump looks extremely suspicious. CZ has turned his back on the community he helped build, and now he seems to serve the same powers manipulating the crypto markets. 🚨 What’s going on: On October 11th, over $400 billion (yes entired funds collapsed, the total of the liquidation is yet to be accounted for real, brace for a shocking number) in liquidations reportedly happened. Binance allegedly reported only 5% of that — likely to hide the fact that their system failed catastrophically. If true, Binance could be liable for massive financial damages. 💰 How it works: BNB is being pumped using liquidity minted by Binance on their own BNB Chain. They can mint unlimited USDT , creating fake buying power and distorting the market. ⚖️ What might happen next: When justice catches up, Binance could face severe investigations and legal actions. More traders and companies are starting to speak up — and we’ve only seen the tip of the iceberg. If the justice system audit Binance, then they will have to remove the fake liquidity and rekt the ones who invested. ⚠️ My conclusion: When the storm hits, BNB could crash beyond recognition. Don’t be the one posting “I lost everything.” There are safer investments — precious metals, bitcoin, solid stocks, real estate in Asia… But BNB ? After what happened? It is a high risk asset considering how liable they are. 👉 Stay away until the truth unfolds. #BNB #Binance #CryptoCrash #CZ #USDT #MarketManipulation #CryptoWarning #CryptoNews #BNBChain #Justice #CryptoInvesting #DYORBinance just released a damage control PR, claiming they’ve refunded over $200 million. In a criminal investigation, there’s a name for that: “admission of guilt.” Because seriously — why would any company give away $200+ million if they weren’t already in deep trouble? binance.com/en/support/announcement/detail/d9cb0d52d7c142a5be4f49732bd8760cFrance has launched an investigation into Binance, and there’s now a petition in the U.S. as well — things are starting to look strange. 🔗 Bloomberg article bloomberg.com/news/articles/2025-10-17/binance-among-crypto-firms-hit-by-french-money-laundering-checks?embedded-checkout=true Sure, Binance probably did some things wrong — but will they seize the domain name or freeze user accounts? I highly doubt it. That would cause too much collateral damage to the entire crypto ecosystem. More likely, there will be a hearing and a massive fine, but nothing more. The whole “take your money out of Binance” panic seems FUD engineered by competitors. Personally, I’m still using Binance. As long as you don’t trade with leverage, it remains one of the safest and most efficient exchanges, in my opinion. This FUD wave had one good effect though — BNB might dip below $1000, creating a potential buying opportunity. No FTX-style collapse in sight for now.
CryptoNikkoid
اصلاح قیمت بیت کوین: آیا پولبک عمیقتر برای شروع جهش بزرگ بعدی لازم است؟

A healthy consolidation should dip lower (around $6,648 or even better $6,000) before bouncing. But will the billionaires manipulating this market have the patience — or will they fire their money into the air too soon? Hopefully, we get a deeper correction for a solid long setup by the end of the week and a strong rebound next week. Patience is key. 🕒I told you!
Disclaimer
Any content and materials included in Sahmeto's website and official communication channels are a compilation of personal opinions and analyses and are not binding. They do not constitute any recommendation for buying, selling, entering or exiting the stock market and cryptocurrency market. Also, all news and analyses included in the website and channels are merely republished information from official and unofficial domestic and foreign sources, and it is obvious that users of the said content are responsible for following up and ensuring the authenticity and accuracy of the materials. Therefore, while disclaiming responsibility, it is declared that the responsibility for any decision-making, action, and potential profit and loss in the capital market and cryptocurrency market lies with the trader.