Technical analysis by CryptoNikkoid about Symbol BTC: Sell recommendation (11/25/2025)

CryptoNikkoid
جهش بیت کوین: تله نقدینگی یا آغاز روند صعودی؟ (تحلیل کلیدی که نباید از دست بدهید)
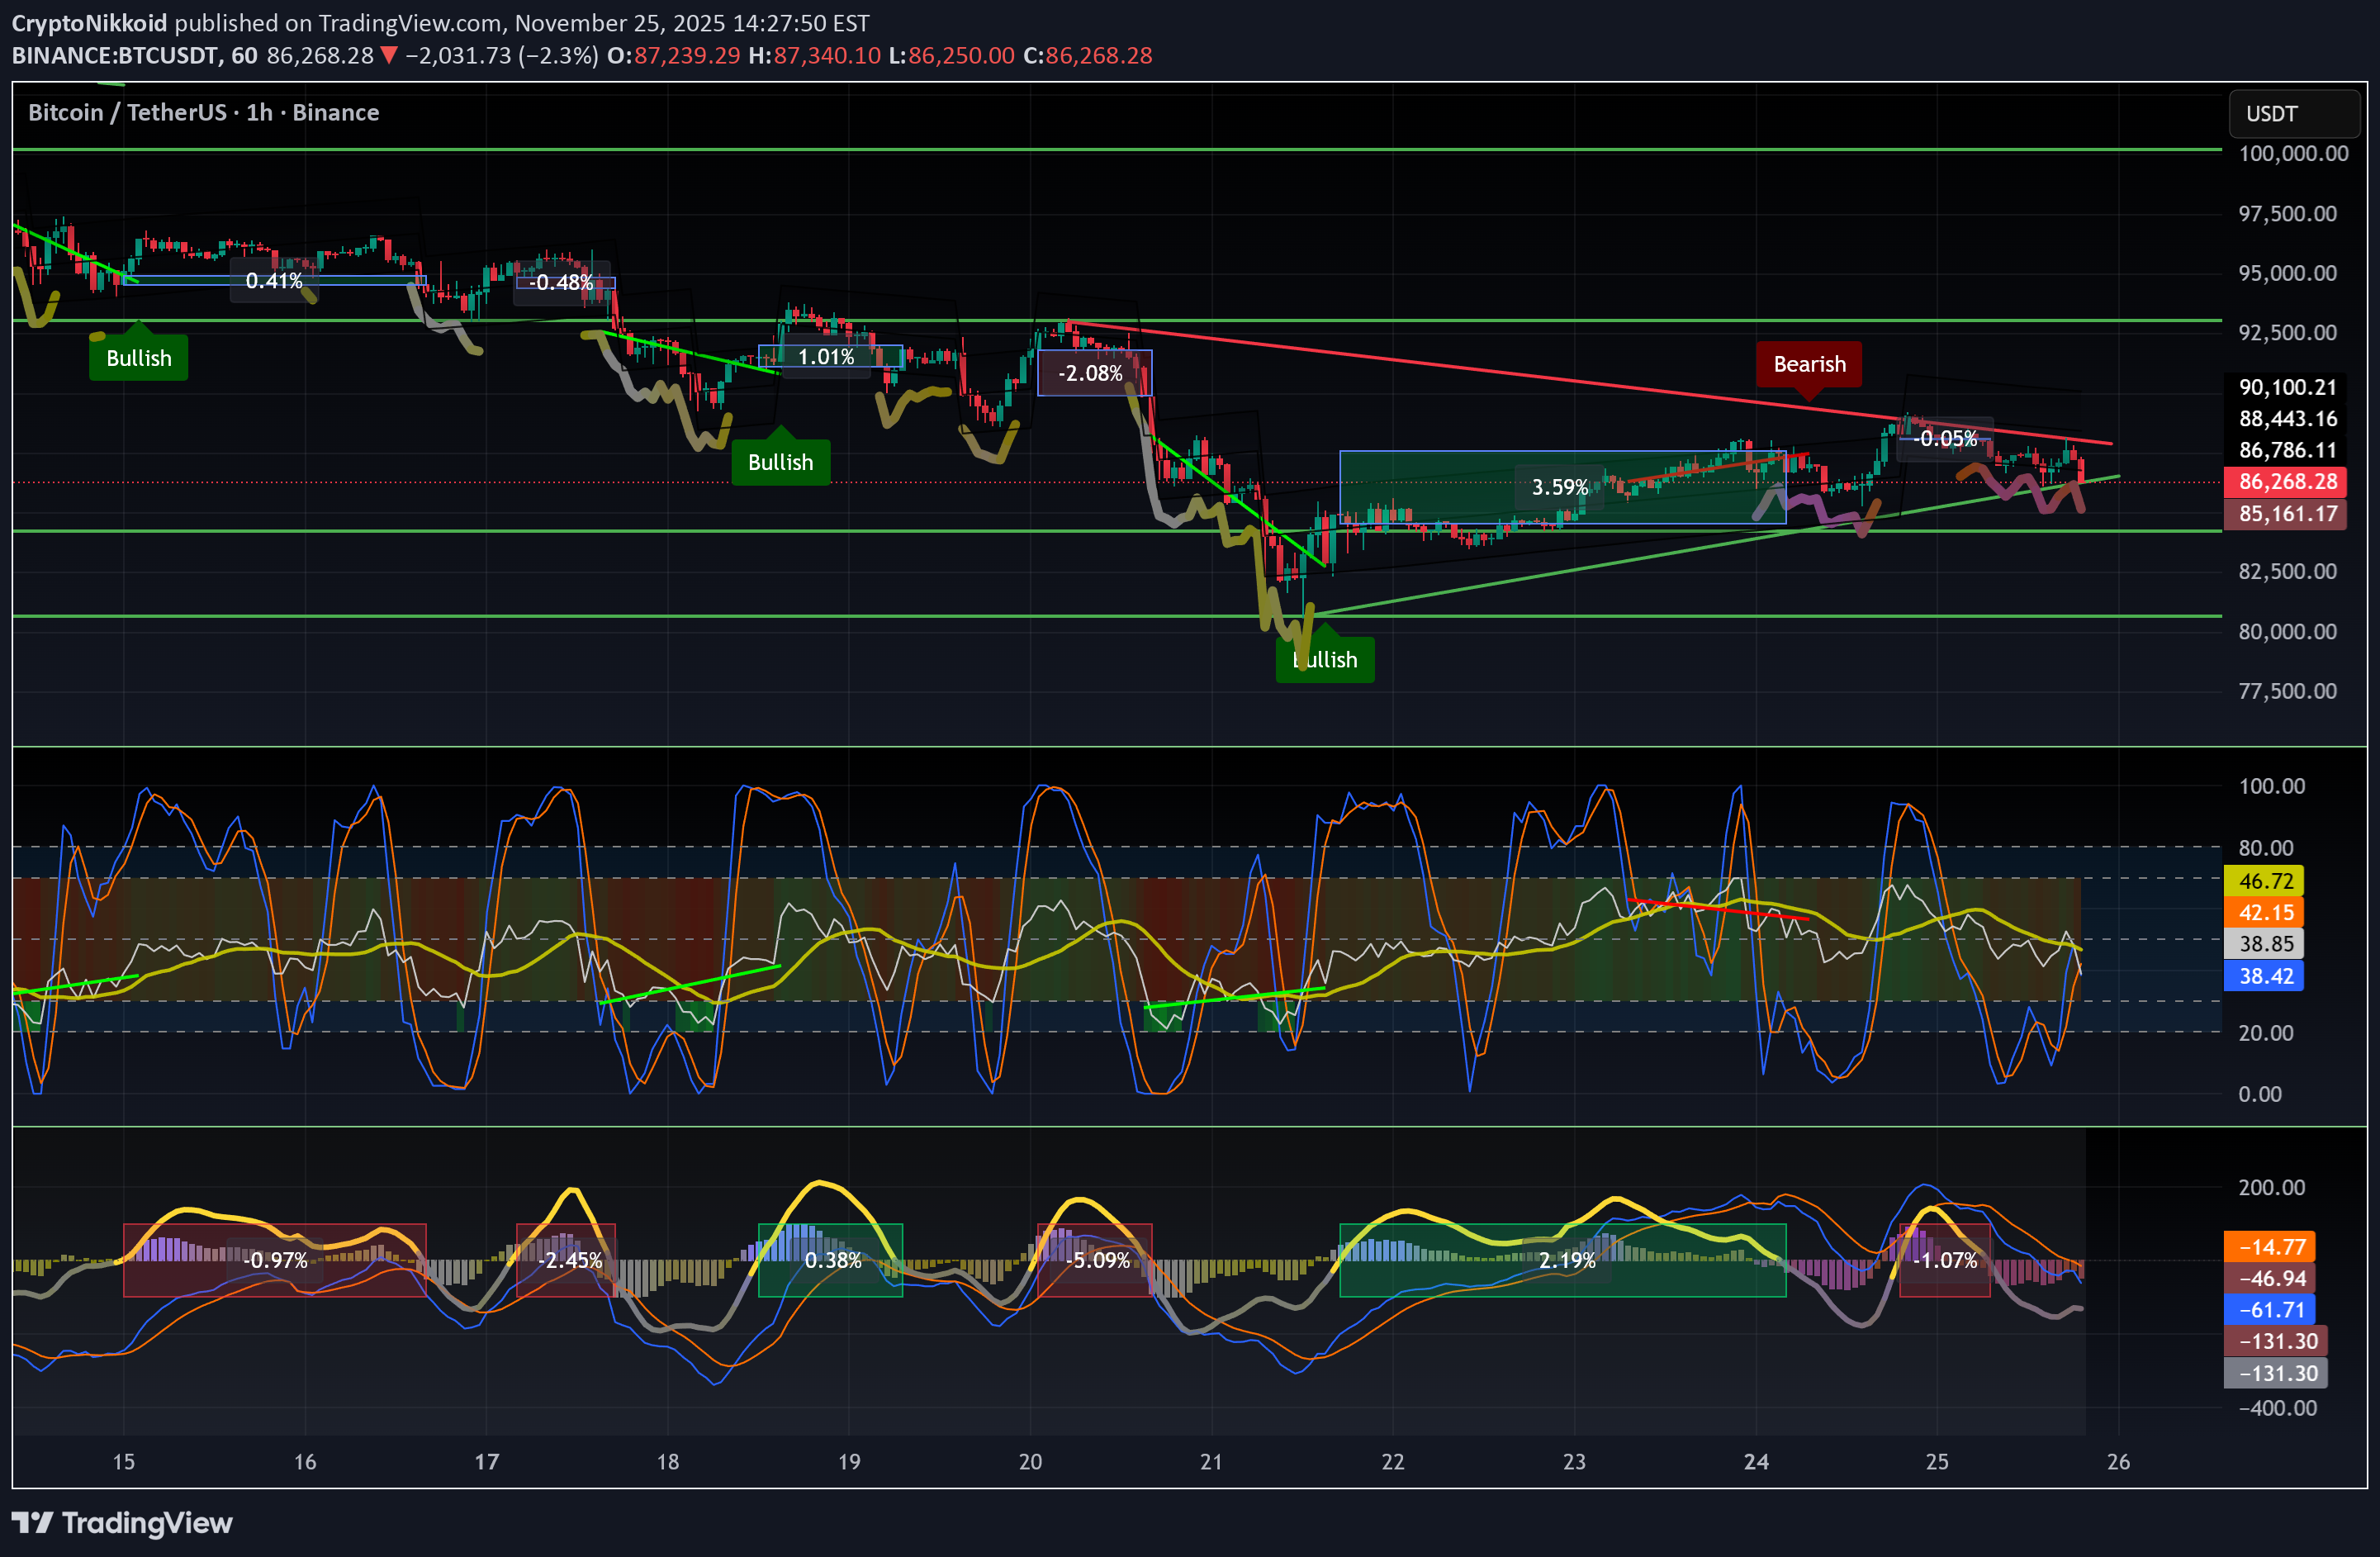
🚫 The Bitcoin bounce is not a trend reversal Here’s why the current move looks more like a liquidity trap than a real bullish reversal: - Momentum is lagging — the rebound isn’t supported by strength. - Liquidity spikes look engineered to squeeze short positions rather than coming from genuine buyers. - ETFs are selling while BTC is pumping → classic exit liquidity behaviour. - We remain in a bearish trend, and the current flag pattern is on the verge of breaking. Statistically, these patterns break down, with targets equal to the size of the previous leg. - Price is rising while volume is falling → this is a hidden bearish divergence on volume. 🎯 What I’m seeing It looks like many institutions were caught off guard by the depth of this downtrend, and now they’re trying to reduce exposure. They appear to be engineering a bounce to attract retail FOMO, allowing them to exit with smaller losses — a classic liquidity extraction move. As I’ve mentioned several times already: 👉 The primary trend remains bearish until Q2 2026, though we should expect bounces and manipulative moves along the way. ⚠️ My advice Don’t deploy all your capital into a fake FOMO rally and become the institutions’ exit liquidity. Wait for a proper bottom confirmation, such as: A W pattern, followed by a successful retest with a higher low. ❌ Invalidation This analysis becomes invalid only if the current pattern breaks upward with strong volume. DYORThe flag pattern broke to the upside, very similar to what happened on the 24th. There’s plenty of liquidity above the range, so another leg up is possible. This move is clearly a liquidity grab, boosted by the SPX pump which is being used as leverage to push BTC upward. The issue with these pumps is always the same: they’re brutal, fast, and leave no time for manual traders to enter. By the time you set up a long (assuming you’re not asleep when it happens), you’re already buying the top or near the top. Then the pump ends, price pulls back –50% of the move, and you’re instantly underwater. (Just look at the chart.) At that point, you have two bad options: Wait for the next leg and hope it recovers (not guaranteed), or Become exit liquidity for the whales, because as soon as you buy, you’re in the red. The only way to catch these moves is basically to roll the dice and hope the consolidation breaks up again at the open — even though the SPX500 futures weren’t really suggesting that. It’s risky, because many times the opposite happens and BTC dumps at the Wall Street open. These are large liquidity deployments by corporations, whales, or exchanges, and insiders know about them in advance. They are designed specifically to leave retail behind. What comes next? Roll the dice… or ask an insider. MACD and RSI are blind here — this is pure price action driven by macro or manipulation. Chart:Most influencers get it wrong, the reason behind the current dump is the 10y bonds in Japan pumping almost 2% The full explanation: x.com/cryptonikkoid/status/1995323559649177720?s=20 The firs to react was the SPX500.F that contaminated BTC then of course all the crypto followed. read my X post to get the full explanation. This means that the odds of a rate cut is fading, and that the consequence of the end of QT will have to wait several months (as expected). Q2 2026 as I always said.