
Cosmicbag
@t_Cosmicbag

What symbols does the trader recommend buying?
Purchase History
پیام های تریدر
Filter
Cosmicbag
تحلیل کوتاه ONDO: شکار سود ۱۰ درصدی در منطقه فشرده!
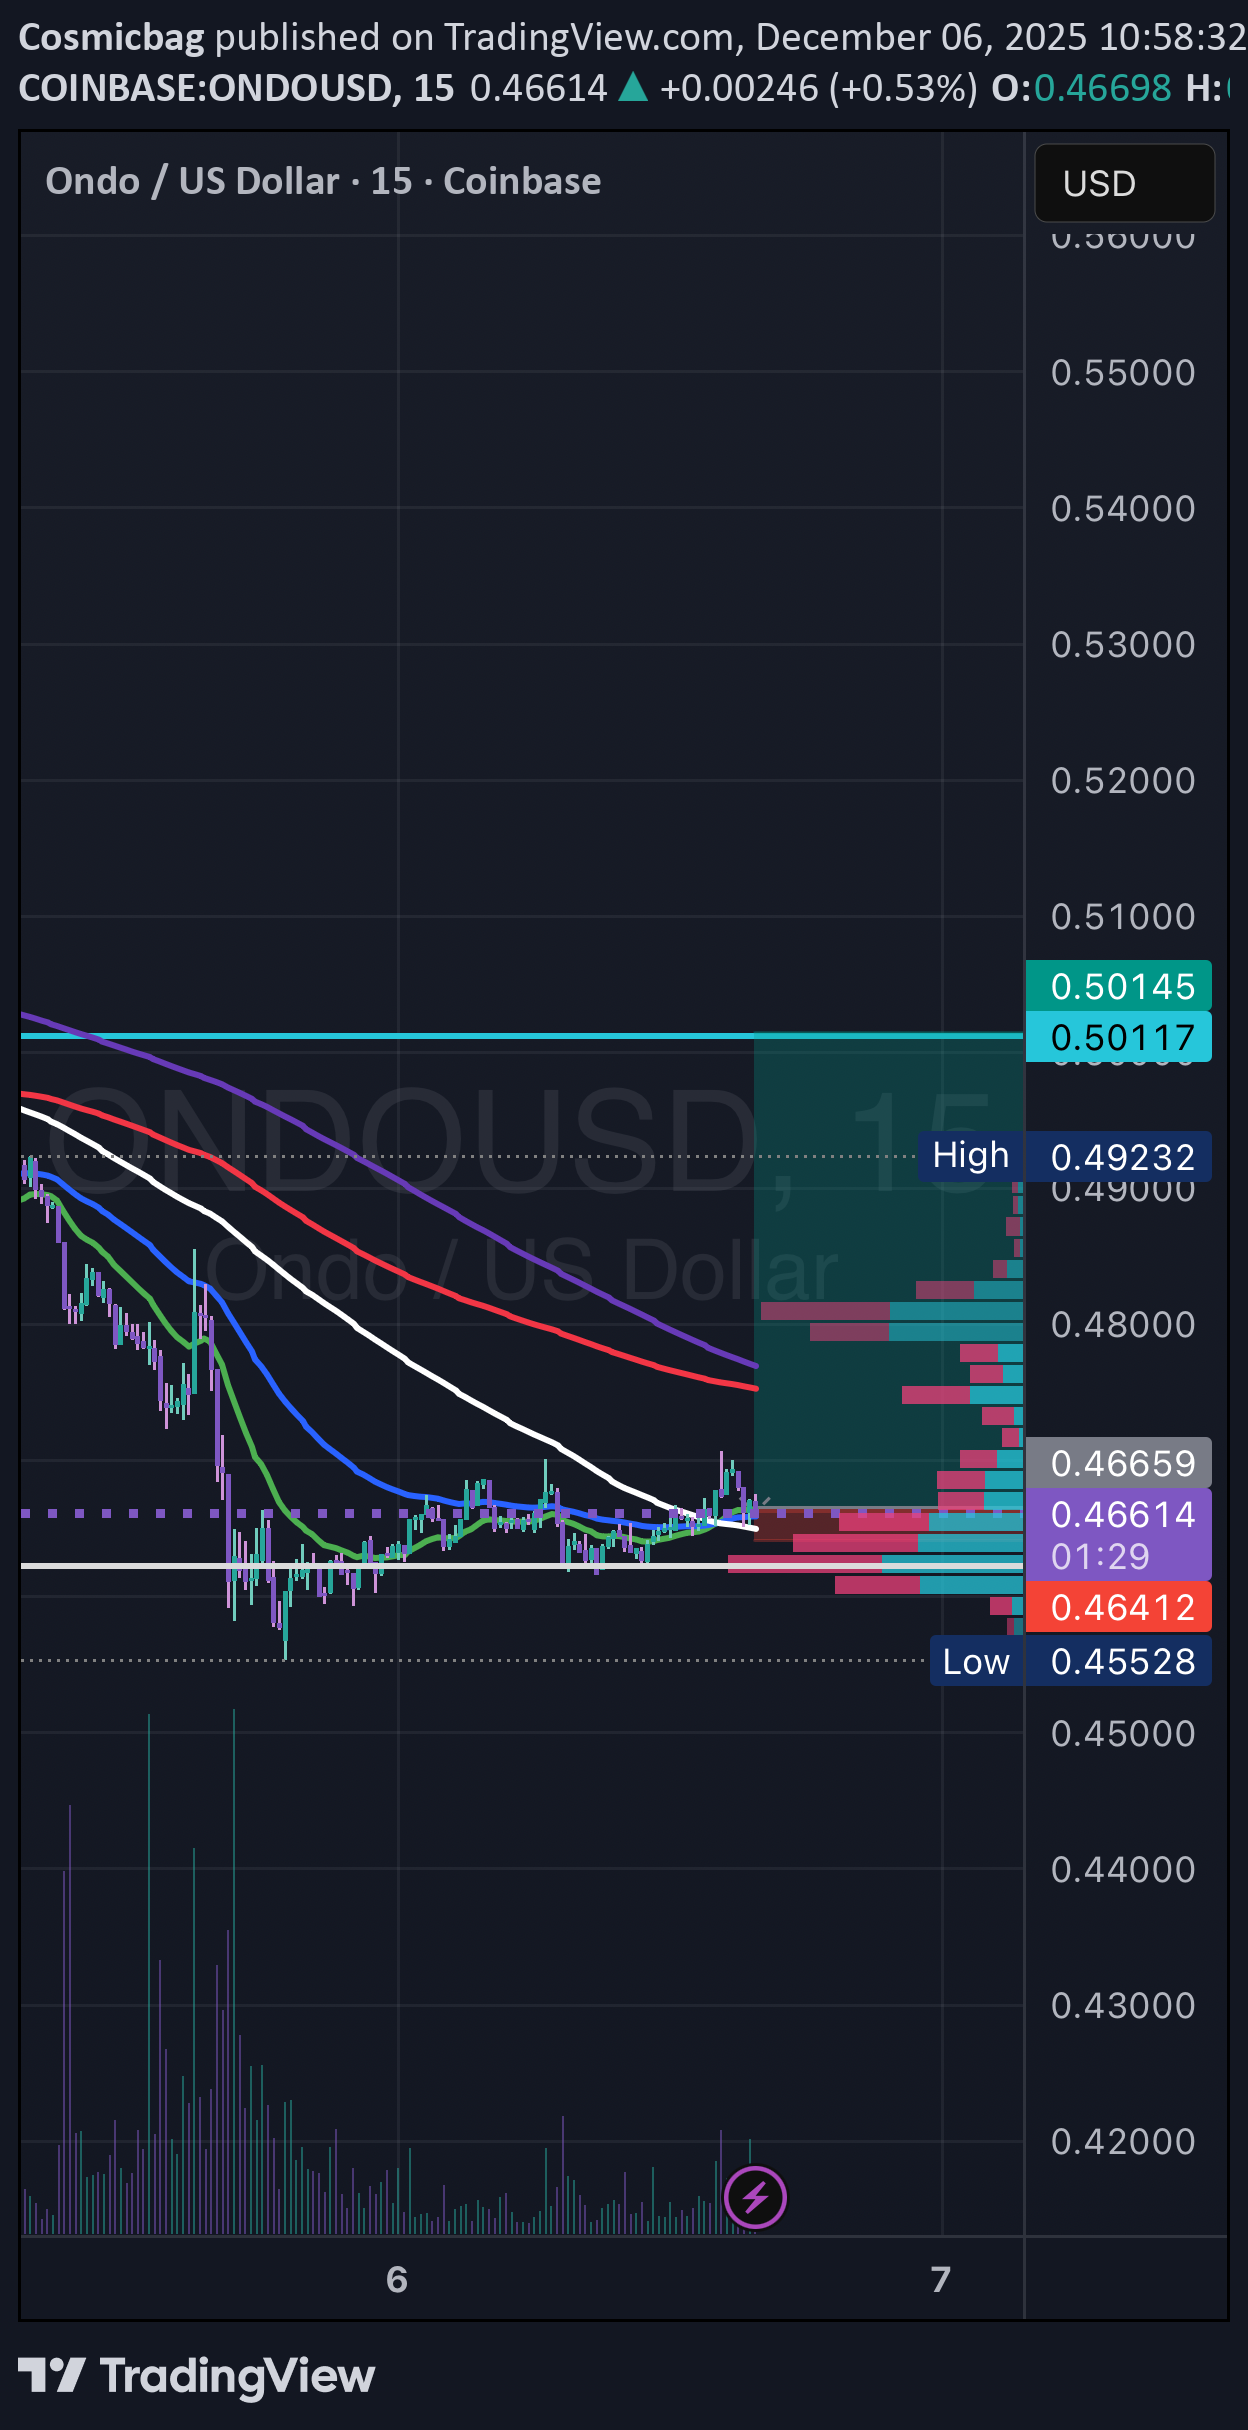
ONDO here, 15m chart. Currently settling into an apex play. Getting pinched between the 100ma and the 200s. I’m thinking .50 target, like maybe 10%. Stop loss should be around .5% or 1% depending on your risk tolerance and leverage size. Invalidate if candles close below the 15m white 100sma. Hit me up if y’all have any questions or requests.
Cosmicbag
1H Apex in play on CRCL
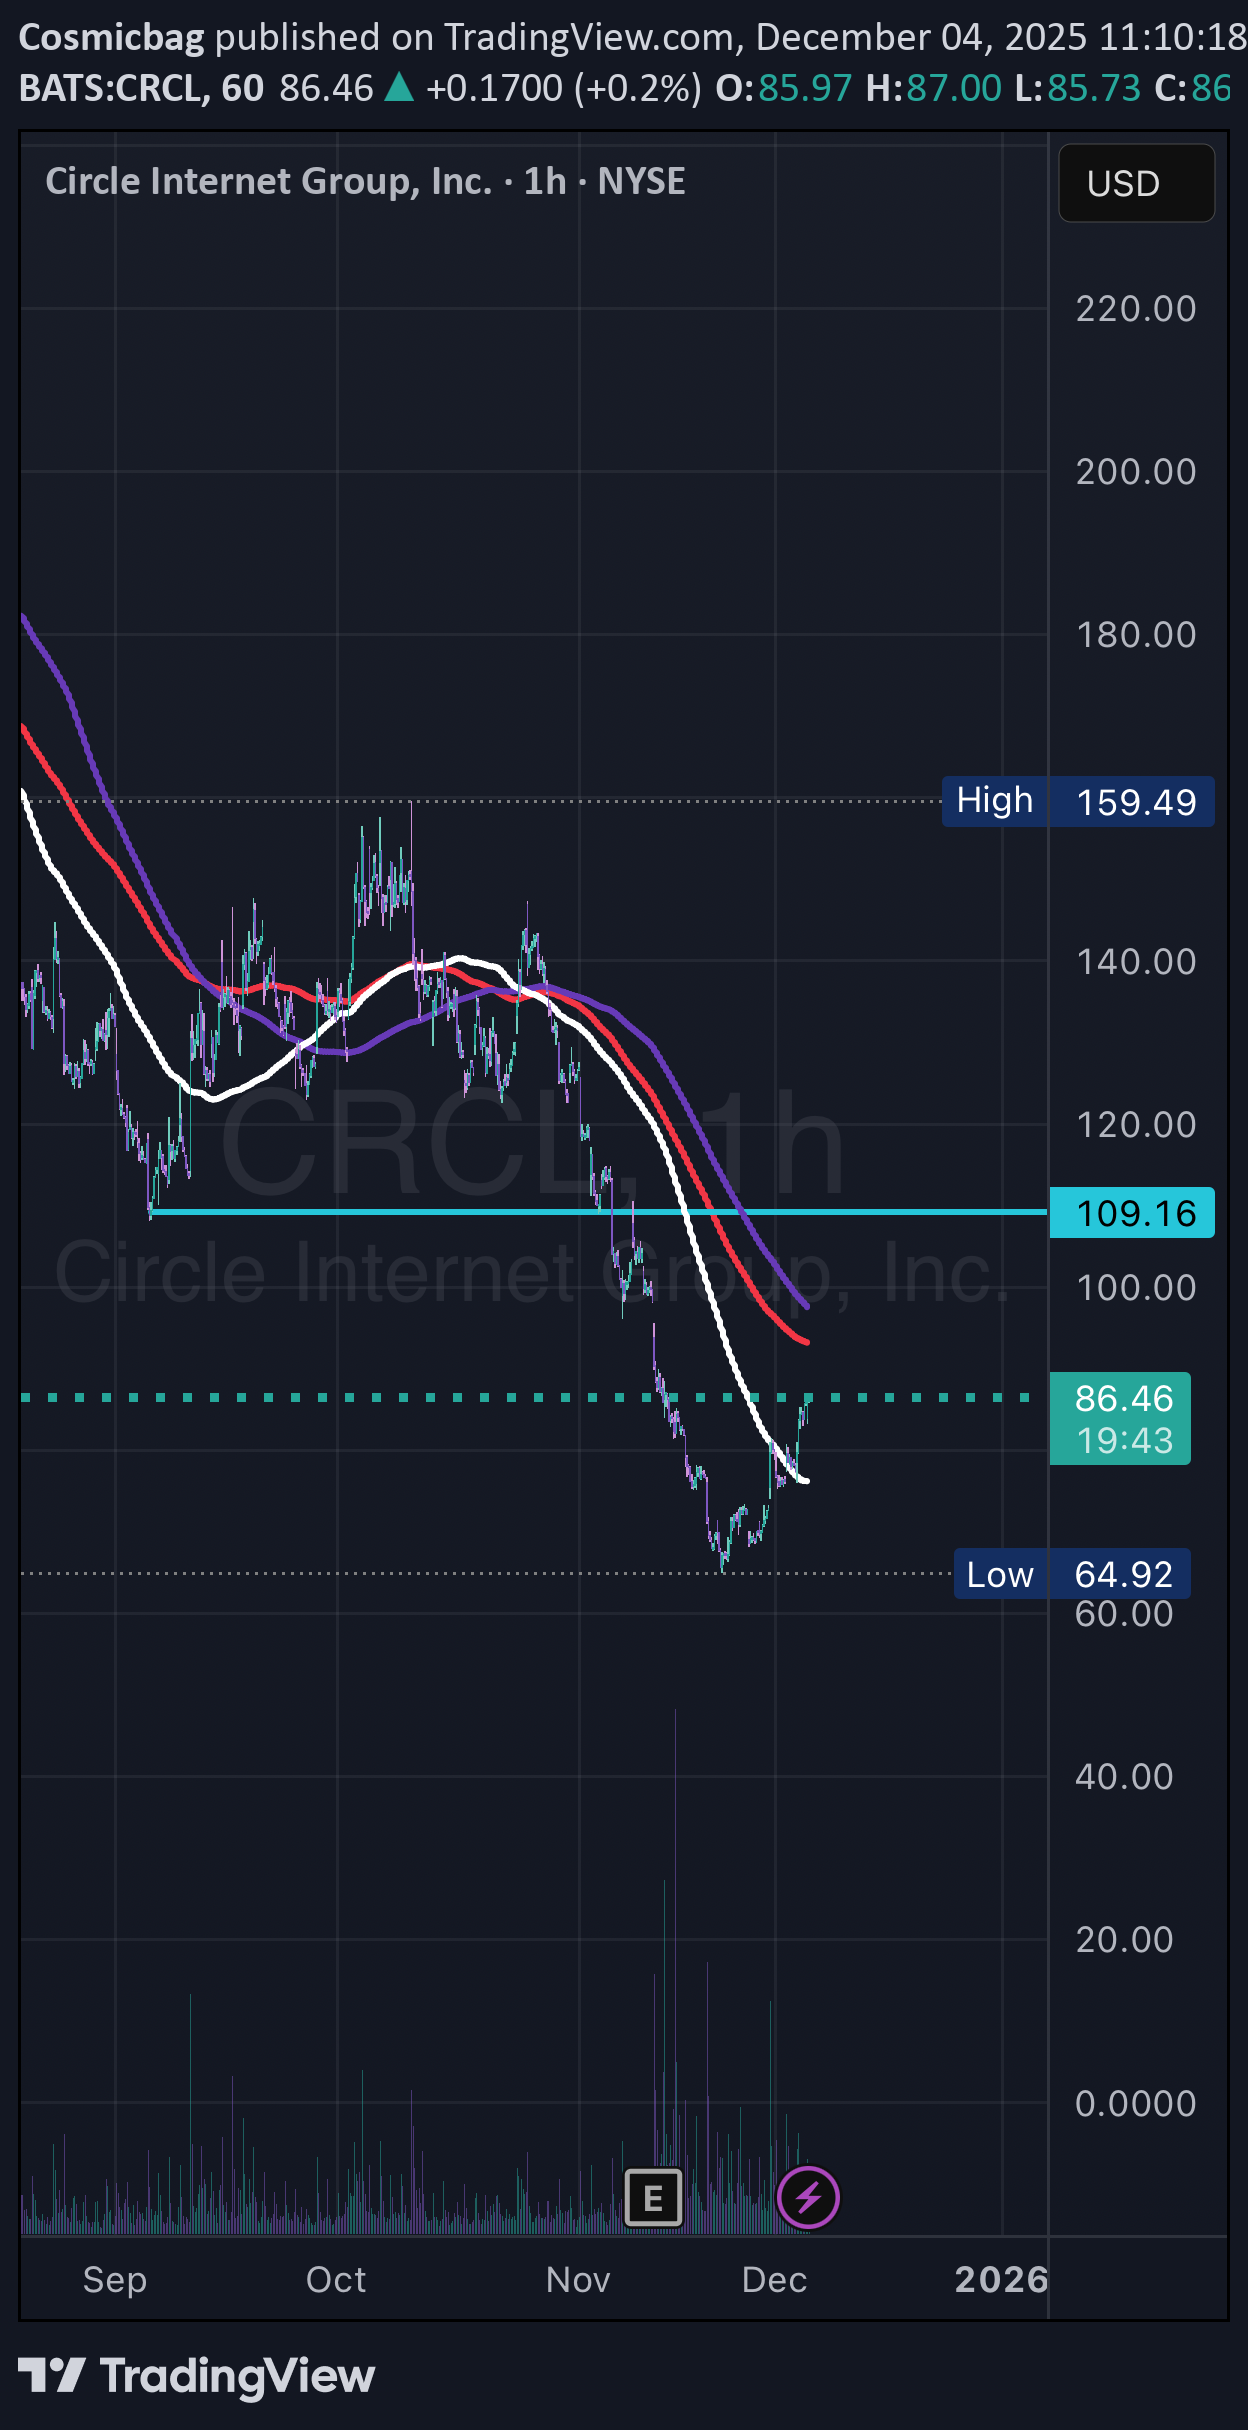
There’s a 1H apex in play on CRCL. Likely to grind on through the month. Looking for around 30% from here. It lines up with the 300 MAs and previous capitulation area. If you got in early 🍻 Hit me up if you have questions. Please like and follow along. Thank you!
Cosmicbag
DOGE Daily MA Hints and Clues

DOGEUSD Daily Outlook: Signs of Accumulation? Thanks for taking the time to check out my analysis on DOGEUSD. Let’s dive in. Most traders are familiar with moving averages and crossover signals — and while these are often viewed as lagging indicators, I’ve found that using multiple moving averages together can offer much clearer insights, especially when paired with other supporting tools. On this chart, I’m using a combination of simple moving averages (SMA) and exponential moving averages (EMA). I’ll break down the specific MAs I'm using in a follow-up post, but for now, I want to highlight what the moving average structure is showing us right now — and how it compares to similar price action in the past. Take a look at the yellow arrows on the chart: The arrow on the right marks the current price position relative to the moving averages. The arrow on the left points to a similar setup from the past. As the old saying goes: “History doesn’t repeat itself, but it often rhymes.” The last time DOGEUSD price action sat in this zone, we saw about 45 to 50 days of consolidation and chop before the market broke into a strong parabolic move higher. Projecting that same timeframe forward puts us somewhere around mid-June. While nothing is guaranteed in the markets, this chart suggests that accumulation around this zone could present a favorable risk-reward setup for a potential run in the near to mid-term. My Approach: I began accumulating a position today and plan to add on pullbacks if the opportunity presents itself. As always, this is not financial advice — just sharing my personal outlook and strategy. Wishing you all success out there — stay patient, stay sharp.
Cosmicbag
AAVE Longterm pick

Not going to dive too deep, but I genuinely believe DEFI is set to explode in the future! AAVE is definitely one of my favorites, along with UNI and a couple of others that are on my radar. Anyway, Looking at the long-term Fibonacci targets, they suggest (850-1300-1750) will happen eventually. I’m not sure how long it will take, but I’m all about keeping my eyes on the prize! What are your thoughts? Let’s get a discussion going! Don’t forget to like and share! 🚀💥
Cosmicbag
BNB Channel and Areas of Support

BNB 3 day chart- Current PA is still trading within the channel, though not ideally positioned as we approach its lower boundary. I anticipate the wick from February 3 will be filled, which aligns with our initial support zone. Should that support fail, I expect the wick from August 4 to also be filled, indicating the next support level. These areas can provide short-term bounces or reversals. Thanks for your time. Chat soon!
Cosmicbag
FET Building familar structure

FET 8H chart--Same structure building as last time BULLISH SCENARIO: from this range we continue up to the next "high traffic" area ($1.20-1.50). This would be a 50% move or so, def an area to take profit. If $1.20-1.50 gets flipped and holds, price should move up into the trendline. BEARISH SCENARIO: Price rejects here and moves down to stophunt the FEB low around .60. This is where we should see a nice reaction to the upside. Thanks for reading!
Cosmicbag
LONG(ER)TERM HOLD LITECOIN IDEA

Litecoin 2 week chart, so this will take time to play out-- Sitting nicely ontop of a 3 year base! I've personally been holding LTC since $60 (Spot) Going to add to my spot bag here. **Accumulate in this range ($135-$100) and SELL ($220 - $300 - $400^^^) ***Theoretically, cut the trade if price falls below 1week or 2week 100 MA ***Depending on your risk tolerance.
Cosmicbag
BTC Potential Continuation

Looking at BTC 12H chart here. As you can see on the way up, so far, we had one pullback into the 200MAs (purple and red). Price reacted well there and bounced and continued. We are seeing the same behavior so far here. Keep eyes on the 12H chart. If we can stay above the 200ma and 200sma, and close inside the white 100ma, we should see price continue to upside. BULL MODE ON! If we reject, and so not close 12H inside teh white 100ma, we are likely to see hard reversal back into the 200s. If they break, I think we see price back in between 48k and 53k. (This scenario, ALTS get hit harder, and this accumulation phase continues for longer) ***NEW 9WEEK AND NEW 3DAY CANDLES MONDAY, WILL WATCH FOR REACTIONS THANKS FOR YOUR TIME!! PLEASE LIKE FOLLOW AND SHARE!!! NOT FINANCIAL ADVICE, JUST MY 2CENTS!!
Cosmicbag
My own BTC theory in play?

I have a theory surrounding the 300ema and 300sma, and their crossing. In my charts the 300ema is always in orange and the 300sma is always in green. In my findings so far, whenever the ema crosses bearish over the sma, there usually is an upcoming opportunity for price to go below these moving averages. In most cases, price will reverse and will correct to the upside of the moving averages. And repeat.... Here on the BTC 4H chart, we've had a bearish cross of the ema over the sma. If my theory is correct, we should se some sort of price action below the moving averages in the near future. This could be a pierce below, or temporary sustained price action (accumulation). I also just noticed the huge gap in volume on the VPVR(right side of my chart). A lot of time, price will like to fill these gaps. So, possibly that could be bottom area of the pullback if we get one, and if it goes that low. Just throwing out some ideas. Please like, share, boost, etc... Not financial advice, just my 2cents..
Cosmicbag
3DAY cup and handle forming on FTM

FTM 3day chart looks bullish. Already had decent move up recently. .55 level would be the level to break, then consolidation and then run to the upside. The first target being 1.00 maybe little higher Thanks for your time! Not financial advice, just my 2cents
Disclaimer
Any content and materials included in Sahmeto's website and official communication channels are a compilation of personal opinions and analyses and are not binding. They do not constitute any recommendation for buying, selling, entering or exiting the stock market and cryptocurrency market. Also, all news and analyses included in the website and channels are merely republished information from official and unofficial domestic and foreign sources, and it is obvious that users of the said content are responsible for following up and ensuring the authenticity and accuracy of the materials. Therefore, while disclaiming responsibility, it is declared that the responsibility for any decision-making, action, and potential profit and loss in the capital market and cryptocurrency market lies with the trader.