
ChrisJTradesFX
@t_ChrisJTradesFX

What symbols does the trader recommend buying?
Purchase History
پیام های تریدر
Filter
ChrisJTradesFX
B I T C O I N
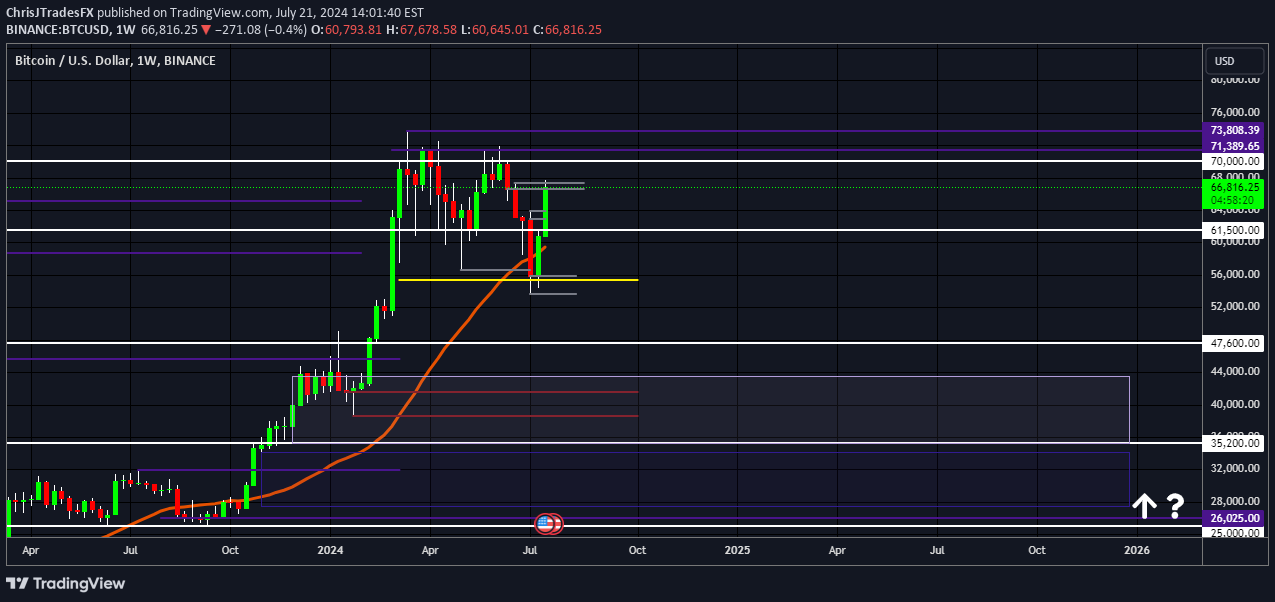
So, I believe it's a bit premature to get excited over these most recent bull rallies. Why? It's due to multiple reasons, which I'll share with you all. -Price is reaching the A.T.H. -MH will be hit for 1st time -Price haven't retraced after breaking multiple key levels -Monthly divergence 🐻 -Weekly high's 2nd hit Seeing that price swept the weekly M.R.L. while also running into the EQ, I can see how most will look at this as a sweep for bull continuation, which it is! However, I am viewing it as a set-up for what's truly about to take place (IMO), which is a sweep of equal highs in order to begin the retracement phase to the downside. The range I'll keep an eye on to see when price action start to flip bull/bear is $76K - $80K, and I wouldn't be surprised if the process starts sometime this upcoming week from the H1/H4 perspective. A.O.I. $31,900 - $45,600 S.S. $35,200 I can very well be wrong on my analysis, and if I am, I'll look for the new weekly low ($55,600 - $55,900) to hold for further bull continuation. We all shall see..After breaking key lows, I see $61,500 as the next area for it to reach. 👀 We all shall see...$61,500 was reached yesterday. I'll look for further continuation. After this week's candle close, I'll look for a bull retracement to hit near the $63,500 price point before there's bear continuation to the downside.$47,600 can potentially be price's next stop. I'll reserve my other opinions until further notice..As I stated on the 3rd of August, it looks as if price action is zeroing in (or near) on $63,500. If so, I would like to see breaks of key lows to continue to the downside afterward.Price can still potentially sweep the ATHs followed by bear momentum since it hasn't revisted key areas it broke away from previously.There was a sweep in price that started on the 24th of August and ended on the 26th. The bears are currently in control. P.A. will be on the sell side once it goes below the $55,333 price point.Bitcoin closed below the $55,333 price point. 🐻👀I'm still anticipating the bears to enter even though price is steadily heading up. Considering that the key high has been hit multiple times, which can weaken it, but I'm looking to see if the bears will start to take charge between the $68,300 - $70K range. If not, I'll look for a break of the A.T.H., retracement and look for a good entry for a buy. We all shall see...
ChrisJTradesFX
Ethereum
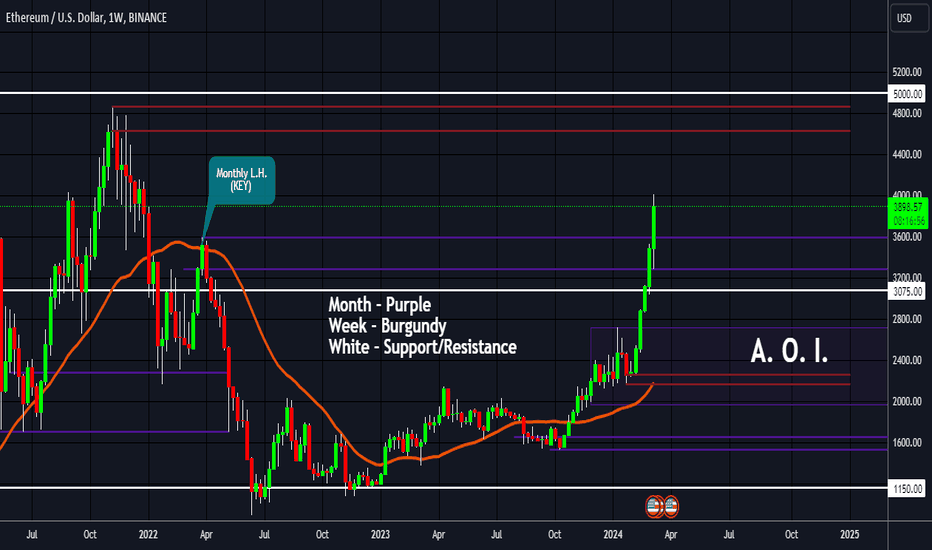
I'm finding myself gravitating more towards this crypto over Bitcoin, and that's mainly due to Ethereum's price. I'll explain my chart along with what I'm anticipating. What am I anticipating? Price is currently breaking a key lower-high on the weekly, which happens to also be the same area as the monthly (key) lower-high. Once that bull candle closes pass those levels at the end of today then the weekly turns bullish. Normally, price would run into an old key area in order for the retracement phase to begin. I'm looking for bull continuation to spike the A.T.H. and $5000 price point followed by a correction right into my area of interest (A.O.I.). Do I have a "special" price within the A.O.I.? I actually do! $2400. In conclusion, I'm merely a spectator until the bears enter the market to drive price down, and if that doesn't happen due to bull momentum, I'll readjust. M - 🐻 W - 🐻 *If today's candle closes above the key LH, it turns 🐂* D - 🐂 H4 - 🐂Weekly candle closed above the key LH. I'll now wait to see a HL broken on the H4, which will then tell me that the retracement phase has more thank likely begun.ETH's price is on the sell-side. Daily.Looks as if price is forming a "sweep of liquidity" to head to the downside. H4 perspective. 👀Yesterday's bear movement was a sweep of equal highs.Everything I've been talking about is currently happening with this crypto. It's melting! I'm just waiting for it to reach my A.O.I. and I'll react.I'm looking for price to come back around the range below 👀👇🏿 Retracing process. Range - $3300 - $3475 Sweet Spot - $3388 We all shall see..This bear price action can be the start of the new bear leg to head further down. If that were to take place, I would look for it to reach my area of interest (A.O.I.). Let's see how this plays out.Price is hovering right above the beginning of my A.O.I. 👀P.A. is on the sellside from the daily perspective once it candle closes below $3400.The H4 is now on the sellside, and if the daily candle closes below the $3380 price point by today, it'll also be on the sellside.I'm projecting price to go under $3K. P.S. I plan to create a new updated idea of ETH & BTC very soon. 👀This theory is contingent on how this current weekly candle closes, which is two days from now, but if it closes big body bear I'll look for the new week to officially begin the needed retracement. Corrections are good for healthy market structure!It's about to reach my A.O.I. 👀P.A. closed bullish engulfing H4 in my A.O.I. 👀👀I'll look for the H4 EQ lows to be swept before further bull movement continues.I don't believe that the bears are done with price at this moment. HTFs will show that this current price action is moving in corrective form. I'm projecting that price can potentially get as low as $1933, and I'm being specific with that projection. I can be wrong, but we all shall see. 👀I'm anticipating a small rally up to the $3,100 price point, followed by the bears taking back over afterward.
ChrisJTradesFX
Ripple
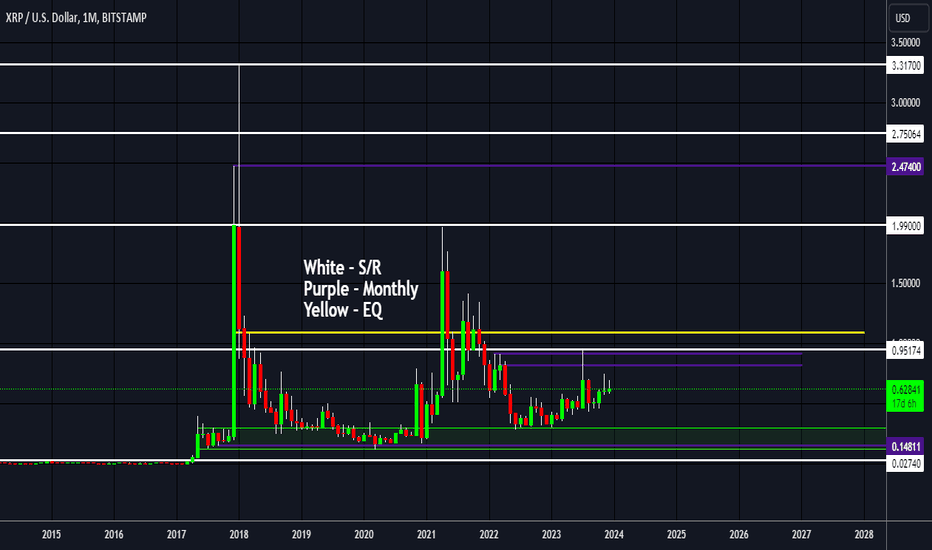
I believe it's time to keep an eye on XRP. Let me start off by saying that this crypto actually has been in a bull range for quite some time. There was a spike sometime ago, which can be viewed as a precursor for what's to come in the future. What would I look for to take place? I want to see a B.A.R. of the mid-range high & monthly EQ ($1.10) before continuantion. The 1st target would be $2.00. Fundamentals: -XRP increased by 1.47% on Wednesday, ending the session at $0.6279. -Crypto market reaction to dovish FOMC projections delivered broad-based market gains. -On Thursday, focal points include SEC v crypto case-related updates and regulatory chatter. -Ripple price eyes recovery alongside Bitcoin and altcoins as the Federal Reserve keeps interest rates unchanged. -In the SEC v. Ripple lawsuit, a ruling is expected in 2024, the window for an appeal extends into 2025. -XRP price eyes rally to $0.7430, a level previously hit in mid-November 2023. P.S. The best TF to view price would have to be the 3M. IMO.Currently: 3M - 🐂 M - 🐂 W - 🐻 D - 🐂There was a spike in price that took place back in July on the 13th of 2023. That movement in price action actually pierced the key weekly high, which can be taken as a precursor for what's to come. After price break and close above the weekly high, then all four time frames I've mentioned would be bullish. We shall see..A.O.I. $0.20 - $0.33 👀☝🏿THAT is still my projections for XRP. I am overall bullish, but I'm still anticipating some bear action BEFORE the bulls actually flip the market. There have been signs (precursors) showing in price action that the bulls are gearing up to take over, so this is a patience game and you must be disciplined enough to wait on the sidelines until it's time to react... I'll wait. I'm basically waiting for a sweep of liquidity. 🤷🏿♂️
ChrisJTradesFX
B I T C O I N
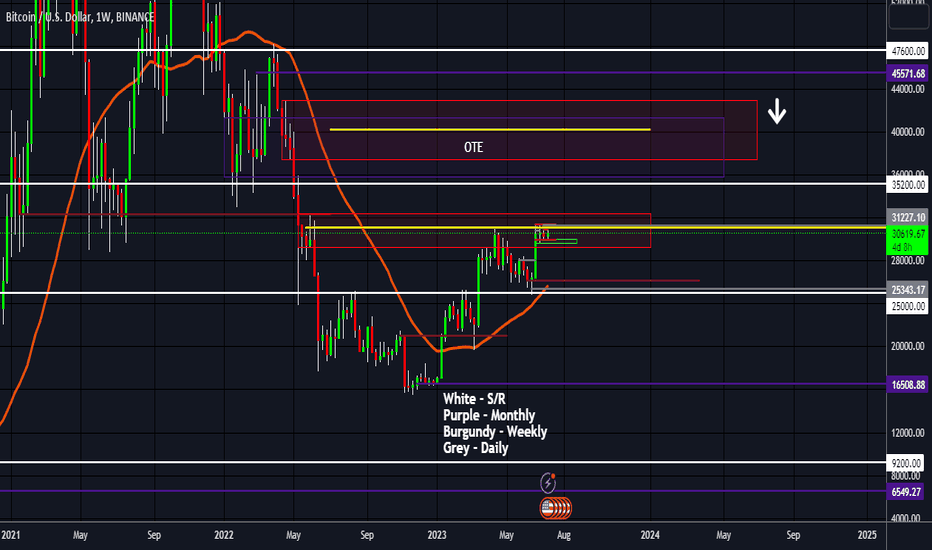
So, I would like to give a more updated view and opinion on Bitcoin from the weekly perspective. Bitcoin's price has been in a range since June, which can be seen from the H4 & Daily time frames. Suffice to say, it's bullish, but for how long is the question. I say that due to the fact that there's huge barriers up ahead waiting for price action to enter. Even though it's been ranging, I do believe price will breakout to the upside and continue to rally. I'm honestly anticipating the bears to re-enter the market once it reaches my A.O.I. I analyze multiple time frames in order to build a directional bias, and three out of the four time frames is telling me bull. Again I say, I'm looking for the bears to swarm the bulls. If not, I am completely bullish after a break of the $45600. I'll update as price progresses.. M - 🐻 W - 🐂 D - 🐂 H4 - 🐂I anticipate the H4 to turn bearish before the daily candle close today. If so, which is highly likely, I would then look to see if the daily follow suit.The H4 flipped bearish on the 14th... will it cascade over other time frames? 🧐 P.S. The daily is bearish, too. M - 🐻 W - 🐂 D - 🐻 H4 - 🐻I would anticipate a small rally to the $30547 - $30600 range before continuation to the downside. If p.a. can break the $30547 then the trend would flip back bullish.H4 is definitely bearish now. If price happen to close below the $29610 level on the daily, that would indicate that it broke the daily range. Next stop could be below $28000. We shall see..Daily is most certainly bearish. Break of the $26160 will flip the weekly bearish, which means then all four time frames are showing bear. 🤷♂️🐻👀Price action is moving in corrective form, which typically happens after a significant level has been broken. I can see it retracing back toward the $30230 - $30550 range OR blowing pass the range in order to fill in some IMB, which is above the range. We shall see..Please remember $27587 ($27600). P.S. If it happens to blow pass it, then $26160. 👀Currently: M - 🐻 W - 🐂 D - 🐻 H4 - 🐻 A break of the $30230 will flip the H4 trend from bearish to bullish. Do I believe that will happen? It's possible, but I am anticipating price to fill in the IMB right below the level to continue to move further down. If not that, then I will look for a break of the $30230.H4 low was broken to the downside so, anticipate a retracement. A break of the $29535 level would flip it from bearish to bullish. I'm looking for bear continuation.P.A. broke above the $29535, which would signify that the H4 flipped. However, it could have very well been a sweep of liquidity. Especially considering that it was IMB resting above the $29535. If so, I would look for the $28930 to be broken for bearish continuation. We shall see..P.A. is at the high end of the curve ($29795), so now I'll look for the low ($28930) to be broken for further downward movement. If not that, I would look for the $29795 to be broken to the upside, which would also flip the H4 from bearish to bullish.The H4 flippled bullish.It looks as if Bitcoin is ready to head further down. The 1st stop is looking like it'll be $28000. I'll reserve my other opinions for later..Now that Bitcoin has broken further down as I previously stated, I'll now look to see price retrace back near the $28000 - $28700 range only to reverse to head down to potentially break the weekly's key low ($26160). A break of the $27100 will be viewed as a precursor for the start of the pullback phase. If not that, I would wait for price to flip the H4 ($30000) to then see if it'll end up flipping the daily as well. We shall see..1. Bearish impulsive 2. Descending 3. P.A. revisiting broken daily structure 4. P.A. on weekly key low I would anticipate upward movement, but move with caution.P.A. respected the weekly low, but it could be heading toward the $28685 - $29100 range before heading further down. If not that, I would look for the $30000 level to be broken for futher rallies. We shall see...P.A. broke the weekly key low. The next low it can come into is the $22000, which is also around old broken structure that was never revisited. I would anticipate a deep retracement (bullish) before the bears reeneter the market.I would anticipate price to flip bullish around the $25000 - $25350 range, which would start the retracement phase. I'm sure most don't want to accept the fact that Bitcoin's price is within a HTF bearish leg. Meaning the flow of price is actually on the bear's side UNTIL there's a HTF flip. For now, it's bear IMO. I'm hoping for a deep pullback in order to drive price down to my projections, which is below $20000. We shall see..Bearish impulsive + descending channel = usually upward movement. However, I believe the bull price action we witness is only a retracement UNTIL there's a flip from the HTF. We shall all see.. P.S. The key weekly low is intact, but price is within it.Currently: M - 🐻 W - 🐂 D - 🐻 H4 - 🐻 Directional bias is still giving more bear than bull. However, Bitcoin is indeed in a bear market so any bull movement should be traded with caution if you're looking to counter-trend trade. 🤷♂️P.A. reacting off weekly key low, bullish engulfing, which turned H4 bullish. Currently.IF this weekly can close like how it's currentlly forming... I can see next week's weekly candle being a strong bull. Key weekly low supported P.A., and if it closes in it's current state, then that would establish a new M.R.L. for the weekly, which indicates strong bullish momentum. We shall see... $35200 👀P.A. has been sandwiched between the $25000 S/R and the 50% PRZ ($31860). However, I believe that it's ready to move higher, but for how long, considering what is waiting up ahead. Do not be surprised if (or when) price reaches a certain area, and it more than likely find strong bear rejection that'll assist in moving price pretty low. I'll reserve the rest of my opinion and we'll see how this plays out in the upcoming weeks, months..M - 🐻 W - 🐂 D - 🐂 H4 - 🐂Bullish impulsive followed by what looks to be an ascending channel forming right into a key area... bearish sentiment. We all shall see.The draw on liquidity is to the upside, but for how long... 🧐🤷♂️As I last stated (look up!)☝🏿 the draw on liquidity was to the upside, but now the tide could be changing very soon. A.O.I.: $45570 - $48240 What will I be looking to see once price reach that range? I'm looking for short candle bodies, top wicks, bear momentum to kick up. That's just to name a few, but I am ultimatley bullish. I would wait for a corrective move to start before considering to buy. I would like to see it retrace back around $31230Okay, so, here's there range where I'm anticipating the bears to enter: $45190 - $45750 "Sweet Spot": $45570 We shall all see. 👀This current downturn could be the start of the retracement phase. The H4 key low is being broken as I type this, so we shall look to see it cascade over to the daily. I would look for a lower timeframe rally in order to see the continuation form to the downside. Hold tight!It's looking like H4's key high ($44050) is about to be broken. If so, the new key low is this range 👉🏿 $41810 - $42275. Meaning that the H4 is bullish UNTIL price breaks through and closes below that range to the downside.Price broke through H4's key high yesterday (12/23/23), and it's now working on breaking the daily key high. What looks to be forming is a bullish impulsive followed by an ascending channel, which is bearish in nature. However, there's the new key low along with IMB waiting below to help propel price even higher. I'm still anticipating a nice drop before it really takes off. We all shall see...There was a sweep of the double tops on the daily. If price breakthrough the mid range levels, I would look for the $37300 as the 1st area for price to target.P.A. is forming an ascending channel on the daily. 👀🐻The ascending channel I mentioned on the 6th has been broken to the downside. Feel free to scale up to read some of my most recent commentary where I speak on this happening. I have a couple A.O.I. I'm keeping my eye on as price progresses. Looking for further continuation to the downside.Key H4 low was broken, and new daily lower high was created. 🐻I'm anticipating price to sweep the current LH ($43185 - $43600) before bearish continuation. We all shall see...Ladies and gents, we could actually be witnessing the start of the retracement phase gearing up due to price's current placement in the market. 1. Sweep of daily highs 2. Daily IMB 3. H4 IMB This is after price broke to the downside, while going through key levels. I would wait to see more price form to determine it's next move. The bears could be ready 🐻 We all shall see...I'm holding out for a retracement. Looking for $49387 to be broken to the downside. Will that be the start of the correction, finally? I'm no guru, but only time will tell. We all shall see...I'm anticipating price to close below $50K, followed by $48300. If so, I believe that's when the retracement phase will begin. We all shall see..If P.A. closes below $60K then the next potential level is $52K. 👀Daily mid-ranges have been established. Price could run the highs, which means the draw on liquidity is to the downside. Even if it's momentarily. The only way I would view it differently is if the mid-range holds to push price higher. Basically, if price sweeps the highs, I'd look for a break of the mid-range, retest, and drive down. We all shall see..👀 $50000 - $52500
ChrisJTradesFX
Coinbase
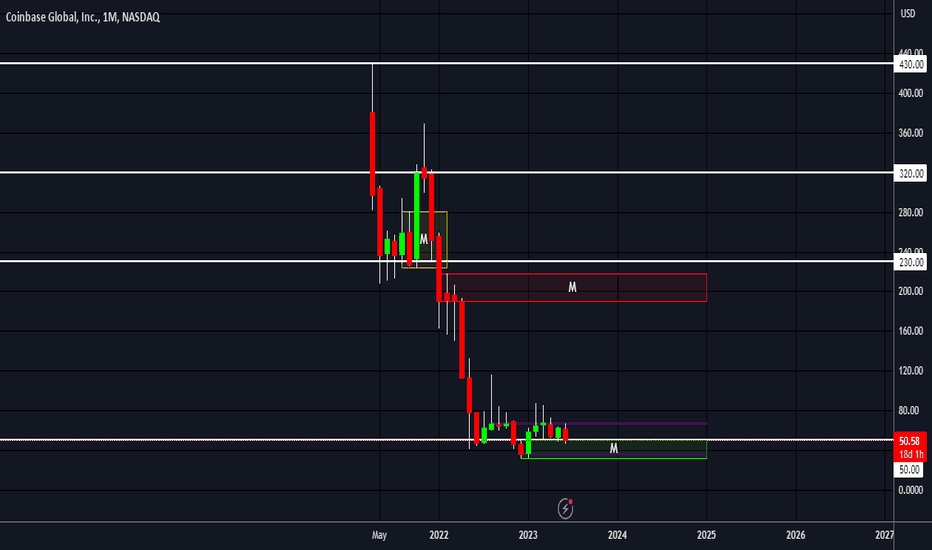
"Cathie Wood’s Ark Investment Management, the second-largest holder of Coinbase Global (COIN) stock, doubled down on its investment in the crypto exchange after the U.S. Securities and Exchange Exchange sued the only publicly traded crypto exchange sending share prices tumbling. ARK bought 419,324 shares of Coinbase, worth around $21.6 million based on Tuesday's closing price of $51.61." -Coindesk ...... Considering that this company's stock price is near it's lows, I can see why Ark Investment Management would make that move. I believe the shift begins once there's a break of the $67 level. Afterwards, it's next potential hurdle could be the $190 - $230 price range. However, I'll be even more bullish after a break of the $320.$35.40 is my A.O.I.Fundamentals: "SEC Says It May Make a Recommendation on Coinbase Petition Within 4 Months." -CoindeskP.A. tested the monthly range and showed positive movement from it. I'll still look for the range to be revisited before price actually takes off to the upside.P.A. broke two key levels at the end of last month on the weekly & monthly. Bullish sentiment. Fundamentals: "Too much uncertainty to prudently project revenues in future years." - Piper Sandler Laughable..P.A. is heading toward the weekly high ($93).I'm anticipating a reversal once the weekly high is hit. I would like to see it break below the $50 level to my A.O.I.Two key levels were broken to the upside. Bullish sentiment.I'm anticipating price to retrace to the $60 - $80 range before bullish contiuation. If not that, I'll look for support to be established only for the $105 to be broken for higher prices.Retracement phase after breaking through a HTF key high.A close above $116 will flip the monthly bullish. Clean candles to the left 👀P.A. broke to the upside on the Monthly and Weekly. Currently hovering below monthly supply, and broken structure above that supply. It can very well spike the range to test the broken structure before the retracement phase begin. If so, I would look for the new weekly key low to hold in order to propel price higher. We all shall see...
ChrisJTradesFX
AVAX/US DOLLAR
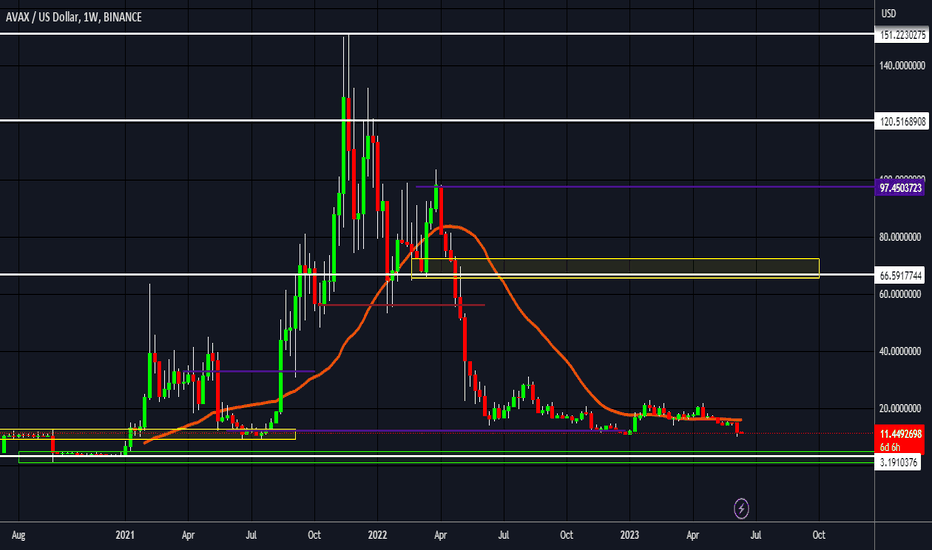
These are levels that I'll be keeping an eye on when dealing with AVAXUSD , and I'll revise as price action progresses. I adapt to the change in money flow. Fundamentals: Amazon Web Services (AWS) has partnered with Ava Labs in a bid to accelerate the adoption of blockchain technology by enterprises, institutions, and governments. The move has sent the linked Avalanche AVAXUSD token soaring higher in recent days, outperforming even Bitcoin amid a major bull run in the biggest cryptocurrency. *OLD ARTICLE* ..... Monthly: 1. P.A. broke a key low 2. Demand (untouched) below broken key low 3. Key S/R being revisited for 1st time 4. Key S/R rest within untouched demandOnce price shifts to the upside, I see the $56 - $75 range being it's 1st big hurdle.Weekly flipped bullish. Since that took place, the Daily and H4 flipped as well.
ChrisJTradesFX
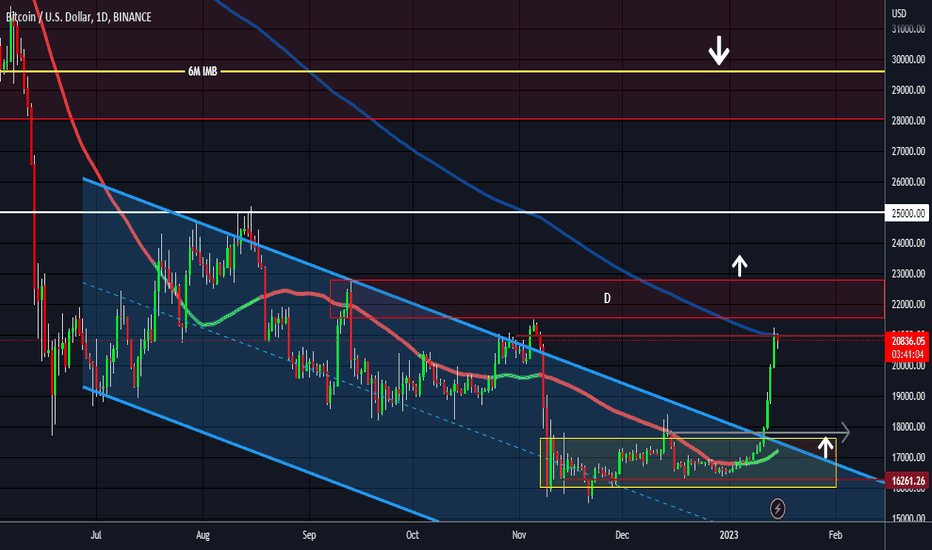
B I T C O I N
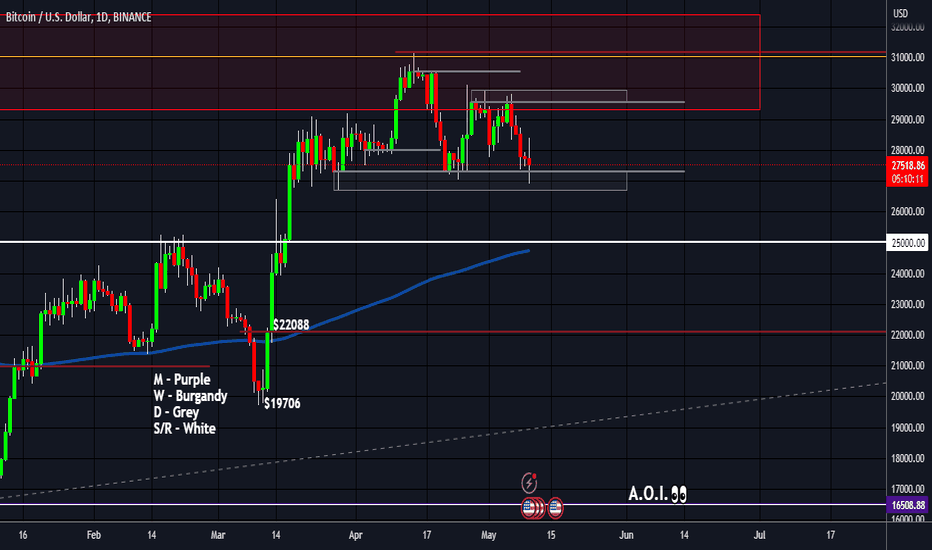
These are levels that I'll be keeping an eye on when dealing with BTC/USD, and I'll revise as price action progresses. I adapt to the change in money flow. Welp, the daily flipped bearish. However, Bitcoin is currently in a downtrend so, there's no surprise there along with the fact that price ran into a HTF supply. Basically, price is getting back inline with the overall trend, but if this range below price ($19706 - $22088) can give it support then I can see more upside movement. If not, I can see it heading towards $16510 which happens to be the low-end of the HTF range that price is presently within. We shall see...There might be a reaction if price get to the $19706 level. Liquidity.Considering that the overall is bearish, the daily flipped back to bearish, I would actually look for the $22088 level to be broken which is the HL on the weekly. if price closes below, that would indicate that the weekly flipped bearish. We shall see..If $25000 cannot act as support then I'll look to the $22088 level which is the weekly low.In order for Bitcoin to cointinue going up, it'll have to break & close above $30000. However, I don't believe that's going to happen at this particular time. We shall see..Get ready for $25,000. 👀 If P.A. cannot find support at that level I'll then keep an eye on the $22,100 level.I'm anticipating 1 - 2 more bullish legs to form in order for price action to run within $34500 - $40000. If so, I'll then look for key levels to be broken in bear's favor. Anything other than that, a break of the $45750 level will flip the trend imo. Weekly perspective. We shall see..Bitcoin finally had a break below key support on the daily. $25000 is looking like price's next target. 🤷♂️I wouldn't be as excited on this current rally. Read the previous price, and you should understand why I say that. 🐻$25000 is up next! I'll be looking to see if price will find support between the $22100 - $25000 range. We shall see...I called it. $25000. If $25000 - $22100 cannot act as support, then $16500 is next.Fundamentals: "BlackRock Close to Filing For Bitcoin ETF" - CoindeskFundamentals: "Binance launches Bitcoin mining cloud services amid SEC crackdown in the US" - CointelegraphPrice found support at the $25000 level. I'll look for Bitcoin to break the weekly range, hit above the $31100, hold and move up to this massive behemoth that's been waiting on price to reach it. We shall see... P.S. The range starts at $35200 and ends at $43000. $45600 would flip the whole trend from bearish to bullish on the higher perspective.I would look to see if price will hit the $31315 level. If so, I would anticipate a downturn, even if it's short term. If not that, I'd look for a break of that level for continuation to the upside where there's something huge uptop waiting for price.P.A. hit the $31315. I'll look to see if it'll be respected or not, but for now, it has repelled from the level.***I'LL MAKE A MORE UPDATED PUBLISHED IDEA ON BITCOIN***Looking like it's ready to break below the $30000 mark. If so, next location of interest is $27200.The $30000 level was hit, price could head toward the $30920 then more drawndown. We shall see..Triple top at the $30922. I'll anticipate a sweep of those highs to the $31315 to head further down UNLESS there's a break of the $31315.
ChrisJTradesFX
Ethererum
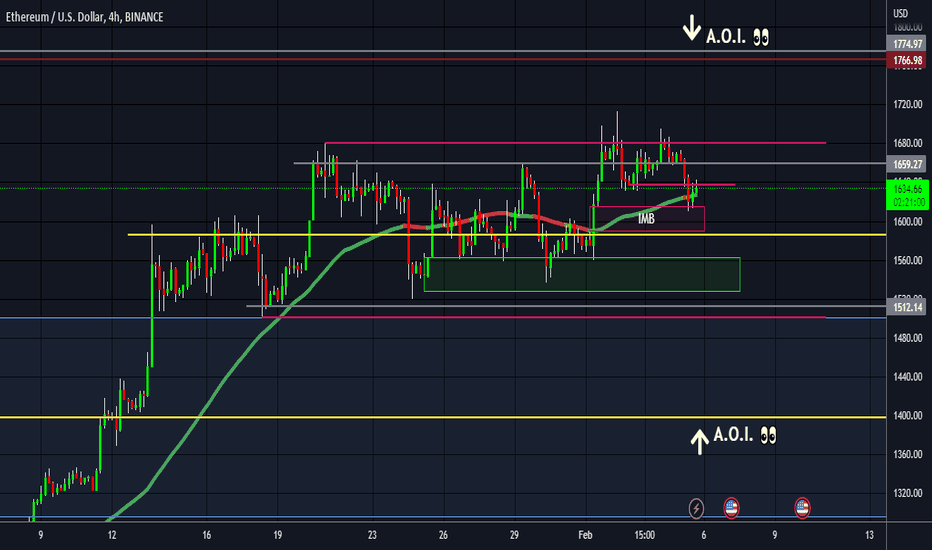
These are levels that I'll be keeping an eye on when dealing with ETHUSD, and I'll revise as price action progresses.I adapt to the change in money flow.This is short-term movement I'm tracking, but soon I'll do an analysis from the higher timeframe perspective. Price had a bullish impulsive and now it's forming an ascending channel to two key levels which is where I'm anticipating for it to flip from bullish to bearish. It's a possibility it can fall short of reaching the levels if there's enough pressure in the area. We shall see...P.S. I am overall bullish on this crypto.P.A. was able to find support within the imbalance, so it's still forming the ascending channel. It can be seen a lot easier from the daily perspective.This is the 3rd hit on the H4H, so there's only a matter of time before it's broken. I'll keep an eye on the $1626 - $1645 range if price happens to retrace.P.A. swept liquidity after breaking below the H4 low, breaking structures to the upside. I'll now look for price to reach the $1775 level which is the area I would like to see price flip from bullish to bearish. We shall see..I'll be looking for rejection wicks around the $1797 price point (area). 👀I'm looking forward to seeing $1725 getting swept then price falling around the $1600 level where there's a:1. Untouched H4 range2. Daily EQ3. H4 IMB4. GZ/OTE LEVELS👀P.A. fell into everything above this comment I've mentioned, and responded in bullish fashion. ☝🏿Anticipating more downward movement if price breakthrough the $1720 level, and $1845 for bullish continuation.
ChrisJTradesFX
Bitcoin UPdate
These are levels that I'll be keeping an eye on when dealing with BTC, and I'll revise as price action progresses. I adapt to the change in money flow. I'm curious to see how this plays out, but I do believe some will be on the losing side due to this current rally. What waits ahead is huge, and can potentially drive Bitcoin's price lower than where it was recently consolidating. Multiple time frame analysis is so important. I would anticipate a break of the Daily range, and a retest. However, if the momentum is enough I wouldn't look for a pullback.. just continuation. We shall see.."Blackrock Inc., the world's largest asset manager, launched a Bitcoin fund."BlackRock Inc. is offering its first-ever investment product directly in Bitcoin, marking a significant move into crypto markets by the world's largest asset manager.Seeing that price been hovering around the most current daily high for a few days, I would anticipate a move down due to the bear pressure. Not to mention the liquidity resting above the high. If I were to take a short term trade, it'll be at the high down to the daily EQ ($18,660). ***NOT TO BE TAKEN AS TRADING ADVICE***Daily high plus bearish range has been broken. What I see is a rally followed by an ascending channel that's forming. I would look for the bears to enter the market around the $25 price point. We shall see..$25k is where I'm anticipating the bears to enter the market.P.A. made it up to the $25K price point. I'm actually anticipating a flip in it's current area. However, it more than likely won't go far down since there's imbalance ($17,194 - $20,393) resting underneath price. I would wait for a break of the $24,555 level. If not that, I would wait for price to reach that huge range up above to knock it down. Look to the monthly and beyond to locate the clues..The $24,555 was broken. Bearish sentiment. 👀🐻'V' shape forming on H4. If valid, I'll wait for P.A. to get above/retest the $25,200.Looking for the H4H ($24460) to get swept, so P.A. can drop between the $21383 - $22400 which is also the area from which it came from since it broke daily structure to the upside. This potential downside move can be viewed as a retracement. We shall see..$18800 👀P.A. hit weekly imbalance.Bitcoin finally closed above $25K. However, I am anticipating the bears to re-enter the market in strong fashion. We shall see..Bitcoin is still considered bearish in my opinion. 🤷♂️Daily ledge was breached, but not broken. Precursor. 🐻 P.A. will more than likely sweep the equal highs ($28811), and if it breakthrough the $26860 level then I would anticipate it's 1st stop to be $25K. We shall seeI'm anticipating the bears to enter the market around the $28400 level. 👀$26860 has been breached. Bearish sentiment.P.A. is forming an ascending channel while at the beginning of a huge bearish barrier. This might not be a good time to look for buys. 🗣 NOT FINANCIAL ADVICE‼$31790 🐻🧐Looks like P.A. is currently respecting the $31790 level. I would turn bearish for the moment IF it were to break below the $27830 level. We shall seeI'll be sure to create a new published idea on Bitcoin. However, I'm looking for the trend to flip from bullish to bearish between $35200 - $41360. If bulls continue to dominate, I'll then look for P.A. to breach/break the $45500 which is the level that can ultimately turn the trend to overall bulls. We shall see..New published idea is UP!
Disclaimer
Any content and materials included in Sahmeto's website and official communication channels are a compilation of personal opinions and analyses and are not binding. They do not constitute any recommendation for buying, selling, entering or exiting the stock market and cryptocurrency market. Also, all news and analyses included in the website and channels are merely republished information from official and unofficial domestic and foreign sources, and it is obvious that users of the said content are responsible for following up and ensuring the authenticity and accuracy of the materials. Therefore, while disclaiming responsibility, it is declared that the responsibility for any decision-making, action, and potential profit and loss in the capital market and cryptocurrency market lies with the trader.