
Ben_1148x2
@t_Ben_1148x2

What symbols does the trader recommend buying?
Purchase History
پیام های تریدر
Filter
Ben_1148x2

LINK with volume candles and OBV, looking like a failed breakout. Low volume throughout the inverted h&s. It's gotten above the AVWAP from ATH but has stronger volume selling into the retest. I wouldn't be surprised to see it come back to 12.80-14.50.
Ben_1148x2

FETUSD The volume-weighted moving average (VWMA) anchored to the October 2023 momentum breakout has acted as support. FET is now testing the Anchored VWAP (AVWAP) from the beginning of the December 2023 consolidation. When it cleared this AVWAP in February, it went on to make a 400% move to the March high. FET has also reclaimed its 21 VWMA and 200 SMA. The 200WMA:200SMA cloud is positive, and it is testing the 50 EMA and 200 WMA. We also have a positive signal crossover on the LMACD and the composite index. These are all favorable signs, but I will look for additional confirmation before making a move. I'd like to see it clear the AVWAP from the March high and clear and retest the 0.618-0.786 Fibonacci retracement levels. This suggests a potential for gains in the $3.00-$3.50 range at the lower end, with the possibility of reaching a new high in the $4-$5 range. This scenario would be invalidated and require new analysis if we see a move below ~$1.25. Don't forget that we also have the coin merger with OCEAN and AGIX into FET in July, followed by a conversion to ASI. Depending on how the merger goes and other market conditions, this news event could be a short-term catalyst for either a move higher or a panic selloff. I remain very optimistic about the long-term opportunity.
Ben_1148x2

BTC's 18 month uptrend started w/ the inverted hammer on 1/9/23. Green AVWAPs tied to that candle have been great buying opportunities since. Including now we have 7 full rollovers in the composite index, followed by 5-22% drawdowns. 5 of these drawdown far enough to test one of those AVWAPs. Price is currently at the 0.786 retrace from the last test of the AVWAP and positive momentum crossover to the most recent high. A close below this level implies continuation to 1.272 to 1.618 (55.9-58.7). BTCUSDBTC's 18-month uptrend started with the inverted hammer on 1/9/23. Green AVWAPs tied to that candle have been great buying opportunities since. The price is currently at the 0.786 retrace from the last test of the AVWAP and positive momentum crossover to the most recent high. A close below this level implies continuation to 1.272 to 1.618 (55.9-58.7). A full rollover in the composite index occurs when the fast RSI momentum line crosses below the slow RSI momentum line, followed by the composite index line crossing below both. Note how responsive the divergences in the composite index line are. Including now, we have 7 full rollovers in the composite index, followed by 5-22% drawdowns. 5 of the prior 6 of these have drawn down far enough to test one of the green AVWAPs. 4 out of 6 of the prior downward composite index crossovers were followed by drawdowns that ranged from approximately 17-22% and took about 40-50 days to play out, while 2 ranged from approximately 4-12% and took 7-9 days to play out. The current drawdown is at 8.5% and has taken place over 14 days. Reaching the 1.272 level would equate to a 15.5% drawdown, and the 1.618 level would be roughly 20%.
Ben_1148x2
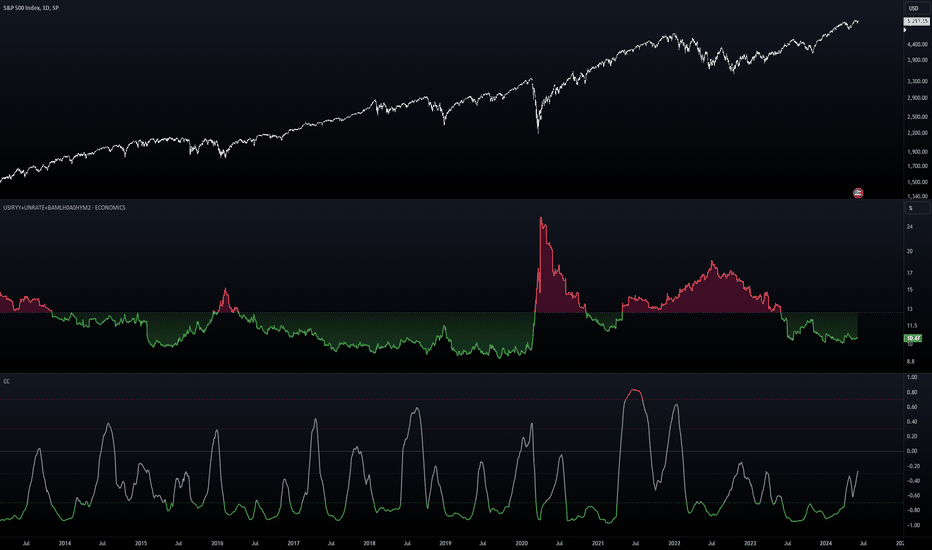
Misery index. YoY inflation + high yield spread + unemployment. When it's above about 13-15, and/or when the market and the misery index move up in correlation, we tend to see a pullback
Ben_1148x2

I really like the price structure that we're seeing from $INDEX:BTCUSD. The weekly KST and Chaikin signal remains intact, the daily chart shows promising pattern and trend, and the 4hr chart is showing a breakout. Weekly KST & Chaikin This chart uses the KST indicator in the middle, which combines multiple rates of change to identify momentum. On the bottom it uses the Chaikin oscillator which is essentially accumulation vs distribution in money flow. The Chaikin oscillator is overlayed with a Bollinger band. On a weekly time frame the KST has given reliable signal, but also several false positives. We can use the Chaikin oscillator to confirm entry and exit opportunities. A new uptrend is signaled when KST is bullish and the Chaikin oscillator breaks above its upper Bollinger band. When KST turns bearish we can confirm when the Chaikin oscillator OR the lower Bollinger band move below 0. This is important because what we are seeing today looks like what we saw in the 2016 opportunity. This strategy has signaled 8 trading opportunities since 2010, all with positive returns. Four of the opportunities had durations of 120-200 days from entry to exit. Three of the more extreme opportunities had durations of 280, 640, and 1000 days. It almost goes without saying that the most extreme opportunities came in the earliest days. KST 2010-2014 KST 2015-2019 - note 2016 where KST is bullish but the Chaikin and BB remain above 0. KST 2020-current Daily Timeframe On the daily I am showing 2 green anchored VWAPS that are tied back to a candle in January 2023 where recovery began. Fib extension, fib retrace, and the break above and support at 68k were all very constructive. We can almost make a case for an inverted head and shoulders. It appears in continuation and not as a reversal pattern. So, while bullish, a measured range of this pattern is not enough to go on. Using forward Fib time zone from the beginning of January to the January low, a reverse Fib time zone with the 144 on the January low, and a FIb fan from the January low to the February 26 retest give us great confluence for an area of interest ranging up to $78k. 4hr Chart Lastly, a closer look on the 4hr chart shows a break above and retest of the descending trendline from the 5/21 high. In this timeframe we can see a measured range from the May low to the break above the red anchored VWAP from the March high, along with two fib retraces offering confluence for a range of 74-75.6k.
Ben_1148x2
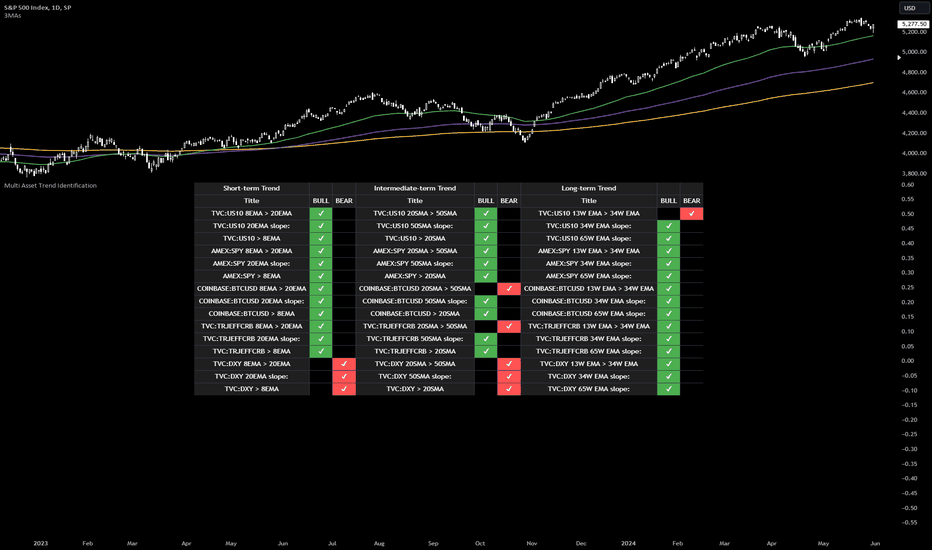
Equities have the strongest short, intermediate, and long term trend. The trend for the US10yr has shown a bit of strength inf the short and medium term. Short term trends for Bitcoin and commodities are favorable, with some intermediate weakness. The DXY is bearish on short and intermediate timeframes. SPX US10 BTCUSD DXY
Ben_1148x2

FETUSDT is setting up for a great opportunity. I'd like to see it clear the blue VWAP anchored to the March high. I'll likely take an entry on breakout and a 2nd on a retest.
Ben_1148x2

GOLD had a great retest of the 0.382. and momentum is signaling a move higher. I like profit taking at a retest of 2430, at a measured move to 2497, and at 2535-2580.
Ben_1148x2

TIAUSD had a great run in the second half of 2023 but has cooled off in 2024. I've kept it on my watch list for future opportunities and it's had very predictable movement throughout this fib fan. The current declining price diverges with the composite index, price momentum oscillator, and detrend oscillator. Previously this has led to at least a minor upward bounce. If playing this one, I would sell into strength and reaccumulate on retests of a confirmed uptrend. If entering here (~11.90), I like a stop at ~10.50, initial profit taking at ~13.90. I would expect additional overhead resistance at 14.75 and between 16.50-17.25.
Ben_1148x2

JTOUSDT is one to keep watching this cycle. First target reached for this trade. Next will be ~4.07, then ~4.50 target.
Disclaimer
Any content and materials included in Sahmeto's website and official communication channels are a compilation of personal opinions and analyses and are not binding. They do not constitute any recommendation for buying, selling, entering or exiting the stock market and cryptocurrency market. Also, all news and analyses included in the website and channels are merely republished information from official and unofficial domestic and foreign sources, and it is obvious that users of the said content are responsible for following up and ensuring the authenticity and accuracy of the materials. Therefore, while disclaiming responsibility, it is declared that the responsibility for any decision-making, action, and potential profit and loss in the capital market and cryptocurrency market lies with the trader.