
AxiomEx
@t_AxiomEx

What symbols does the trader recommend buying?
Purchase History
پیام های تریدر
Filter
AxiomEx
Bitcoin (BTC/USD)

Bearish Scenario: Entry Point for Short: Consider initiating short positions below $50,000, with confirmation of continued bearish momentum. Target Levels: $45,000 (Immediate Support), $40,000 (Key Psychological Level) Stop Loss: Place a stop loss at $53,000 to protect against sudden bullish reversals. Bullish Reversal Scenario: Entry Point for Long: A confirmed break above $55,000 may suggest bullish reversal potential, targeting previous resistance levels. Target Levels: $60,000 (Resistance Level), $65,000 (Key Resistance) Stop Loss: Implement a stop loss at $48,000 to limit downside risk. The recent candlestick patterns show a clear bearish engulfing pattern, signaling potential continuation of the downward trend. The price action indicates a failure to maintain previous support levels around $58,000, leading to increased selling pressure and panic among retail investors. Current technical landscape suggests a strong bearish outlook in the short term, driven by negative momentum indicators and external market factors. However, the long-term trend remains bullish, with potential for recovery if market sentiment shifts positively. Investors should remain cautious, monitoring key support and resistance levels for strategic trading opportunities. The speculative price target for Bitcoin remains volatile, with a potential downside to $40,000 if bearish trends continue, while a bullish reversal could propel prices back to $65,000, contingent upon favorable market conditions and regulatory clarity.
AxiomEx
$XRP Detailed Technical Analysis and Speculative Price Targets!

XRP/USD is currently trading at $0.5971, showing a minor decline of 0.99% in the past 24 hours. The overall sentiment from technical indicators and recent price action suggests potential volatility and key levels to watch for both short and long positions. Support Levels: The critical support levels for XRP are at $0.4592 (S1) and $0.4126 (S2) based on Fibonacci retracement and pivot points. Resistance Levels: Key resistance levels are identified at $0.5169 (R1) and $0.5636 (R2). A breach above these could signal further bullish momentum. Short-Term: The exponential moving averages (EMAs) for 10 and 20 periods are bullish, with prices above these averages, indicating a potential short-term uptrend. Long-Term: The 200-period SMA is positioned at $0.5435, acting as a significant support and reinforcing the bullish outlook if prices remain above this level. Relative Strength Index (RSI): Currently at 61.76, RSI is in the neutral to slightly bullish zone, suggesting room for upside before hitting overbought conditions. MACD: The MACD level shows a slight bullish crossover, indicating potential upward momentum. Stochastic Oscillator: At 75.38, the stochastic is nearing overbought territory, warning of a potential pullback or consolidation phase. Ichimoku Cloud Analysis: The Ichimoku cloud indicates a bullish trend with the price trading above the cloud, suggesting support and momentum favoring the bulls. Current News Impact Recent developments in the Ripple vs. SEC lawsuit remain a significant factor influencing XRP's price. With the case nearing a resolution, market sentiment is cautiously optimistic. A favorable outcome for Ripple could trigger a substantial rally in XRP prices. Long Position: Entry Point: Above $0.615 (confirmation of breakout above current resistance). Target: $0.650 and $0.690 (short-term), $0.750 (medium-term). Stop Loss: $0.580 (to manage downside risk). Short Position: Entry Point: Below $0.550 (confirmation of breakdown below support). Target: $0.500 and $0.450. Stop Loss: $0.575 (to limit potential losses). Speculative Price Targets and Risk Management Given the technical setup and market conditions, XRP could see significant price action in the coming weeks. A bullish breakout could push prices towards the $0.650-$0.750 range, while a bearish breakdown could see a retest of the $0.500 support zone. XRP is poised for potential significant moves, with technical indicators suggesting a bullish bias in the short to medium term. However, traders should remain vigilant of key support and resistance levels and manage risks appropriately. The outcome of the Ripple vs. SEC case will be a critical factor in determining the future direction of XRP prices.
AxiomEx
Bitcoin’s Bullish Momentum.

Long Position Entry: $66,800 (current price level) Take Profit: $70,000 (first target), $77,000 (extended target) Stop Loss: $64,000 (below recent support level to minimize risk) Consider shorting only if BTCUSD falls below $64,000, indicating a potential trend reversal. Entry: $63,800 Take Profit: $60,000 (first target), $56,730.35 (extended target) Stop Loss: $65,000 Bitcoin’s price is currently trading around $66,733.57, showcasing a small green candlestick indicating mild bullish pressure. The recent price action has managed to break above the Ichimoku Cloud, a significant bullish signal, suggesting that the current uptrend might have the strength to continue. The candlesticks show a pattern of higher highs and higher lows, further solidifying the bullish sentiment. The formation of the candlestick on the daily chart indicates that buyers are gradually regaining control, pushing the price upwards with moderate volume support. Recent highlights that Bitcoin has crossed the $FWB:67K mark as altcoins see considerable gains. The market sentiment is currently bullish, with increased institutional interest and positive developments in regulatory frameworks, further boosting investor confidence. Given the current technical setup, Bitcoin is likely to continue its upward trajectory, targeting the next resistance at $70,290.11. A break above this level could propel BTC towards the $77,911.95 mark.
AxiomEx
Solana

Solana's robust performance and favorable technical indicators suggest a promising rally. Stay updated with market news to adjust positions accordingly. Short-term: $160 Mid-term: $175 Long-term: $200 Long Position: Enter at $145.01, target $160, stop loss at $135. Short Position: Consider shorting below $131.99, target $120, stop loss at $140.
AxiomEx
Is AMZN Ready to Break $200?
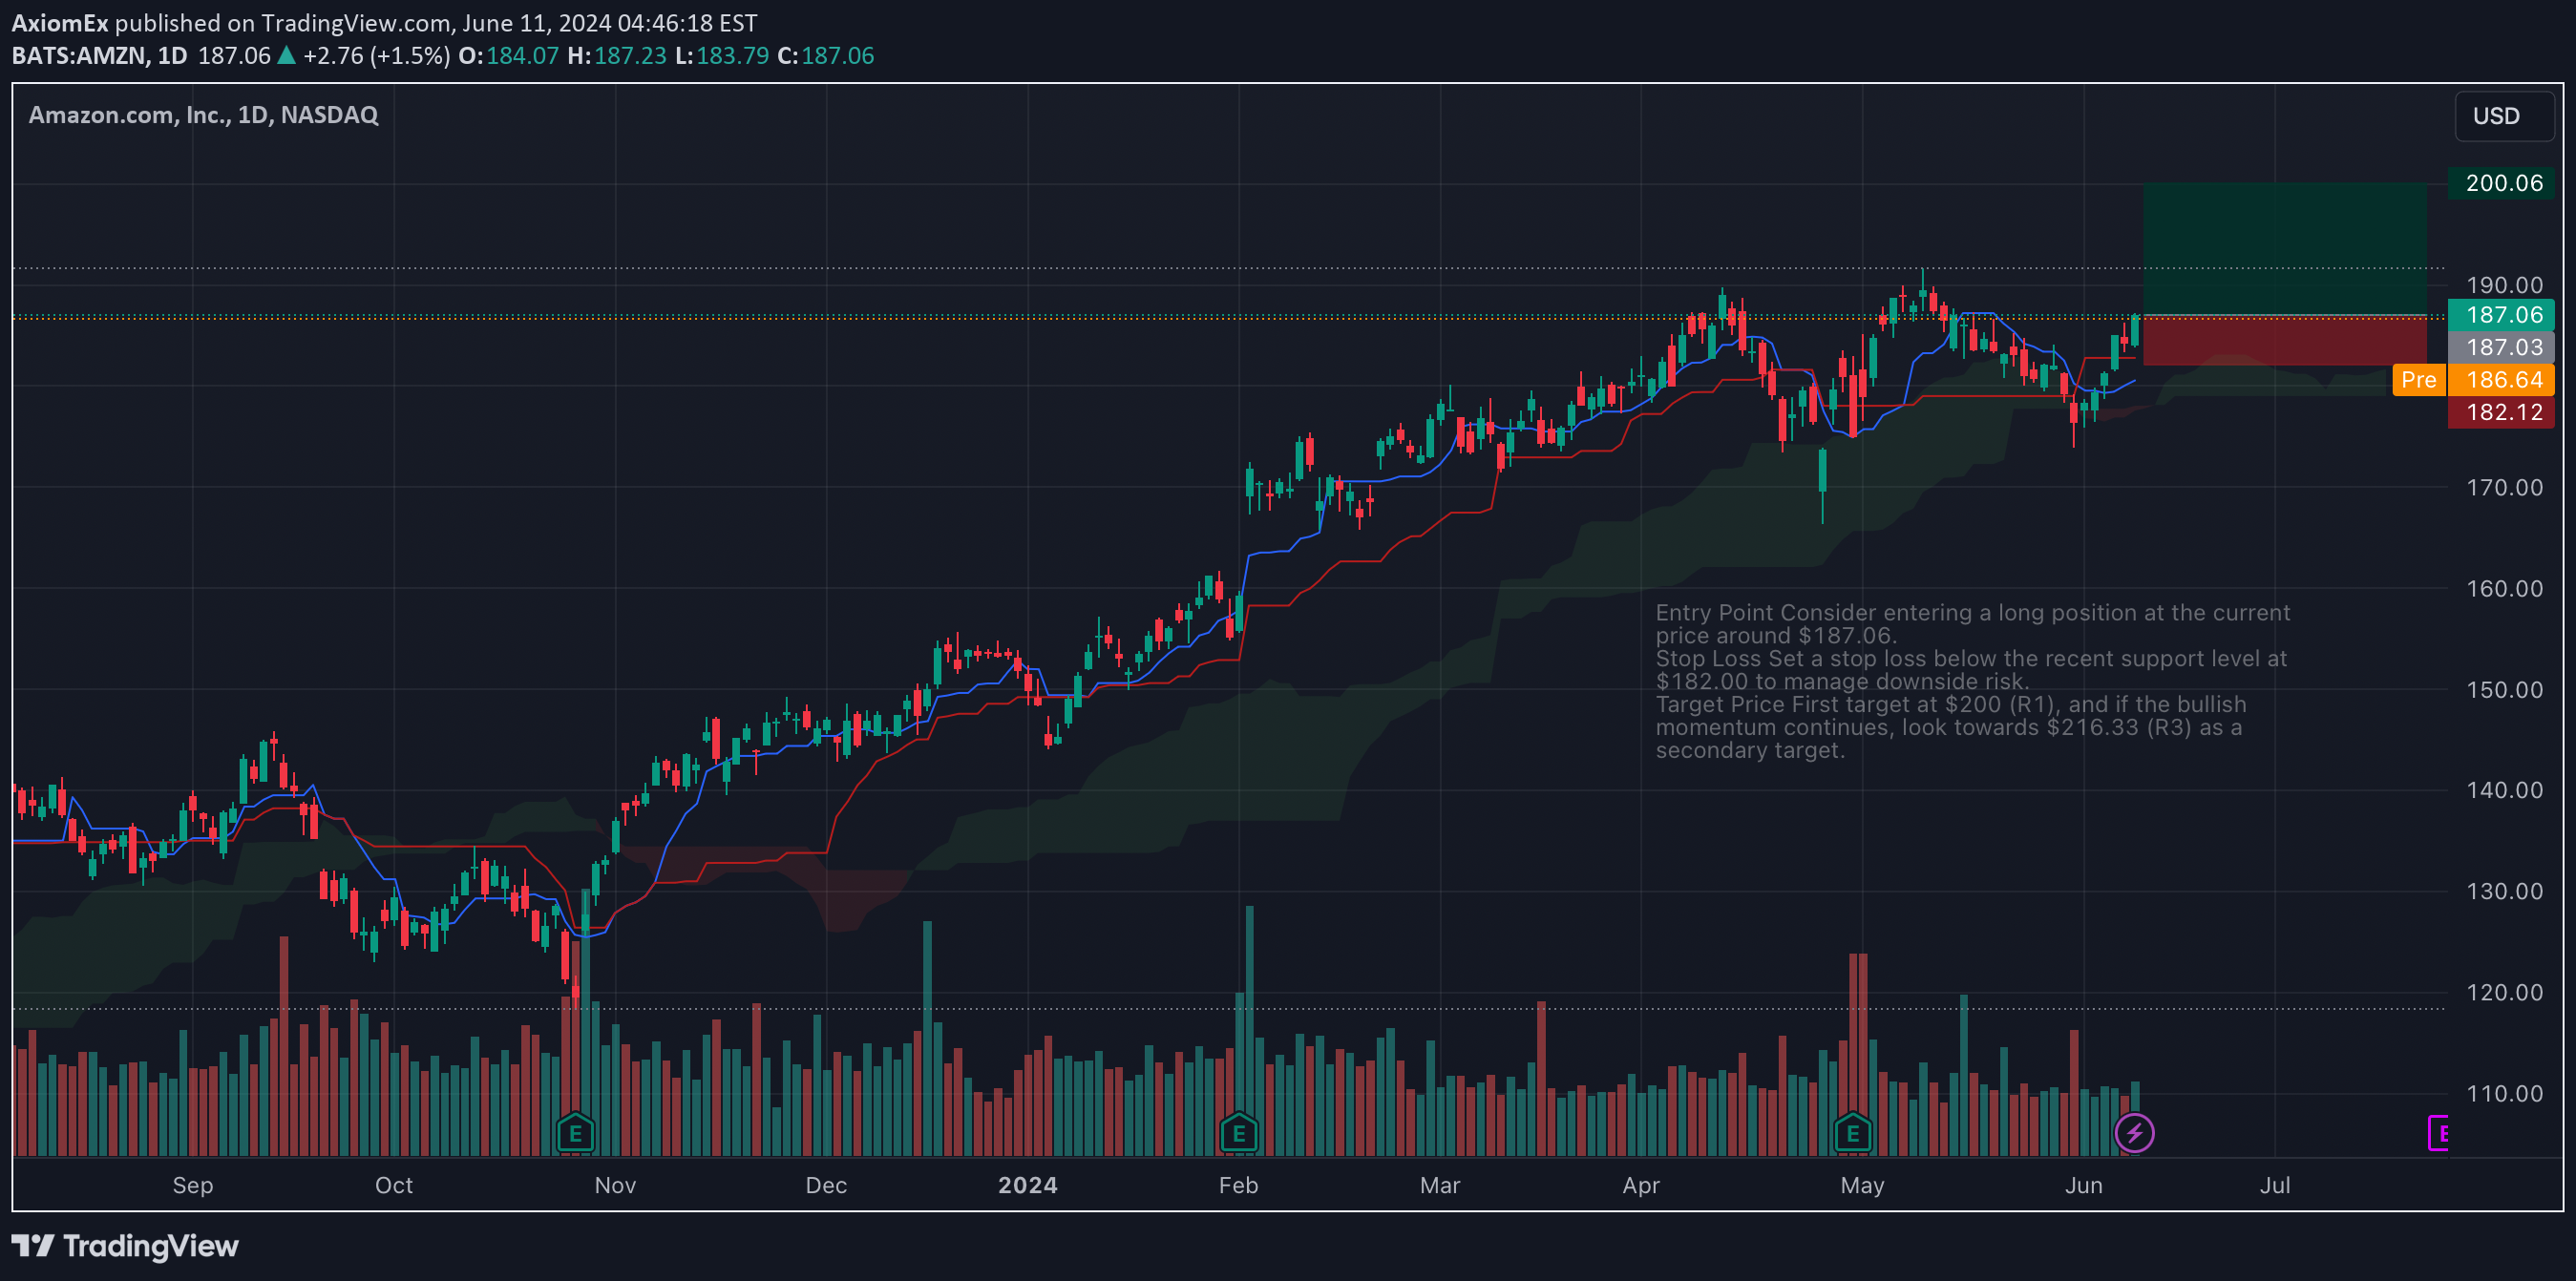
Amazon.com Inc. (NASDAQ: AMZN) is demonstrating robust performance amidst a backdrop of market volatility. With its stock currently trading around $187.06 in pre-market action, Amazon is poised for significant movements. Let's dive into a detailed technical analysis to explore potential trading opportunities, leveraging indicators, candlestick patterns, and the latest financial news. The daily candlestick chart for Amazon displays a notable bullish momentum. The latest candles are trading above key moving averages, including the 10, 20, 50, and 200-day Exponential Moving Averages (EMAs). This bullish engulfing pattern suggests a potential continuation of the upward trend. The price is trading above the Ichimoku Cloud, indicating a strong bullish trend. The conversion line (blue) is above the base line (red), further confirming the upward momentum. The span A is above span B, reinforcing the bullish outlook. This setup is traditionally a signal to enter long positions. RSI (14) The Relative Strength Index is at 59.70, indicating that the stock is in neutral territory but leaning towards overbought conditions. MACD The Moving Average Convergence Divergence (MACD) is positive at 0.20, with the MACD line crossing above the signal line, suggesting a buy. Stochastic Oscillator At 89.08, it shows the stock is approaching overbought levels but can still sustain upward momentum. Awesome Oscillator Slightly negative at -0.17 but insignificant to alter the bullish stance significantly. Amazon’s market capitalization stands at an impressive $1.95 trillion, with a Price to Earnings Ratio (P/E) of 51.76, highlighting investor confidence in its growth potential. The company’s revenue for 2023 is strong, and the forecast suggests continued growth, especially in the cloud computing segment, Amazon Web Services (AWS). Expansion in AI and Cloud Amazon’s recent initiatives in AI and further expansion in cloud services are creating positive market sentiment. Reports of AWS securing significant new contracts could propel stock prices further. Consumer Demand Despite broader economic concerns, Amazon’s dominance in e-commerce and its ability to adapt to consumer trends positions it well against competitors. Amazon’s trading volume is substantial, with an average volume of 40.83 million over the past 30 days, indicating strong investor interest. The recent price action shows a clear breakout above the $185 resistance level, suggesting that the stock could test the $200 psychological level soon. Resistance Levels (R1, R2, R3) $187.48, $198.50, and $216.33 respectively Support Levels (S1, S2, S3) $169.64, $162.84, and $145.01 respectively Trade Strategy and Price Targets Long Position Entry Point Consider entering a long position at the current price around $187.06. Stop Loss Set a stop loss below the recent support level at $182.00 to manage downside risk. Target Price First target at $200 (R1), and if the bullish momentum continues, look towards $216.33 (R3) as a secondary target. Short Position Entry Point Only consider shorting if the price breaks below the $180.67 pivot point. Stop Loss Place a stop loss at $185.00. Target Price Initial target at $169.64 (S1), and further downside potential towards $162.84 (S2) if the bearish trend intensifies. Amazon's stock is currently exhibiting strong bullish signals, supported by technical indicators and positive market sentiment. With a potential breakout above $200, there are compelling opportunities for long positions. However, traders should remain vigilant for any signs of a trend reversal and manage risk through well-placed stop losses.
AxiomEx
Notcoin: The Explosive Surge and Strategic Opportunities.

Notcoin (NOTUSD) has experienced a significant surge, with a current price of $0.0212172, reflecting a 33.90% increase. The weekly performance shows an impressive 297.73% gain, indicating strong bullish momentum. Volume and Market Capitalization: The 24-hour trading volume stands at 2.47 billion USD, highlighting substantial investor interest and liquidity. The market capitalization is 2.177 billion USD, with a circulating supply of 102.719 billion coins, implying a relatively high supply but currently matched by high demand. Candlestick Patterns and Trends: The recent candlestick formations exhibit a strong upward trend, with multiple consecutive bullish candles. The 4-hour chart shows a robust rally, supported by bullish momentum and a clear breakout from previous resistance levels. Indicators Analysis: Ichimoku Cloud: The price is trading well above the Ichimoku Cloud, indicating a strong bullish trend. Conversion Line (9, 26, 52, 26) at 0.0150292 is above the Base Line, reinforcing the bullish signal. Relative Strength Index (RSI): RSI (14) is at 91.76, suggesting overbought conditions. However, in a strong trend, overbought conditions can persist. Moving Averages: All key moving averages (10, 20, 30, 50, 100) are aligned upwards, supporting the bullish bias. Exponential Moving Average (10) at 0.0168682 and Simple Moving Average (10) at 0.0159912 indicate strong short-term bullish momentum. Momentum and Oscillators: Momentum (10) at 0.0095365 and MACD Level (12, 26) at 0.0025647 are in positive territory, confirming the bullish trend. Commodity Channel Index (20) at 185.8766280 signals potential overbought conditions but remains within the bullish threshold. Key Support and Resistance Levels: Support: Immediate support at 0.0153149 (previous consolidation zone). Strong support at 0.0101523 (50-day SMA). Resistance: Immediate resistance at 0.0250000 (psychological level). Further resistance at 0.0300000 (Fibonacci extension level). Trading Strategy: Long Position: Entry: Enter a long position at the current price of 0.0212172. Price Target: Short-term target at 0.0250000, with a potential extension to 0.0300000 if momentum sustains. Stop Loss: Set a stop loss at 0.0150000 to protect against downside risk. Short Position: Entry: Consider shorting if the price breaks below the key support of 0.0153149. Price Target: Target a pullback to 0.0101523. Stop Loss: Set a stop loss at 0.0180000 to manage risk. Speculative Price Targets: Based on the current bullish momentum and technical indicators, the speculative price target for Notcoin could reach 0.0300000 in the short term if the uptrend continues and market sentiment remains positive. Notcoin’s recent price surge is supported by several significant developments. The project has transitioned from its initial mining phase to a new rewards model that focuses on sustainability and value. Notcoin plans to introduce “Notcoin Explore,” a feature that includes games and contests to engage users. Additionally, the game will now reward players by purchasing Notcoins from the secondary market, thereby fueling gameplay rewards without minting new tokens. This strategic shift aims to create a decentralized and evolving ecosystem with community input over the next 4-5 years
AxiomEx
Bitcoin's Critical Juncture.

Bitcoin (BTC) has been exhibiting interesting price movements and technical indicators suggesting significant future price actions. The current price is hovering around $67,882, reflecting a slight downturn of 0.66%. However, several key indicators and chart patterns suggest that a critical juncture is imminent. Ichimoku Cloud Analysis: The price is trading below the Ichimoku cloud, indicating bearish sentiment. The Tenkan-Sen (Conversion Line) and Kijun-Sen (Base Line) are also showing bearish crossovers. The Lagging Span is below the price, further reinforcing the bearish trend. MACD (Moving Average Convergence Divergence): The MACD line is below the signal line, and the histogram is in the negative territory, which is a bearish sign. However, the MACD is near the zero line, suggesting a potential for a bullish crossover. Stochastic RSI: The Stochastic RSI shows an oversold condition with a value of 0.85, indicating a potential for a short-term bounce or reversal. Relative Strength Index (RSI): The RSI is at 39.74, suggesting that the market is in a bearish zone but not yet oversold. This implies room for further downside movement before a potential reversal. Commodity Channel Index (CCI): The CCI is at -178.10, indicating an oversold condition, which could signal a buying opportunity if the price starts to reverse. Volume Analysis: There is a noticeable increase in trading volume, indicating strong interest and potential for volatility. The OBV (On-Balance Volume) is showing a downward trend, suggesting that selling pressure outweighs buying pressure. Pivot Points: The price is below the pivot point of $68,836.92, with support levels at $66,574.34 and $65,509.32. These levels are crucial to watch for potential rebounds or further declines. Fibonacci Retracement: The Fibonacci retracement levels indicate that the price is currently testing the 0.618 level at $67,792.93, which is a strong support level. A break below this level could see the price testing lower Fibonacci levels. Bullish Scenario: Entry Point: If the price breaks above $68,200 with significant volume, it could signal a bullish reversal. Target: The immediate target would be $69,536.89, followed by $70,613.39. Stop Loss: Set a stop loss at $67,400 to protect against downside risk. Bearish Scenario: Entry Point: If the price falls below $67,800 with increasing volume, it could trigger a further decline. Target: The initial target would be $66,574.34, with an extended target at $65,509.32. Stop Loss: Set a stop loss at $68,200 to mitigate losses in case of a sudden reversal. Conclusion: Bitcoin's current technical setup suggests potential volatility ahead. Traders should be cautious and watch for critical levels to determine the direction of the next major move. Both bullish and bearish scenarios present viable opportunities, depending on how the price reacts to key support and resistance levels.
AxiomEx
Chainlink Set to Skyrocket: Is $22 Just the Beginning?

The current price of Chainlink is fluctuating between $16.83 and $16.94, showing a significant bullish momentum over the past week with a performance gain of approximately 27.37%. The technical indicators reveal a strong upward trend with the price pushing through key moving averages and maintaining a bullish stance. The RSI is currently at 67.65, suggesting that the asset is approaching overbought territory but is not yet overextended. This indicates room for further price increases before potential corrective actions. The Stochastic %K is also high at 91.29, reinforcing the RSI's stance but cautioning for potential short-term corrections. The CCI is notably high at 214.61, which generally signals an overbought condition and a potential pullback. However, the strong momentum and MACD levels suggest sustained bullish sentiment. The EMA and SMA values across different periods all indicate a buy signal, reinforcing the ongoing bullish trend. Price Targets Immediate Resistance (R1): $17.62 Secondary Resistance (R2): $22.10 Immediate Support (S1): $14.78 Secondary Support (S2): $10.30 Given the current bullish momentum and the indicators' positions, a speculative price target within the next week could be $17.62, aligning with the immediate resistance level. If the bullish momentum continues unabated, a medium-term target could extend towards $22.10. Conversely, if a correction occurs, the price might pull back to the $14.78 support level. Trading Strategy Long Position: Consider entering a long position at current levels ($16.83 - $16.94) with a target price of $17.62. Place a stop loss just below the $14.78 support level to mitigate potential losses. Short Position: If the price fails to break above the $17.62 resistance and shows signs of reversal, a short position could be considered with a target price of $14.78. Place a stop loss slightly above $17.62 to prevent excessive losses in case of a bullish breakout. Conclusion Chainlink exhibits strong bullish momentum supported by favorable technical indicators. Traders should remain vigilant for any signs of reversal near the resistance levels and consider both long and short positions based on price action around these key levels. The overall sentiment remains positive with the potential for further upside gains in the short to medium term.
AxiomEx
Solana's Explosive Surge: Is $236 the Next Stop?

Solana (SOL) has been showing significant bullish momentum, currently trading at $171.51 with a notable increase of 1.23% intraday. The asset's market cap stands at $77.04 billion with a 24-hour trading volume of $2.65 billion. The price action and technical indicators suggest strong bullish trends with potential for further gains. Price Action and Trend Analysis Over the past week, Solana has demonstrated a robust performance with a 17.48% increase. The price has been oscillating within a range of $168.74 to $176.00 in the past day, indicating healthy volatility. The chart patterns reveal higher highs and higher lows, signifying a well-established uptrend. Ichimoku Cloud Analysis The Ichimoku Cloud indicates a bullish sentiment as the price is above the Kumo (cloud), with a significant distance from the baseline (Kijun-sen) at $147.40. The Leading Span A and B also indicate support levels are well below the current price, providing a strong safety net for bullish positions. Price Targets and Trade Strategy Given the current technical setup, the immediate price target for Solana is $181.68 (R1). Should the bullish momentum continue, the secondary target extends to $236.63 (R2). Long Position: Entry Point: Enter a long position at the current price level around $171.51. Stop Loss: Set a stop loss slightly below the 50-day EMA at $150.00 to minimize downside risk. Take Profit: Aim for the first resistance level at $181.68 and extend to $236.63 for a more aggressive target. Short Position: Entry Point: Consider shorting if the price drops below the pivot point at $149.33. Stop Loss: Place a stop loss at $155.00. Take Profit: Target $94.38 (S1) for a conservative approach. Solana exhibits strong bullish tendencies with solid support from technical indicators and moving averages. The current trend suggests potential for further upside, making it an attractive candidate for long positions. However, traders should remain vigilant and use tight stop losses to manage risk, especially if the price approaches key resistance levels. As always, continuous monitoring of market conditions and news is essential to adjust strategies accordingly.
AxiomEx
Technical Analysis: Robinhood Markets, Inc. (HOOD)
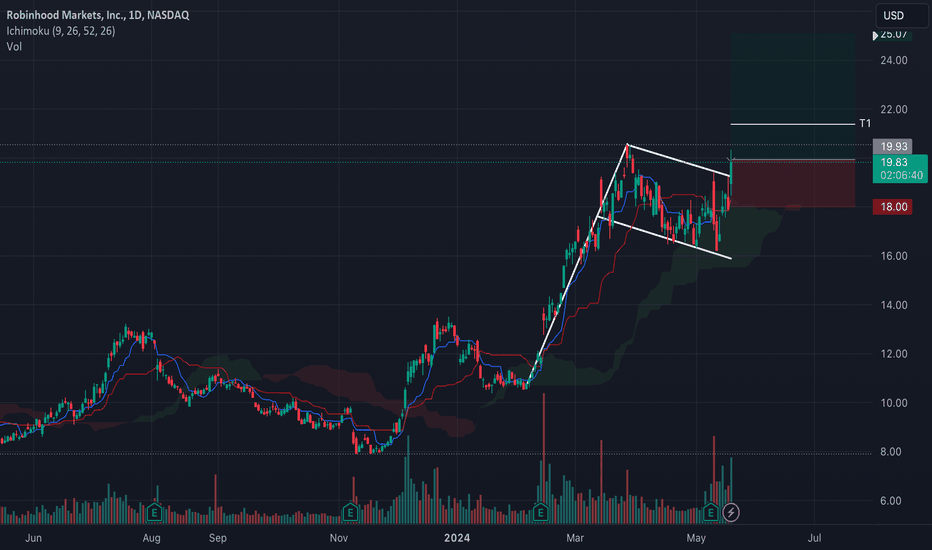
Robinhood Markets, Inc. (HOOD) is currently trading at $19.95, up 11.45% from the previous close. This significant movement indicates strong bullish momentum. Below is an in-depth technical analysis to provide actionable insights. Oscillators Relative Strength Index (RSI): At 63.31, the RSI is in the neutral zone but approaching the overbought territory. A further move towards 70 could indicate overbought conditions, suggesting a potential reversal or consolidation. Stochastic %K: With a value of 70.79, it also signals neutral, but close to overbought levels. This corroborates the RSI, hinting at potential overbought conditions soon. Commodity Channel Index (CCI): At 254.93, the CCI is significantly above 100, indicating strong buying pressure and a potential overbought condition. MACD Level (12, 26): Positive at 0.24 with a 'Buy' signal, suggesting bullish momentum is still strong. Moving Averages All key moving averages, including the 10-day, 20-day, 50-day, 100-day, and 200-day SMAs and EMAs, indicate a 'Buy' signal. The price is currently above these averages, reinforcing the bullish outlook. EMA (10): 18.06 (Buy) SMA (20): 17.58 (Buy) EMA (50): 17.20 (Buy) SMA (200): 12.68 (Buy) Pivots Pivot Point (P): 17.70 Support Levels: S1 at 15.25, S2 at 14.01 Resistance Levels: R1 at 18.94, R2 at 21.39 Valuation Ratios Price to Sales Ratio: 6.56, relatively high, indicating the market expects high future growth. Price to Cash Flow Ratio: 14.33, suggesting the stock is somewhat overvalued based on current cash flows. Profitability Ratios Return on Assets (ROA): -5.85%, indicating inefficiency in asset utilization. Return on Equity (ROE): -17.93%, reflecting negative returns on shareholder equity. Chart Patterns and Price Action The latest candlestick shows a breakout above the upper resistance line of a consolidation pattern, indicating a continuation of the upward trend. The volume spike supports this breakout, suggesting strong buyer interest. Speculative Price Targets Short Term (1-2 weeks): The immediate target is $21.39, aligning with the R2 resistance level. If bullish momentum continues, this target could be reached. Medium Term (1-2 months): The next significant target is $25.08 (R3), contingent on sustained bullish sentiment and favorable market conditions. Trading Strategy Long Position: Enter at the current price level ($19.95). Set a stop loss at $18.00 to mitigate downside risk. Target price: $21.39 (short term), $25.08 (medium term). Short Position: Consider shorting if the price fails to hold above $18.00, with a stop loss at $20.00. Target price: $15.25 (S1), aligning with the first support level. Conclusion Based on the technical indicators, moving averages, and overall market sentiment, Robinhood Markets, Inc. shows strong bullish potential in the short to medium term. However, traders should monitor for any signs of overbought conditions and be prepared to adjust their positions accordingly.
Disclaimer
Any content and materials included in Sahmeto's website and official communication channels are a compilation of personal opinions and analyses and are not binding. They do not constitute any recommendation for buying, selling, entering or exiting the stock market and cryptocurrency market. Also, all news and analyses included in the website and channels are merely republished information from official and unofficial domestic and foreign sources, and it is obvious that users of the said content are responsible for following up and ensuring the authenticity and accuracy of the materials. Therefore, while disclaiming responsibility, it is declared that the responsibility for any decision-making, action, and potential profit and loss in the capital market and cryptocurrency market lies with the trader.