
AtresCryptoAcademy
@t_AtresCryptoAcademy

What symbols does the trader recommend buying?
Purchase History
پیام های تریدر
Filter
AtresCryptoAcademy
BTCUSDT Weekly Chart Analysis | Bullish V-Pattern Breakout ?

BTCUSDT Weekly Chart Analysis | Bullish V-Pattern Breakout Possible 🔍 Let’s dive into the Bitcoin/USDT weekly setup and map out the current momentum, focusing on a key bullish scenario as price nears decisive levels. ⏳ Weekly Overview Bitcoin is trading near $119,427, just below a major resistance zone at $119,430. A confirmed weekly close above this level, accompanied by sustained volume, would activate a textbook bullish V-pattern breakout. The V bottom structure is recognized for its aggressive buying pressure — price first sharply reverses from the support zone, then rallies as bulls take control, validated by both price and volume signals. 🔺 Long Setup: A strong volume-backed weekly close above $119,430 unlocks a 10% move at RR1, projecting further upside toward the next reachable target at $130,000, which acts as a Potential Reversal Zone (PRZ). The setup relies on clean confirmation: breakout, high volume on the weekly, and consolidation above resistance for sustained momentum. 📊 Key Highlights: - Weekly V-pattern maturation can drive a strong bullish leg if confirmed above $119,430. - Volume confirmation is vital: look for above-average weekly bars to validate breakout strength. - Target zone sits at $130k, an area with clustering past liquidity and technical importance (PRZ). - If the breakout stalls or is rejected, expect price to retest lower bands; first support now sits at $113,000–115,000. 🚨 Conclusion: A bullish scenario is building, hinging on a weekly close with volume above $119,430. Such confirmation would validate a breakout from the V-pattern and set sights on $130k, where trend participants may look to realize or reassess positioning. Failure at this level could reload bids at key lower supports. Stay sharp for volume cues and structural follow-through.
AtresCryptoAcademy
HBARUSDT 1H Chart Analysis | Bullish Structure in Play
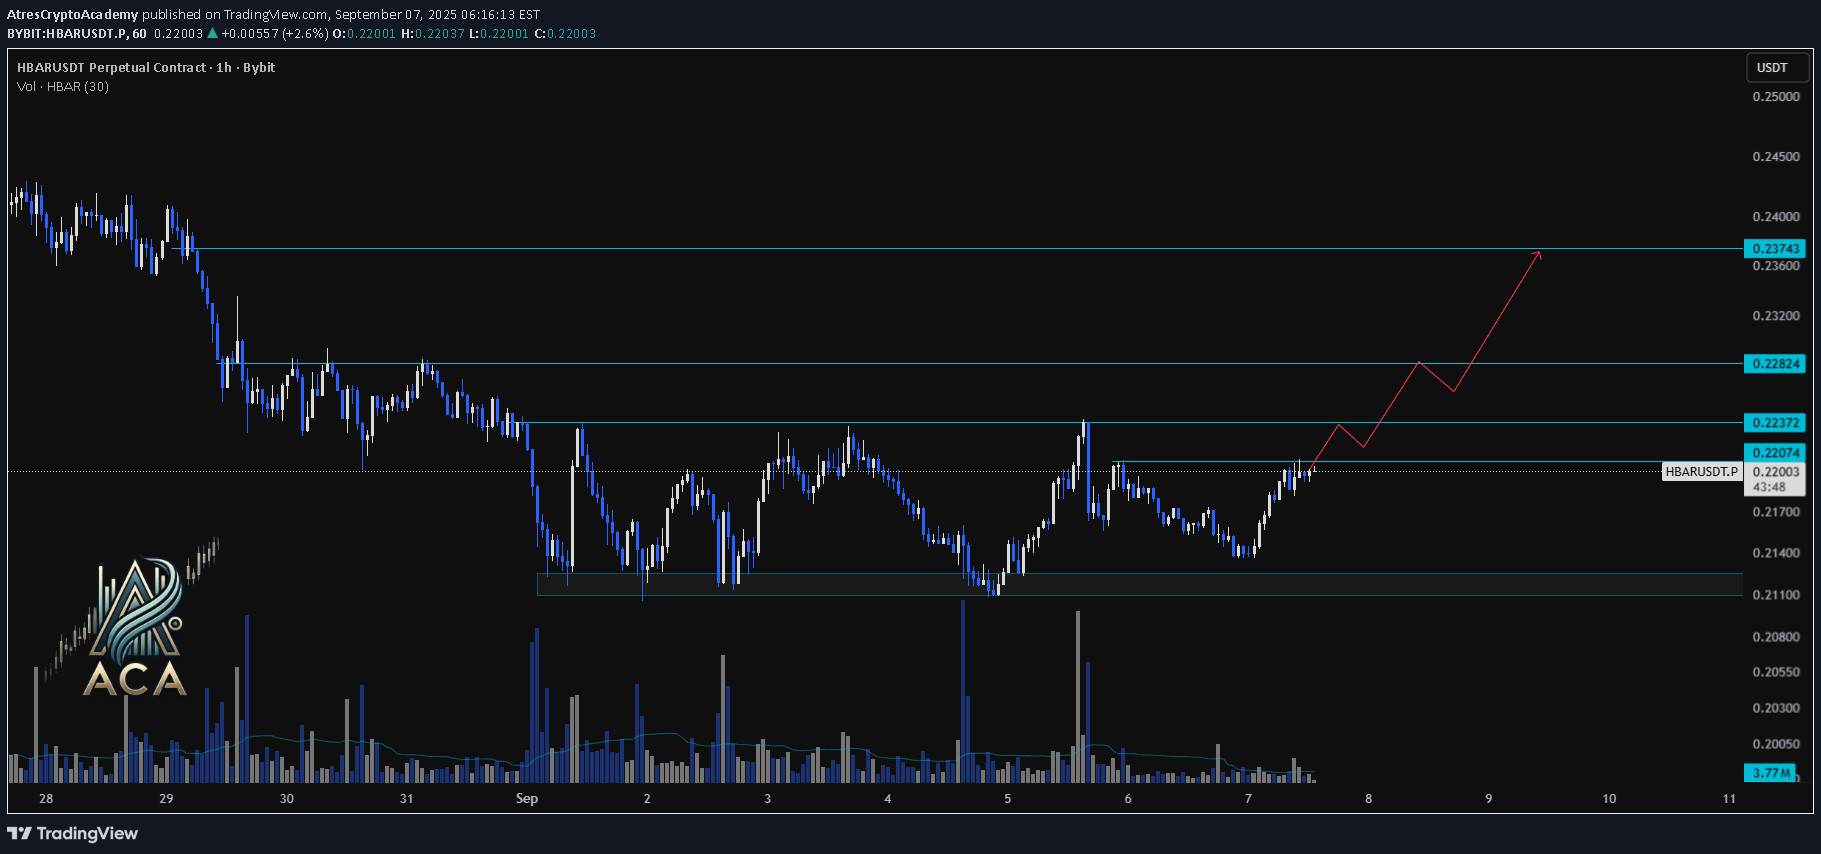
HBARUSDT 1H Chart Analysis | Bullish Structure in Play 🔍 Let’s break down the recent price action for the HBAR/USDT perpetual contract and outline the roadmap for potential bullish continuation. ⏳ 1-Hour Overview The 1-hour chart shows HBAR recovering from a strong demand zone near $0.21100, pushing upward with notable momentum. Price action is now challenging immediate resistance at $0.22372, with higher levels at $0.22824 and $0.23743 presenting the next bullish targets. 🔺 Long Setup: A decisive close and hold above $0.22372 could fuel further upside, targeting the $0.22824 resistance next. Sustained bullish volume and higher lows may pave the way for an extension up to $0.23743, aligning with the drawn projection path. 📊 Key Highlights: - Strong defense of the $0.21100 support region led to a sharp rebound. - Immediate resistance stands at $0.22372, with the bullish path mapped toward $0.22824 and $0.23743. - Volume spikes on upward candles indicate increasing buyer interest and potential for trend follow-through. 🚨 Conclusion: HBARUSDT is building a bullish structure above local support, with momentum favoring continued upside if $0.22372 flips into support. Watching volume and reaction at key resistance areas remains crucial for confirming the next leg higher.
AtresCryptoAcademy
SUSDT 4H Chart Analysis | Channel Breakdown Looms

SUSDT 4H Chart Analysis | Channel Breakdown Looms 🔍 Let’s break down the recent price action on the S/USDT 4-hour chart, focusing on the pivotal ascending channel structure and its implications for the next move. ⏳ 4-Hour Overview S/USDT has been moving within a well-defined ascending channel, marked by higher highs and higher lows. Price is now testing the lower boundary of this channel, making the 0.3127 support a crucial level. The recent uptick in volume during the downward leg hints at mounting bearish pressure. 🔻 Short Setup: A confirmed breakdown (BO) below 0.3127 would signal an exit from the ascending channel, opening the door to accelerated downside. With channel support breached, the next key target sits at 0.2710, in line with historical liquidity and the channel’s projected lower range. 📊 Key Highlights: - Price action is currently at the channel’s lower boundary, with a breakdown below 0.3127 required to confirm bearish momentum. - Volume has increased on the recent downward move, supporting the idea of a channel exit and follow-through selling. - Downside target stands at 0.2710 if the channel fails, providing a clear roadmap for action. 🚨 Conclusion: Bulls must defend the ascending channel at 0.3127, or risk seeing S/USDT cascade toward 0.2710. Watch for volume confirmation—an exit below channel support could shift sentiment quickly.
AtresCryptoAcademy
ATOMUSDT 4H Chart Analysis | Momentum Breakout in Play

ATOMUSDT 4H Chart Analysis | Momentum Breakout in Play 🔍 Let’s dive into the ATOM/USDT perpetual contract and analyze the latest price action, outlining key bullish setups and momentum signals. ⏳ 4-Hour Overview The 4-hour chart reveals a strong bullish push, with price surging above the trendline resistance and reclaiming the local $4.917 zone. Volume has notably increased, confirming the move’s strength. Meanwhile, the RSI indicator is closing above 70, marking the overbought territory and highlighting a surge in buyer momentum. 🔺 Long Setup: On the upside, sustained momentum could ignite a rally toward $5.262 first, with a further target at $5.640 should follow-through buying persist. These levels line up with previous resistance zones and potential trend-based extensions. 📊 Key Highlights: - 4H breakout confirms bullish bias and momentum shift. - Volume spike adds conviction to the move. - RSI closing above 70 signals strong momentum; a continuation could bring further upside. - Short-term resistance targets are $5.262 and $5.640. - “Closing above 70 in 4h brings momentum” — if sustained, might hint at a new trend leg. 🚨 Conclusion: ATOM/USDT is showcasing renewed bullish momentum. Watch for confirmations above resistance and be mindful of short-term exhaustion signals in the overbought zone. If momentum holds, upside targets at $5.262 and $5.640 are in play.
AtresCryptoAcademy
ZECUSDT Daily Chart Analysis | Symmetrical Triangle BO Watch

ZECUSDT Daily Chart Analysis | Symmetrical Triangle Breakout Watch 🔍 Let’s dissect the ZEC/USDT daily chart, where price action is nearing a pivotal breakout from a symmetrical triangle—often a precursor to major moves when combined with rising volume. ⏳ Daily Chart Overview Zcash has been consolidating over recent weeks, forming a clear symmetrical triangle pattern bounded by converging trendlines. This pattern, characterized by lower highs and higher lows, signals that volatility is being compressed and a decisive breakout may be imminent. 🔺 Long Setup: A daily close above the $45.50 resistance, especially with strong volume, will act as a “safe trigger” and confirm breakout validity. If bulls take charge here, the next upside objectives are $55.00 followed by $73.55. Watch for volume confirmation, ideally on a 4H candle close above resistance, to further add confidence to the breakout. 📊 Key Highlights: - Symmetrical triangle pattern shows growing pressure for a directional move. - Recent price tested triangle resistance; a close above $45.50 is the bullish trigger. - Upside targets post-breakout are $55.00 and $73.55, provided volume supports the move. - Volume spike serves as crucial confirmation—don’t chase without it. 🚨 Conclusion: ZEC is coiling within a symmetrical triangle, setting the stage for potential breakout action. Bulls are watching $45.50 for a clean breakout trigger, eyeing $55 and $73.55 as next targets. Always wait for strong volume and confirmed closes before acting—symmetrical triangles can break both ways if conviction is lacking.
AtresCryptoAcademy
CTCUSDT 1D Chart Analysis | Ascending Momentum Targets Major BO

CTCUSDT 1D Chart Analysis | Ascending Momentum Targets Major Breakout 🔍 Let’s break down CTC/USDT spot price action and map out the upward scenario as bullish momentum gains traction, with a focus on trendline support, volume dynamics, and key resistance levels. ⏳ 1-Day Overview CTC/USDT on the daily chart is carving out an ascending triangle formation, supported by a firm rising yellow trendline. Price is pressing against key horizontal resistance at $0.7950 as trading volume builds, hinting at buying interest ahead of a breakout move. 📈 Volume & Structure Insights - Steady volume expansion as price approaches the apex, confirming accumulation and bullish intent. - Strong base forming above the yellow ascending trendline, which has consistently held since April. - Immediate upside resistance stands at $0.7950; higher levels to target are $1.1511 and $1.4411 on a convincing breakout. 📊 Key Highlights: - Technical structure: Clear ascending triangle signals bullish continuation if resistance cracks. - Volume spike: Increasing volume supports the validity of the upward move. - Breakout scenario: If price closes above $0.7950, expect momentum to carry toward $1.1511 (next resistance), followed by $1.4411. - Price projection: Short-term retests are likely (see mapped path), but trend bias favors upside as long as the rising support holds. 🚨 Conclusion: CTC/USDT is poised for a breakout, with momentum and volume aligning for an upward move. Watch for a daily close above $0.7950 as the trigger—targets are $1.1511 and $1.4411. Volume acceleration and bullish structure reinforce the setup. Stay alert for invalidation if the ascending trendline fails to hold.
AtresCryptoAcademy
TRXUSDT 1H Chart Analysis | Eyeing the Breakout for Momentum
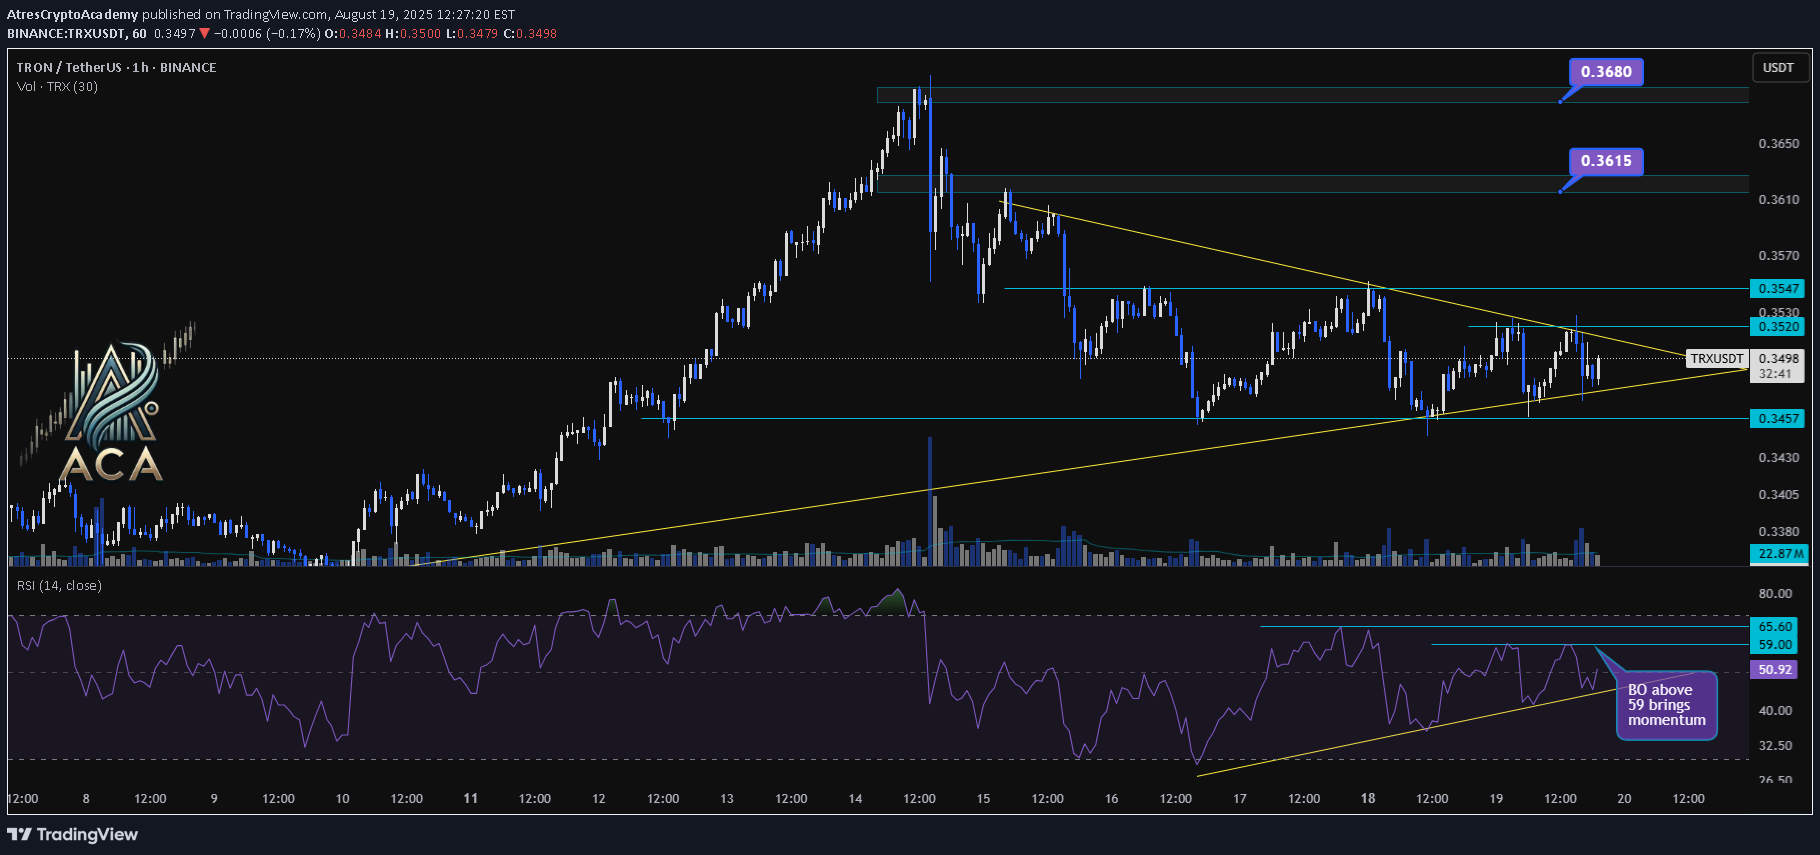
TRXUSDT 1H Chart Analysis | Eyeing the Breakout for Momentum 🔍 Let’s break down TRX/USDT price action and identify setups that could unlock the next move, with a spotlight on RSI dynamics and key breakout levels. ⏳ 1-Hour Overview The chart is currently forming a tightening symmetrical triangle, signaling a squeeze ahead of an expected breakout. Price action is consolidating between the local support at $0.3457 and resistance near $0.3520–$0.3547. 📈 RSI Insights - The RSI sits around 48, reflecting short-term indecision and neutral momentum. - There’s a clear RSI trendline forming higher lows, indicating underlying strength building up. - Watch closely: An RSI breakout above 59 is flagged as a momentum trigger, historically driving stronger moves. 📊 Key Highlights: - Chart pattern: Tightening triangle points to an imminent volatility expansion. - Price structure: Breakout (BO) above $0.3520 or, more convincingly, $0.3547 opens up higher targets. - Bullish targets: $0.3615 and $0.3680—these mark the next resistance zones if upside momentum takes over. - RSI dynamics: Trendline support on RSI signals hidden demand; BO above 59 on RSI can fuel upside moves. 🚨 Conclusion: TRX is at a make-or-break juncture. A decisive breakout above $0.3520 or, even better, $0.3547 could unlock a rally to $0.3615 and $0.3680. Keep a close eye on the RSI—trendline holds and a thrust above 59 can serve as early confirmation of buyer strength.
AtresCryptoAcademy
ARBUSDT 4H Chart Analysis | Trendline Integrity & Key Targets

ARBUSDT 4H Chart Analysis | Trendline Integrity, Volume, Divergence & Key Targets 🔍 Let’s break down ARBUSDT on the 4-hour chart, spotlighting trend structure, swing plays, volume signatures, and momentum for precise trading setups. ⏳ 4H Overview The chart shows ARBUSDT maintaining a solid uptrend, respecting its ascending trendline while consistently printing higher highs (HH) and higher lows (HL). This structure underscores ongoing bullish conviction. Price action recently staged a strong bounce off the trendline with marked bullish divergence on RSI, and volume confirmation adds muscle to the move. 🔺 Key Bullish Setup: - Trendline Continuation: Price respects and bounces off a well-defined yellow trendline, reinforcing the uptrend’s technical foundation and providing a dynamic support reference for traders. - Swings (HH, HL, SL): The chart highlights multiple Higher Highs (HH) and Higher Lows (HL), validating persistent bullish order flow. A prior same low (SL) remains untouched, further cementing trend integrity. - Volume Confirmation: Noticeable upticks in volume during upward impulses and corrections confirm genuine momentum and institutional participation. Recent volume surges during corrections point to accumulation. - RSI & Bullish Divergence: The RSI (14) is currently at 60.51, below typical overbought territory and leaving room for more upside. Significantly, the latest HL forms alongside a bullish RSI divergence—price makes higher lows as RSI also rises—implying underlying buying strength and likely trend continuation. - New Overbought OB Level: A fresh OB is marked at ~82.40 on the RSI, establishing a clear ceiling should bullish momentum accelerate. - Resistance & Targets: Key resistance is at 0.5712 — price testing or breaking this level is pivotal. Above, technical targets are projected at 0.7175 and 0.9525, aligning with previous structural pivots and projected breakout extensions. 📊 Supporting Details: - Trendline & Swings: The consistent pattern of HLs, HHs, and untouched SL demonstrates primary bullish control. - Volume: Surging volumes during impulse moves and corrections confirm that buyers are driving rallies while also absorbing dips. - RSI Bullish Divergence: Underlines demand emergence at each corrective phase. - Order Book Dynamic: Price above 0.5712 faces thinner resistance, offering room for a rapid move toward the upper targets. 🚨 Conclusion: With trendline support holding, recurring bullish swing patterns, strong volume on breakouts and corrections, and RSI confirming hidden buying pressure, ARBUSDT is positioned for bullish continuation. Watch for confirmed closes above 0.5712; upside expansions to 0.7175 and 0.9525 are highly probable if volume inflow and RSI momentum persist. The defined new RSI OB at 82.40 helps monitor overextension risk. Stay alert for any trendline or HL breakdowns, but as long as this structure holds with supporting volume and momentum, the bias remains positive. Watch resistance reactions and momentum signals to ride the next wave.
AtresCryptoAcademy
MNTUSDT Weekly Chart Analysis | Momentum & Key Targets Unveiled

MNTUSDT Weekly Chart Analysis | Momentum & Key Targets Unveiled 🔍 Let’s dive into MNTUSDT perpetual contracts and decode the current price action, focusing on order flow, volume, liquidations, and momentum for top trading setups. ⏳ Weekly Overview The weekly chart shows MNTUSDT surging out of a prolonged consolidation box, supported by a massive volume spike. This breakout is adding significant bullish momentum, as the RSI closes above the 71.55 level — a classic signal for trend acceleration and institutional interest. 🔺 Key Bullish Setup: - Consolidation Box Break: Closing above the $1.57 level marks a safe entry; the order book above is lighter, giving price more freedom to move. - Short Liquidation Cluster: Between $1.40-$1.60, nearly 471,300 MNT shorts are set for liquidation. Once price pushes through, liquidity fuel could trigger rapid upside. - Upside Targets: Next objectives are $2.90 (approx. 90% up) and $4.25 (approx. 180% from the breakout), perfectly aligning with RR1 projections out of consolidation. - Volume & Momentum: A massive volume influx supports the move, and RSI bolting past 71.55 on weeklies brings undeniable momentum. 📊 Order Flow & Futures Netflow: - CoinGlass Futures Netflow: Recent statistics point to a healthy net inflow for MNT after a period of outflows, reflecting renewed market interest and capital rotation into longs. - Market Cap: $4.50B, cementing its presence among high-liquidity altcoins. 🚨 Conclusion: Breaking the current consolidation box, backed by a huge volume spike and overbought weekly RSI, signals powerful momentum. The $1.57 level offers a low-risk entry, and clearing short liquidation pockets between $1.40-$1.60 could send MNT to $2.90 and $4.25 in quick succession. Order book dynamics favor further upside, especially as resistance thins above $1.57. Stay sharp, watch volume and RSI, and monitor liquidations for confirmation of the bullish continuation.
AtresCryptoAcademy
ETHUSDT 1D Chart Update | Channel Structure, Economic Events

ETHUSDT 1D Chart Update | Channel Structure, Economic Events & ATH in Focus 🔍 Here’s the latest breakdown of ETH/USDT price action on the daily chart—channel dynamics, correction levels, and upcoming catalysts. ⏳ Daily Overview Ethereum is trending strongly within an ascending channel, respecting both mid-level and upper resistance. After a local correction, price is rebounding with sturdy volume participation—signaling renewed interest from buyers. 📉 Correction Levels & Volume - Recent correction found support at the $3,913 zone, with the $4,180 mark now acting as next key level. - Volume has picked up on bullish candles, confirming the strength of this bounce. - Correction appears healthy: price stayed within the channel, higher lows maintained. 📊 Channel, Economic Events & Breakout Setup - ETH continues trading inside the established channel, posting higher highs and higher lows. - Two major US economic events ahead—Unemployment Claims releases on Aug 21 and Aug 28, 2025—that could trigger volatility. - Watch for a breakout (BO) above $4,809: crossing this sets the stage for a new all-time high (ATH). 🎯 Key Levels & Scenario - $3,913: Correction support zone; ideal spot for high RR (risk/reward) long entries if retested. - $4,180: Immediate resistance; flipping this could attract trend-following bulls. - $4,809: Channel top and major breakout threshold. If price closes above, expect acceleration toward new ATH territory. 🚨 Conclusion: ETH is pushing firmly inside its channel, with correction and volume patterns favoring bullish continuation. Key economic events may provide the volatility needed for a breakout move. Above $4,809, watch for new ATHs; dips to $3,913–$4,180 offer attractive re-entry zones for aggressive traders. Stay adaptive as August catalysts unfold.
Disclaimer
Any content and materials included in Sahmeto's website and official communication channels are a compilation of personal opinions and analyses and are not binding. They do not constitute any recommendation for buying, selling, entering or exiting the stock market and cryptocurrency market. Also, all news and analyses included in the website and channels are merely republished information from official and unofficial domestic and foreign sources, and it is obvious that users of the said content are responsible for following up and ensuring the authenticity and accuracy of the materials. Therefore, while disclaiming responsibility, it is declared that the responsibility for any decision-making, action, and potential profit and loss in the capital market and cryptocurrency market lies with the trader.