Technical analysis by AtresCryptoAcademy about Symbol TRX: Buy recommendation (8/19/2025)

AtresCryptoAcademy
TRXUSDT 1H Chart Analysis | Eyeing the Breakout for Momentum
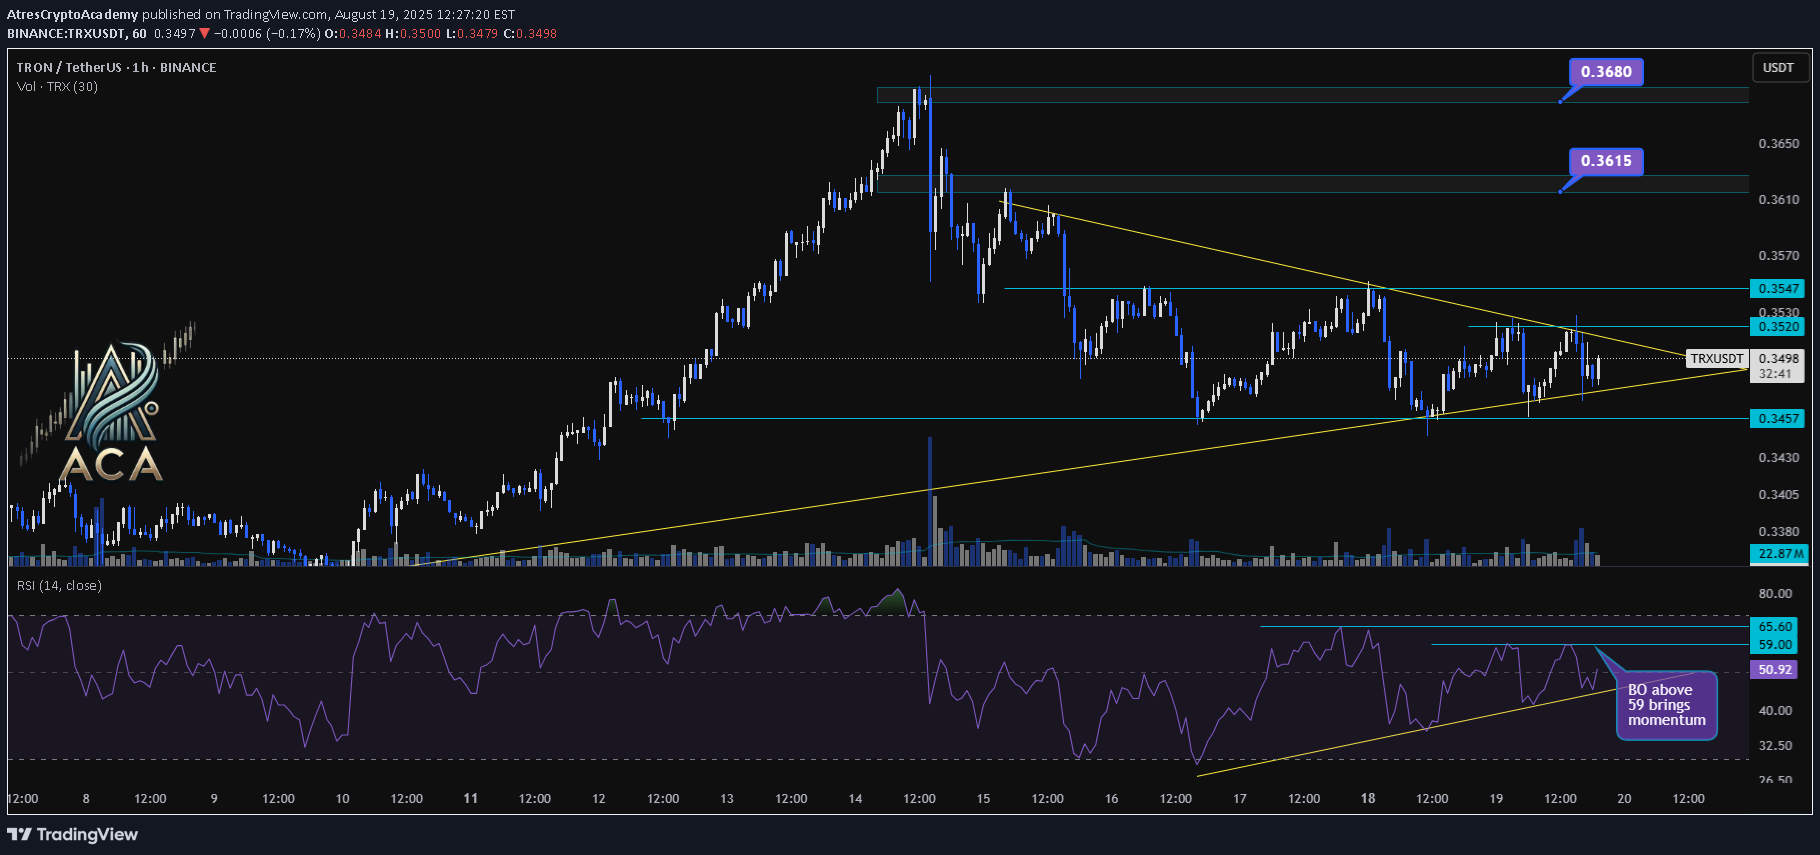
TRXUSDT 1H Chart Analysis | Eyeing the Breakout for Momentum 🔍 Let’s break down TRX/USDT price action and identify setups that could unlock the next move, with a spotlight on RSI dynamics and key breakout levels. ⏳ 1-Hour Overview The chart is currently forming a tightening symmetrical triangle, signaling a squeeze ahead of an expected breakout. Price action is consolidating between the local support at $0.3457 and resistance near $0.3520–$0.3547. 📈 RSI Insights - The RSI sits around 48, reflecting short-term indecision and neutral momentum. - There’s a clear RSI trendline forming higher lows, indicating underlying strength building up. - Watch closely: An RSI breakout above 59 is flagged as a momentum trigger, historically driving stronger moves. 📊 Key Highlights: - Chart pattern: Tightening triangle points to an imminent volatility expansion. - Price structure: Breakout (BO) above $0.3520 or, more convincingly, $0.3547 opens up higher targets. - Bullish targets: $0.3615 and $0.3680—these mark the next resistance zones if upside momentum takes over. - RSI dynamics: Trendline support on RSI signals hidden demand; BO above 59 on RSI can fuel upside moves. 🚨 Conclusion: TRX is at a make-or-break juncture. A decisive breakout above $0.3520 or, even better, $0.3547 could unlock a rally to $0.3615 and $0.3680. Keep a close eye on the RSI—trendline holds and a thrust above 59 can serve as early confirmation of buyer strength.