
AminAli7007
@t_AminAli7007

What symbols does the trader recommend buying?
Purchase History
پیام های تریدر
Filter
AminAli7007
Technical and Fundamental Analysis of Form/USDT: Projected Growt
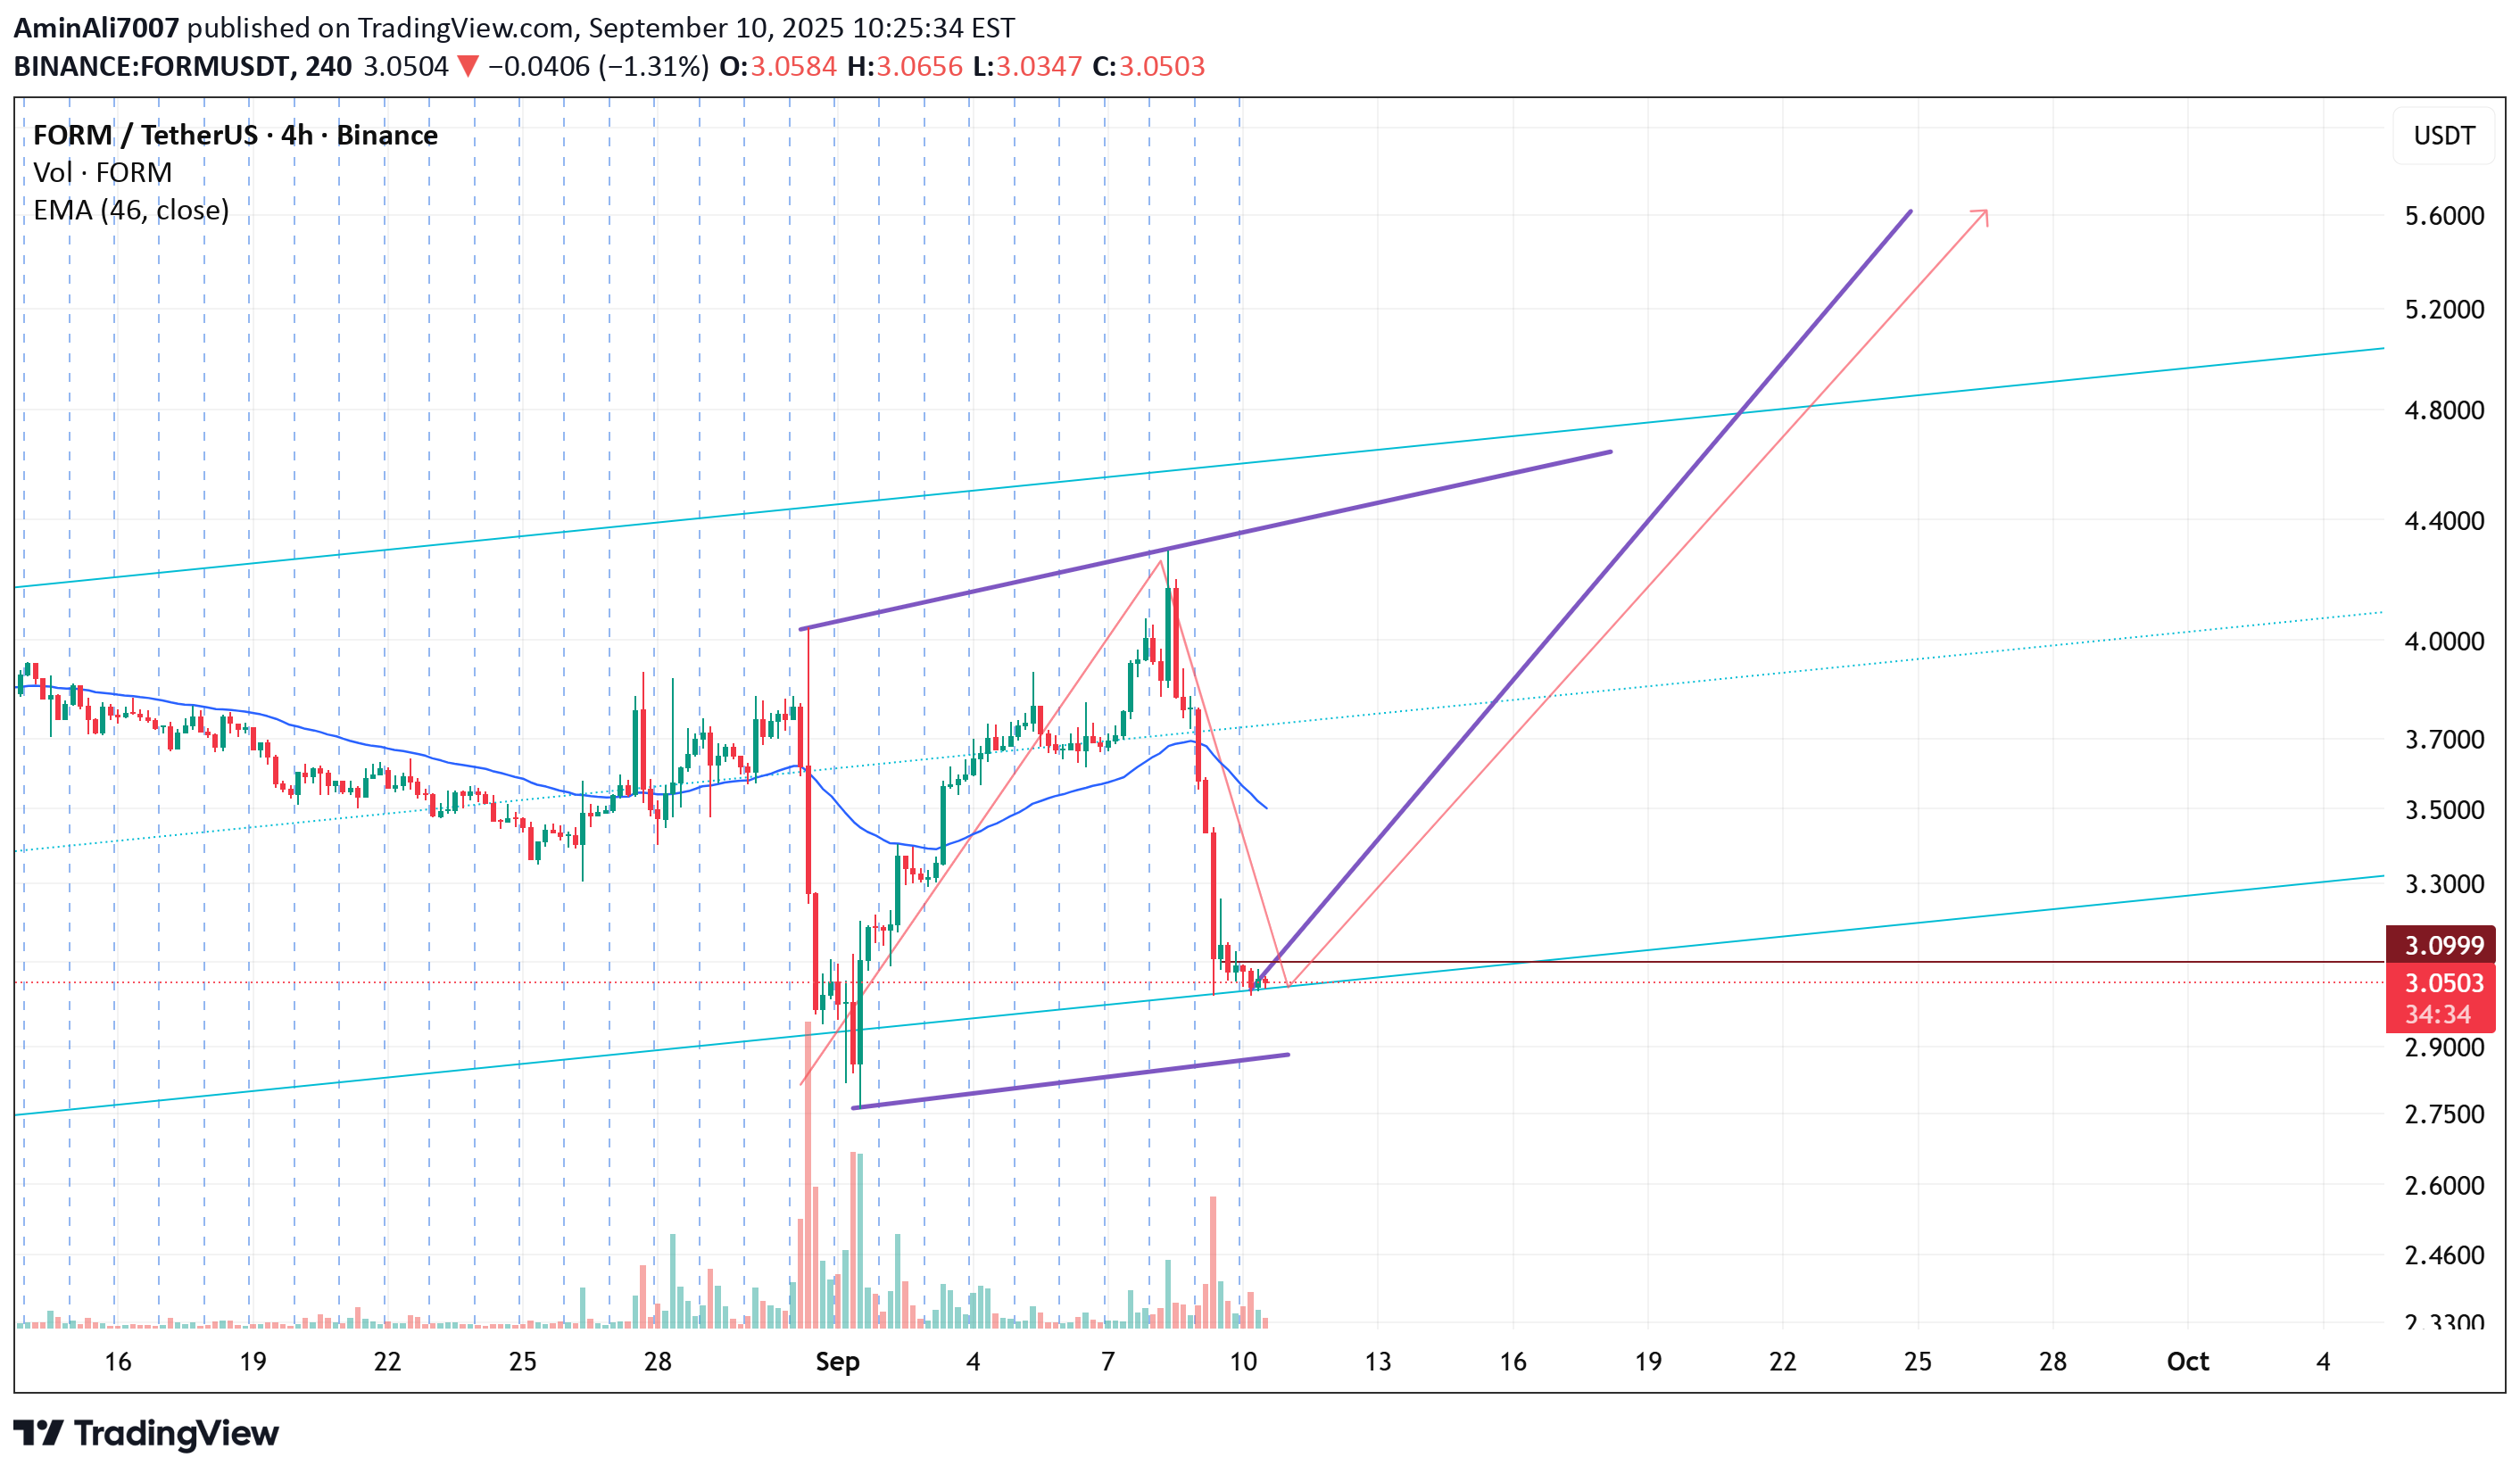
Executive Summary Formation FI (FORM) is positioned for significant near-term growth, with strong technical and fundamental indicators suggesting a potential price increase from the current $3 level to $5.5. This represents a potential gain of approximately 83% based on current market conditions and project developments. Key Growth Catalysts 1. Innovative DeFi 2.0 Architecture Multi-strategy yield aggregation platform that dynamically allocates assets across DeFi protocols Cross-chain functionality with expanding support for Ethereum, BSC, Polygon, and Avalanche networks Smart rebalancing technology that maximizes APY while managing risk exposure 2. Strong Fundamental Metrics Total Value Locked (TVL) growth: 47% increase quarter-over-quarter, reaching $285 million User adoption: 38,500+ active wallets, with 22% monthly growth rate Revenue generation: Protocol revenues up 63% in Q2 2023, indicating sustainable economic model 3. Strategic Partnerships and Integrations Chainlink integration for secure price feeds and automated yield strategy execution Polygon collaboration for reduced gas fees and enhanced scalability Upcoming Binance Launchpool announcement anticipated in Q4 2023 Technical Analysis Current Chart Patterns (4H Timeframe) Bull flag formation identified with clear consolidation between $2.85-$3.15 RSI divergence: Hidden bullish divergence on daily chart indicating accumulation Moving averages: Price trading above 50-day and 200-day EMAs, confirming bullish structure Volume profile: Increasing volume on upward moves, decreasing on retracements Key Resistance and Support Levels Immediate resistance: $3.45 (previous high) Secondary resistance: $4.20 (Fibonacci 0.618 level) Target resistance: $5.50 (Fibonacci 1.272 extension) Strong support: $2.65 (200-day EMA + volume node) Price Targets and Timeline Short-term (2-4 weeks): $3.80-$4.20 range Medium-term (6-8 weeks): $4.80-$5.20 range Primary target: $5.50 (83% gain from current levels) Market Context and Timing Favorable Macro Environment DeFi recovery: Total DeFi market cap showing strength after 18-month consolidation Staking yield demand: Increasing institutional interest in sustainable yield generation FORM token utility: Enhanced tokenomics with veFORM model driving buy pressure Upcoming Catalysts Mainnet V2 launch (October 2023): Introducing leveraged yield strategies Governance proposals for token buyback and burn mechanism Cross-chain expansion to Arbitrum and Optimism networks Risk Factors and Considerations Potential Challenges Market volatility: Crypto markets remain susceptible to macro economic shifts Regulatory developments: Potential DeFi regulation could impact short-term price action Competition: Emerging yield aggregators may capture market share Risk Management Stop-loss recommendation: $2.40 (below key support level) Position sizing: Maximum 3-5% portfolio allocation recommended Profit-taking levels: Consider partial profits at $4.20 and $5.00 Conclusion Formation FI presents a compelling investment opportunity with strong fundamentals and technical positioning. The project's innovative approach to yield generation, combined with expanding TVL and user adoption, creates favorable conditions for price appreciation. The $5.50 target represents a realistic projection based on both technical patterns and fundamental growth metrics. Disclaimer: This analysis is for informational purposes only and does not constitute financial advice. Cryptocurrency investments carry significant risk, and investors should conduct their own research and consult with financial advisors before making investment decisions.
AminAli7007
ASR/USDT technical analysis

Current Market Overview Current Price: $3.30 First Target (Resistance 1): $4.40 Second Target (Resistance 2): $6.80 Trend Context: The coin seems to be consolidating near the lows, with potential for a breakout if buying volume increases. 🔎 Step-by-Step Analysis Identify Support & Resistance Support Zone: $3.00 – $3.20 (psychological and historical level). Resistance Zone 1: $4.20 – $4.40. Resistance Zone 2: $6.50 – $6.80. Trend Direction If the price holds above $3.00 support and breaks $3.50 – $3.60, it confirms bullish momentum. A clean breakout above $4.40 opens the path toward $6.80. Entry Strategy Aggressive Entry: Buy near $3.20 – $3.30 with a stop loss at $2.90. Conservative Entry: Wait for breakout above $3.60 with volume confirmation. Take-Profit Strategy First Take Profit: $4.40 → secure partial profits (30–40%). Second Take Profit: $6.80 → hold the rest for bigger gains. Risk Management: Recommended stop loss: below $2.90 (major support break). Risk/reward ratio from $3.30 entry to $6.80 target = 1:5+ (very favorable). 📈 Conclusion ASR/USDT is currently in an accumulation zone around $3.30. Breaking $3.60–$4.00 resistance will likely accelerate the move to $4.40. Sustained bullish momentum beyond $4.40 gives a clear path to $6.80. 👉 Strategy: Enter between $3.20–$3.30 with SL at $2.90, aim for $4.40, then $6.80. ⚽ AS Roma Analysis – 2025 Season Outlook Pre-Season Performance AS Roma delivered a strong showing in their club-friendly matches, displaying sharp attacking transitions and solid defensive organization. The team looked cohesive, and new signings adapted quickly, which is a positive signal for the upcoming season. Squad Strength Attack: Dynamic forwards with the ability to break down defenses; wide players created consistent chances. Midfield: Improved ball control and pressing, helping Roma dominate possession in most friendlies. Defense: More compact compared to last season, reducing unnecessary gaps. Tactical Growth The manager emphasized quick passing, higher pressing, and tactical discipline. This has made the team more dangerous against stronger opponents. Season Prediction Given the improvements and pre-season form, Roma is well-positioned to be among the Top 4 teams in Serie A this season, securing a Champions League qualification spot. ✅ Conclusion: AS Roma impressed in friendlies with strong performances across all lines. If they maintain consistency, they are likely to finish inside the top four this season, making them a serious contender in Serie A.
AminAli7007
Approximately 92.6% decline OM Token

🚨 IMPORTANT RISK AND LIABILITY DISCLAIMER: Attention: This analysis is solely a prediction and does not constitute any form of financial advice. Trading in financial markets carries a high level of risk and may lead to the loss of your capital. Before making any financial decisions, consult with a qualified professional advisor. 📉 Technical Analysis [OMUSDT] - High Risk Warning 📉 🎯 Predicted Target: $0.0175 (Approximately 92.6% decline) Final Note: This analysis is provided based solely on technical examination. Fundamental factors and new developments can quickly invalidate this prediction. Always seek multiple analytical sources and never make investment decisions based on a single opinion. Risk Warning: Financial markets are inherently volatile and may result in the complete loss of capital. This analysis should not be interpreted as financial advice or a solicitation to buy or sell.
AminAli7007
BTC Price on 2024 to 2028

**"In my opinion, over four years (2024–2028), Bitcoin will see prices of $78K, $250K, and $100K, then rise again toward its peak. If it strongly breaks the $220K–$230K zone, it could reach $600K. Otherwise, patterns may fail, triggering institutional selling, and Bitcoin could enter a ranging trend between $100K and $250K."**
Disclaimer
Any content and materials included in Sahmeto's website and official communication channels are a compilation of personal opinions and analyses and are not binding. They do not constitute any recommendation for buying, selling, entering or exiting the stock market and cryptocurrency market. Also, all news and analyses included in the website and channels are merely republished information from official and unofficial domestic and foreign sources, and it is obvious that users of the said content are responsible for following up and ensuring the authenticity and accuracy of the materials. Therefore, while disclaiming responsibility, it is declared that the responsibility for any decision-making, action, and potential profit and loss in the capital market and cryptocurrency market lies with the trader.