
Adlercon333
@t_Adlercon333

What symbols does the trader recommend buying?
Purchase History
پیام های تریدر
Filter
Signal Type
Adlercon333
In this week’s welcome back video, I’m breaking down my updated approach to XAU/USD and how I plan to tackle the Gold markets in the coming days. After taking a short break, I’m back with fresh eyes and refined focus. We’ll review current market structure, identify key liquidity zones, and outline the scenarios I’m watching for potential entries. Whether you’re day trading or swing trading gold, this breakdown will help you frame your week with clarity and confidence. 📌 Covered in this video: My refreshed trading mindset after a break Key support/resistance and liquidity zones Market structure insights and setup conditions What I’ll personally avoid this week The “trap zones” that might catch retail traders off guard 🧠 Let’s focus on process over profits — welcome back, and let’s get to work.
Adlercon333
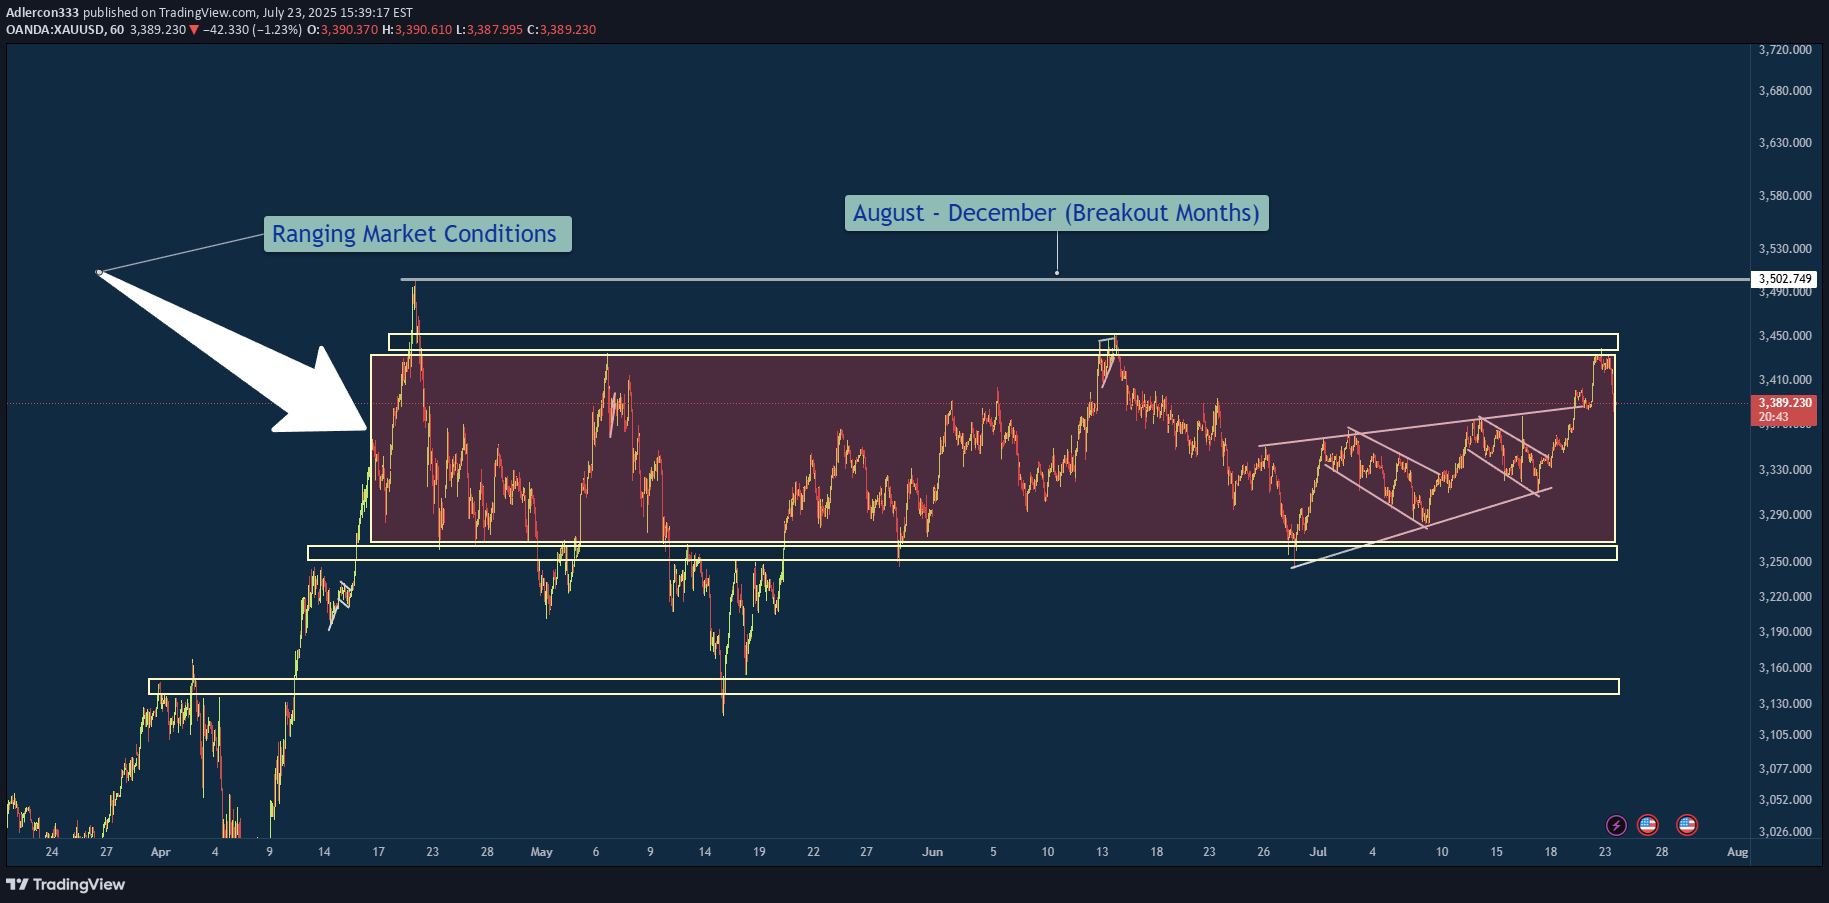
Gold has been ranging for the next couple months and usually I am out of the market during the months of April Through July because historically these are not my best months trading XAU/USD. However you will see me posting a lot more in the coming months because my best months historically are August - December where the market really cranks up with some bigger moves. So in a summarized version below you will find what it is that i am looking at with gold. Gold (XAU/USD) has remained locked in a defined consolidation range between 3,250 (support) and 3,450–3,502 (resistance) since early April. Price has printed multiple internal falling wedge formations within this zone, indicating compression before potential expansion. 🔍 Technical Overview Range Duration: ~3.5 months Key Range: Support: 3,250 Resistance: 3,450–3,502 Compression Patterns: Multiple falling wedges breaking upwards inside the range, hinting at bullish pressure. Touch Confirmations: Both range boundaries have been tested multiple times, reinforcing validity (per Multi-Touch Confirmation). Contextual Bias: Seasonally, August–December tends to be a high-volatility trending period for Gold. 🎯 Trade Plan Inside Range: Maintain neutral bias. Execute range-to-range scalps/swing setups with clear invalidation zones. Avoid trading mid-range. Breakout Scenario (Bullish): A clean close above 3,502 triggers breakout watch. Ideal setup: Retest + 15-min flag → long continuation. Potential upside target: ~3,700 (range height extension). Breakdown Scenario (Bearish): Loss of 3,250 opens door to bearish continuation. Look for clean liquidity sweep or structure flip before committing. Initial downside target: 3,100 zone. 🛡️ Risk Notes Avoid third-touch entries in aggressive momentum unless followed by flag formation. Remain disciplined with the 80/20 confluence rule — don't let perfectionism delay entries. Always execute with pre-trade checklist and defined R:R profile. ✅ Summary Gold is at a pivotal point. The confluence of a tight multi-month range, internal compression patterns, historical breakout timing, and validated levels builds a compelling case for an imminent expansion move. Remain patient, avoid anticipation, and react to confirmed structure and price behavior.
Adlercon333
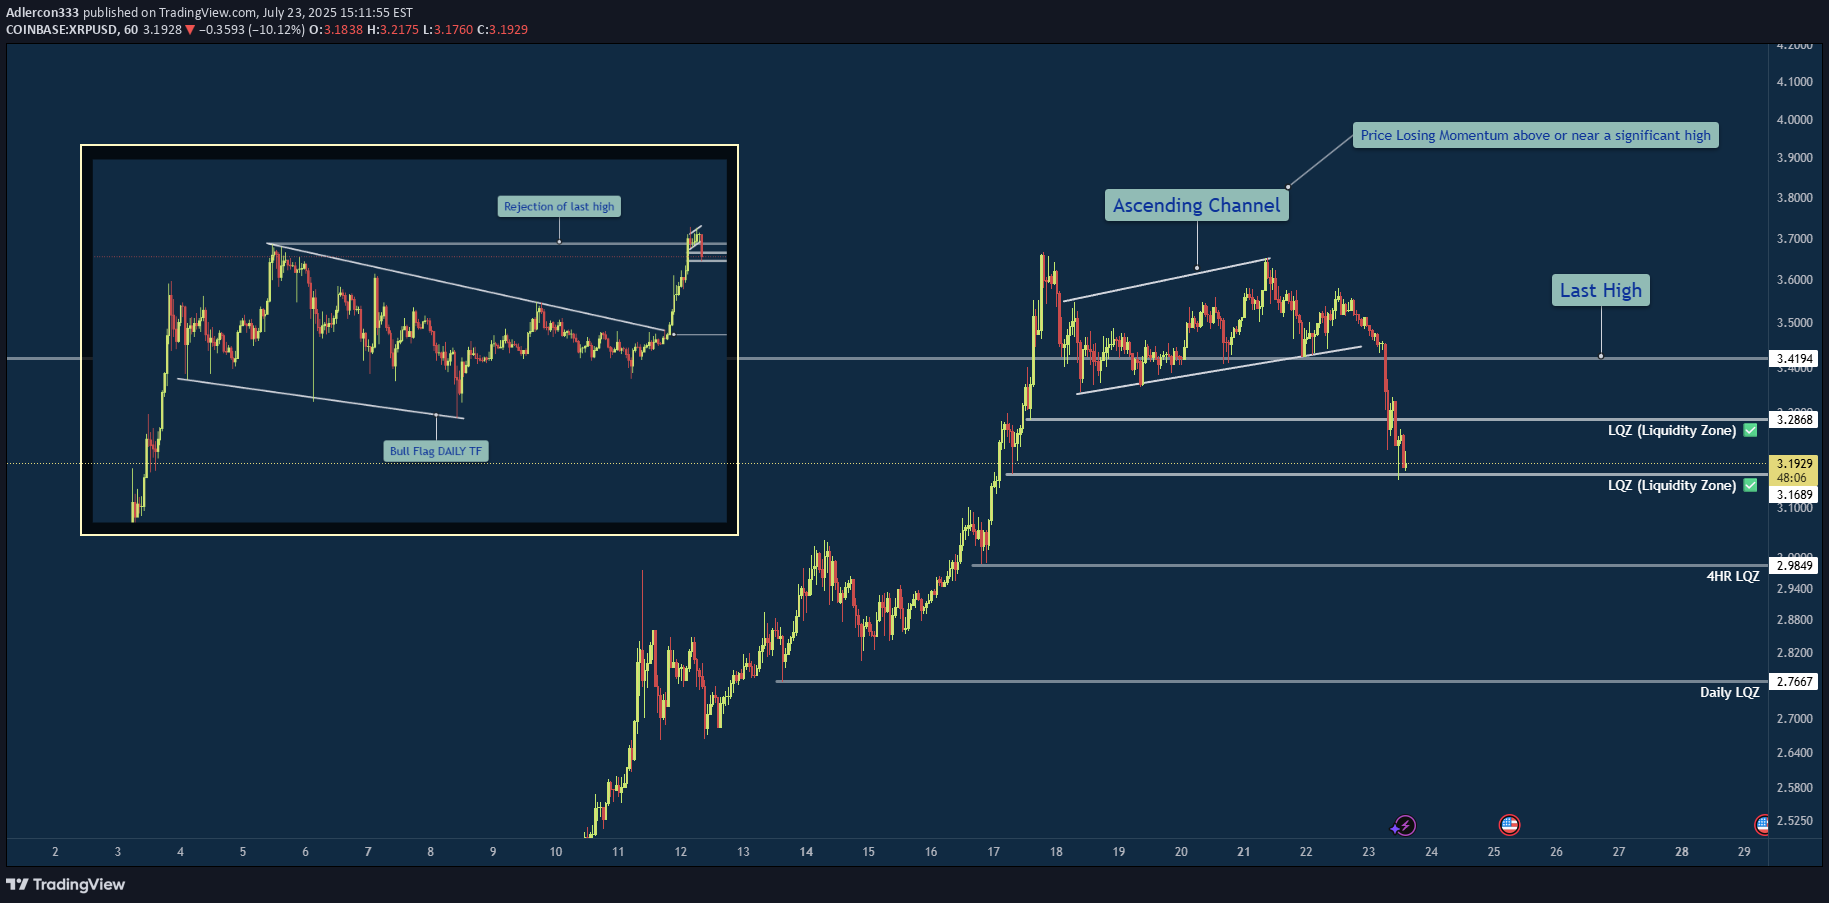
🧠 Summary: XRP/USD has shown clear signs of exhaustion after sweeping the previous high. Following a breakout from a daily bull flag, price struggled to hold momentum near the key level of 3.4194, forming an ascending channel that eventually broke down. Liquidity zones below current price are now in focus. 🔍 Technical Breakdown: ✅ Daily Bull Flag → Broke out with strength ⚠️ Rejection near Previous High (3.4194) → No follow-through 🔼 Ascending Channel → Formed post-impulse, now broken 📉 Momentum Shift → Structure flipped bearish 💧 Liquidity Zones (LQZ) below price acting as magnets 📌 Key Levels: 🔹 Last High: 3.4194 (Rejection Point) 🔹 Broken LQZ: 3.2868 🔹 Current Support: 3.1689 (LQZ - being tested) 🔹 Target 1: 2.9849 (4HR Liquidity Zone) 🔹 Target 2: 2.7667 (Daily Liquidity Zone) 🧩 Confluences: Liquidity sweep of prior high Momentum loss near key resistance Break of ascending structure Retesting broken zones with room below ⚠️ Final Thoughts: This trade is playing out just as we described in the post before this on XRP. We discussed watching how price would react to this area before making any type of "Late Entries". XRP is still a huge and vital part of the Crypto Eco System so long term i am holding my Long position. The areas on the chart are still great areas to buy in at "Dollar Cost Average". This will be one of those positions that though it may be bearish on the lower time frame you need to zoom out and always keep an eye on the weekly and daily chart before making any drastic moves.
Adlercon333
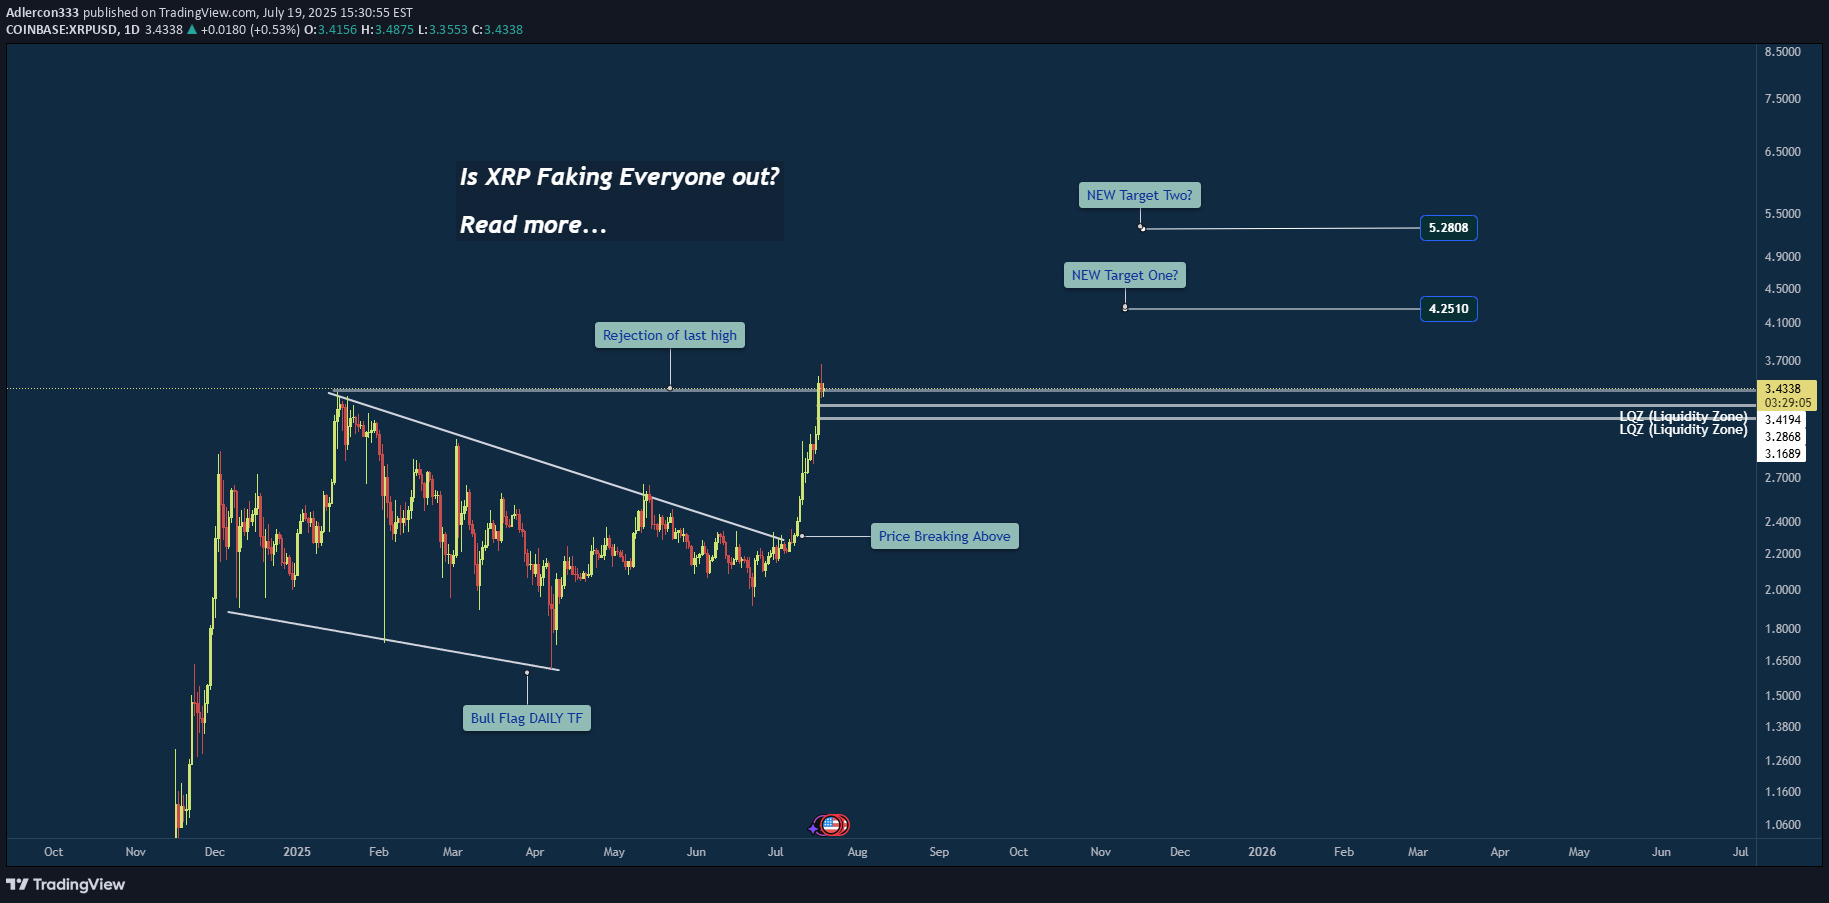
Weekly Chart Insight: XRP Closing Above Previous High XRP has just closed above its previous weekly high—a significant development that could signal a shift in market sentiment. Historically, when price closes above such a critical level on the weekly timeframe, it often leads to continuation, unless a sharp rejection quickly follows. At this stage, the focus shifts to the 4-hour timeframe for confirmation. An impulsive move above the current consolidation zone could indicate that this breakout is legitimate, potentially leading to another bullish weekly candle. However, caution is warranted. If the next two daily candles close weakly or fail to maintain structure above the breakout level, it could hint at a fakeout or liquidity grab before a deeper correction. My Current Bias: I remain neutral-to-bullish, contingent on: An impulsive continuation on the 4HR Strong daily closes above the key range Price not falling back and closing below the weekly breakout level If price begins to consolidate and hold this level, that would reinforce the bullish case. But if we see immediate selling pressure and a re-entrance below the breakout, I’ll reconsider the bias based on developing structure.
Adlercon333
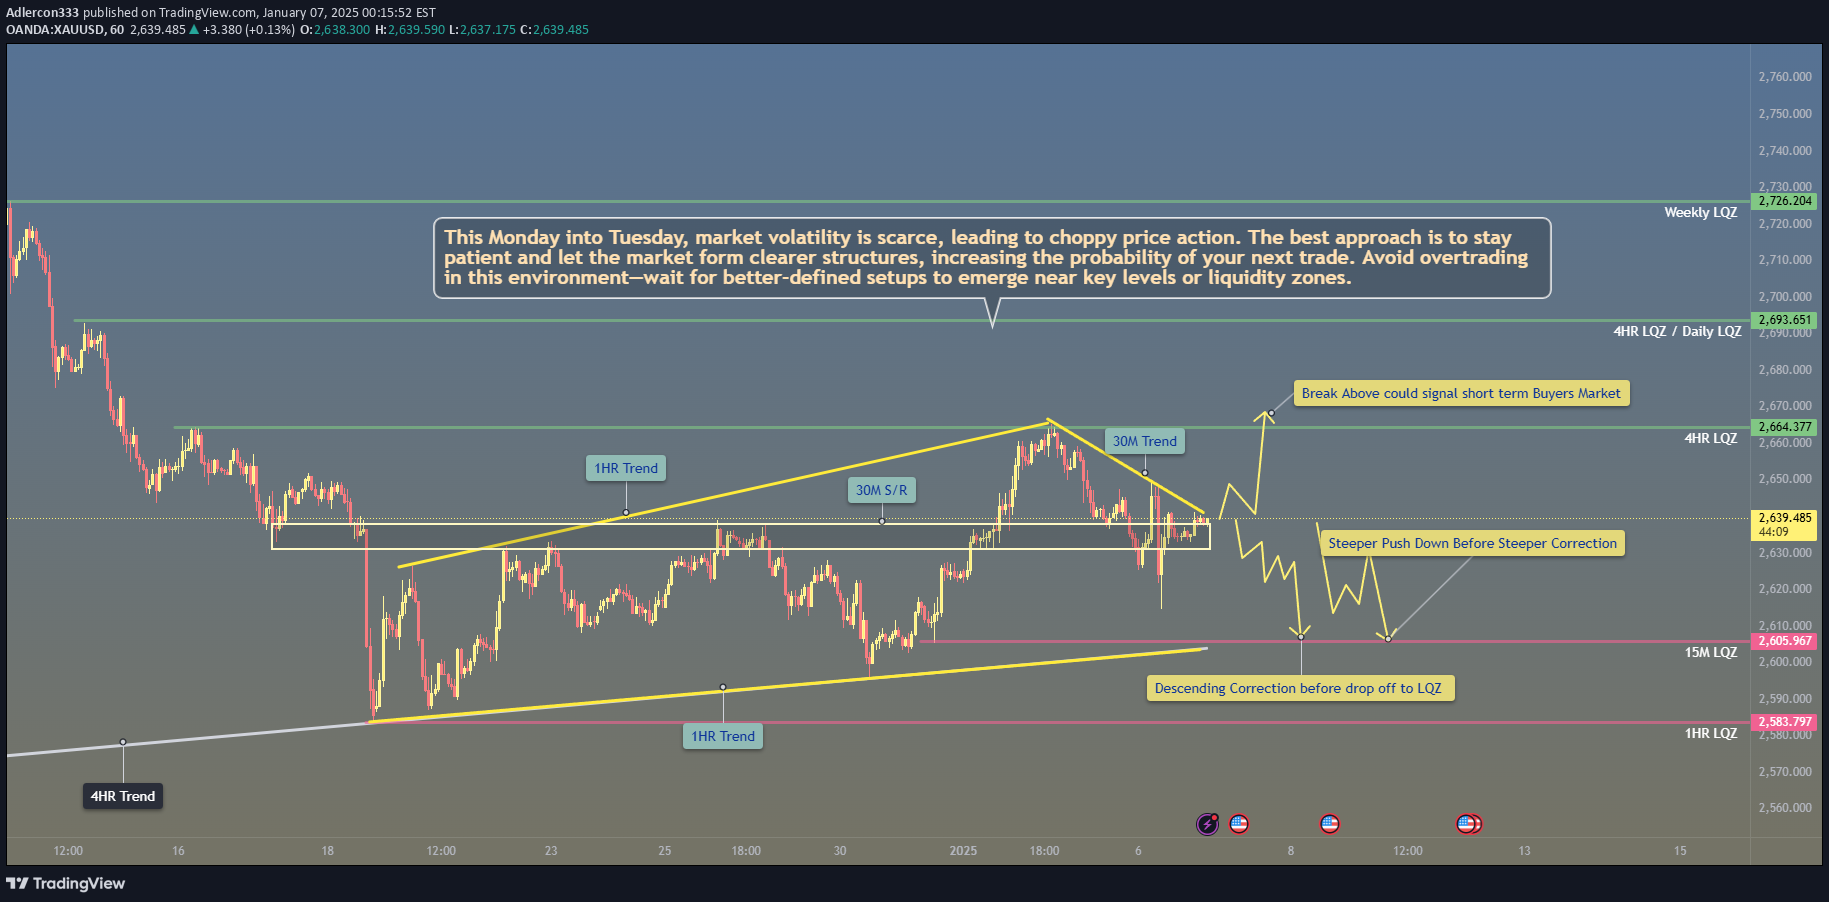
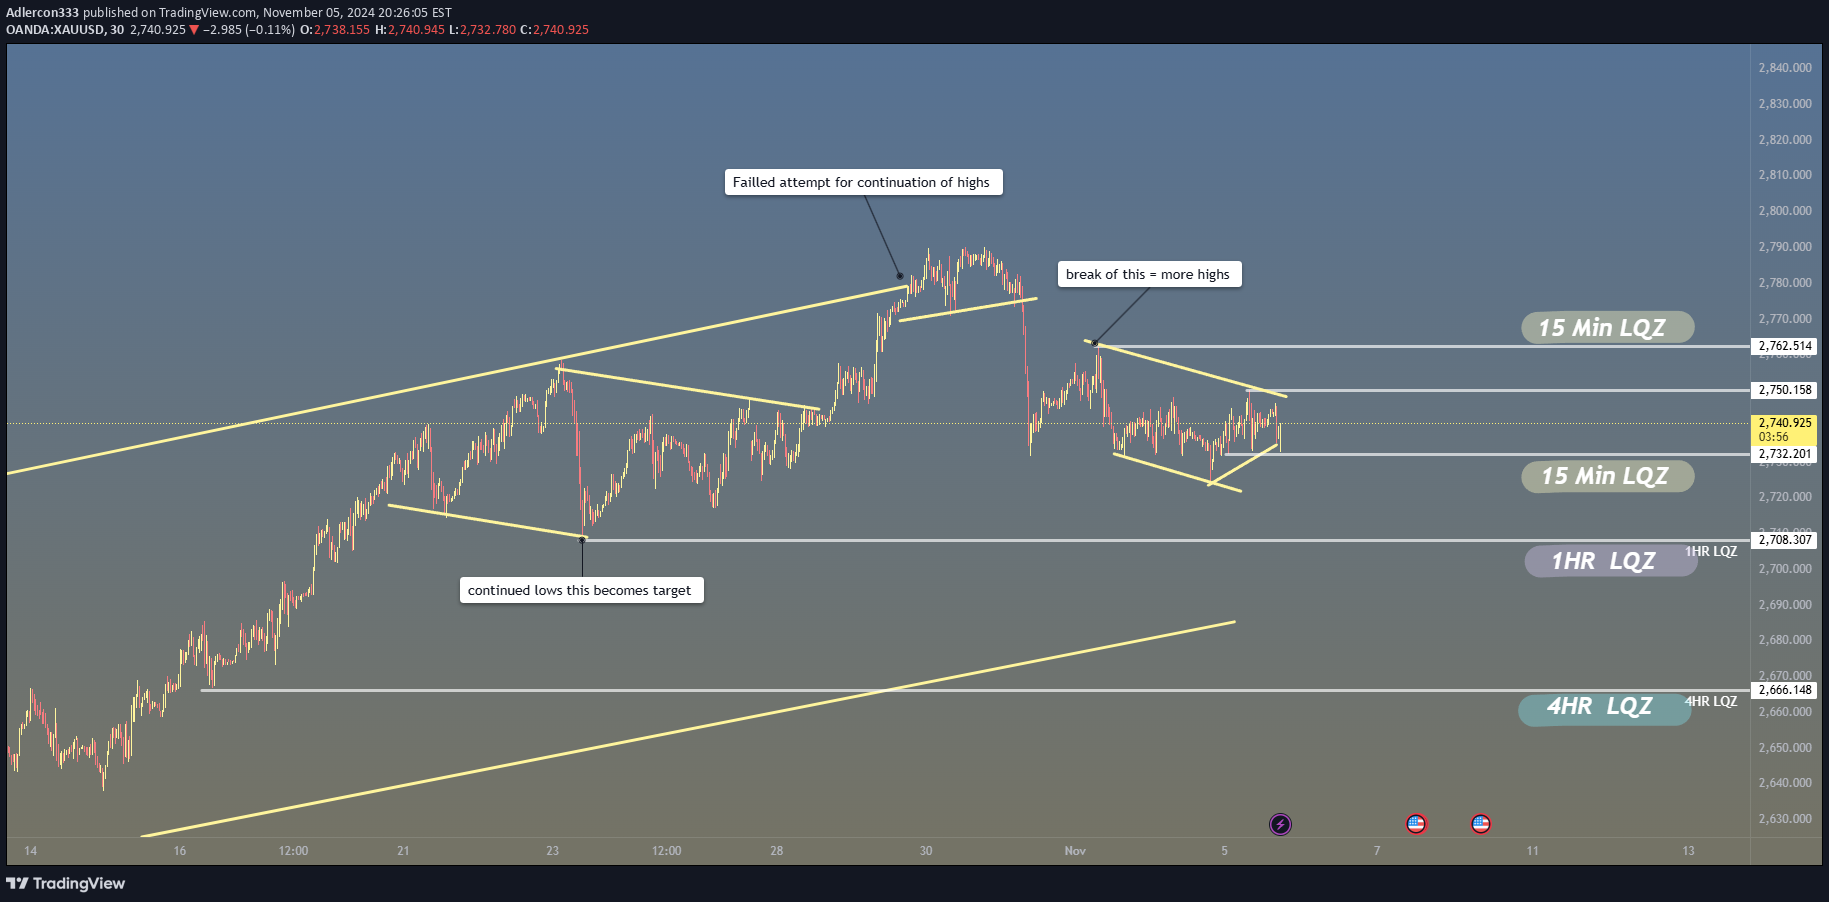
This chart highlights a low-probability trading environment with corrective structures and low volatility. Key focus areas: Upside Breakout: Watch for impulsive moves above the 30M trendline and 4H LQZ for short-term bullish setups. Downside Correction: A steeper drop into the 15M or 1H LQZ may provide higher-probability long opportunities. Stay Patient: Avoid trading inside the choppy range; wait for clear reactions at liquidity zones or strong breakouts with momentum.
Adlercon333
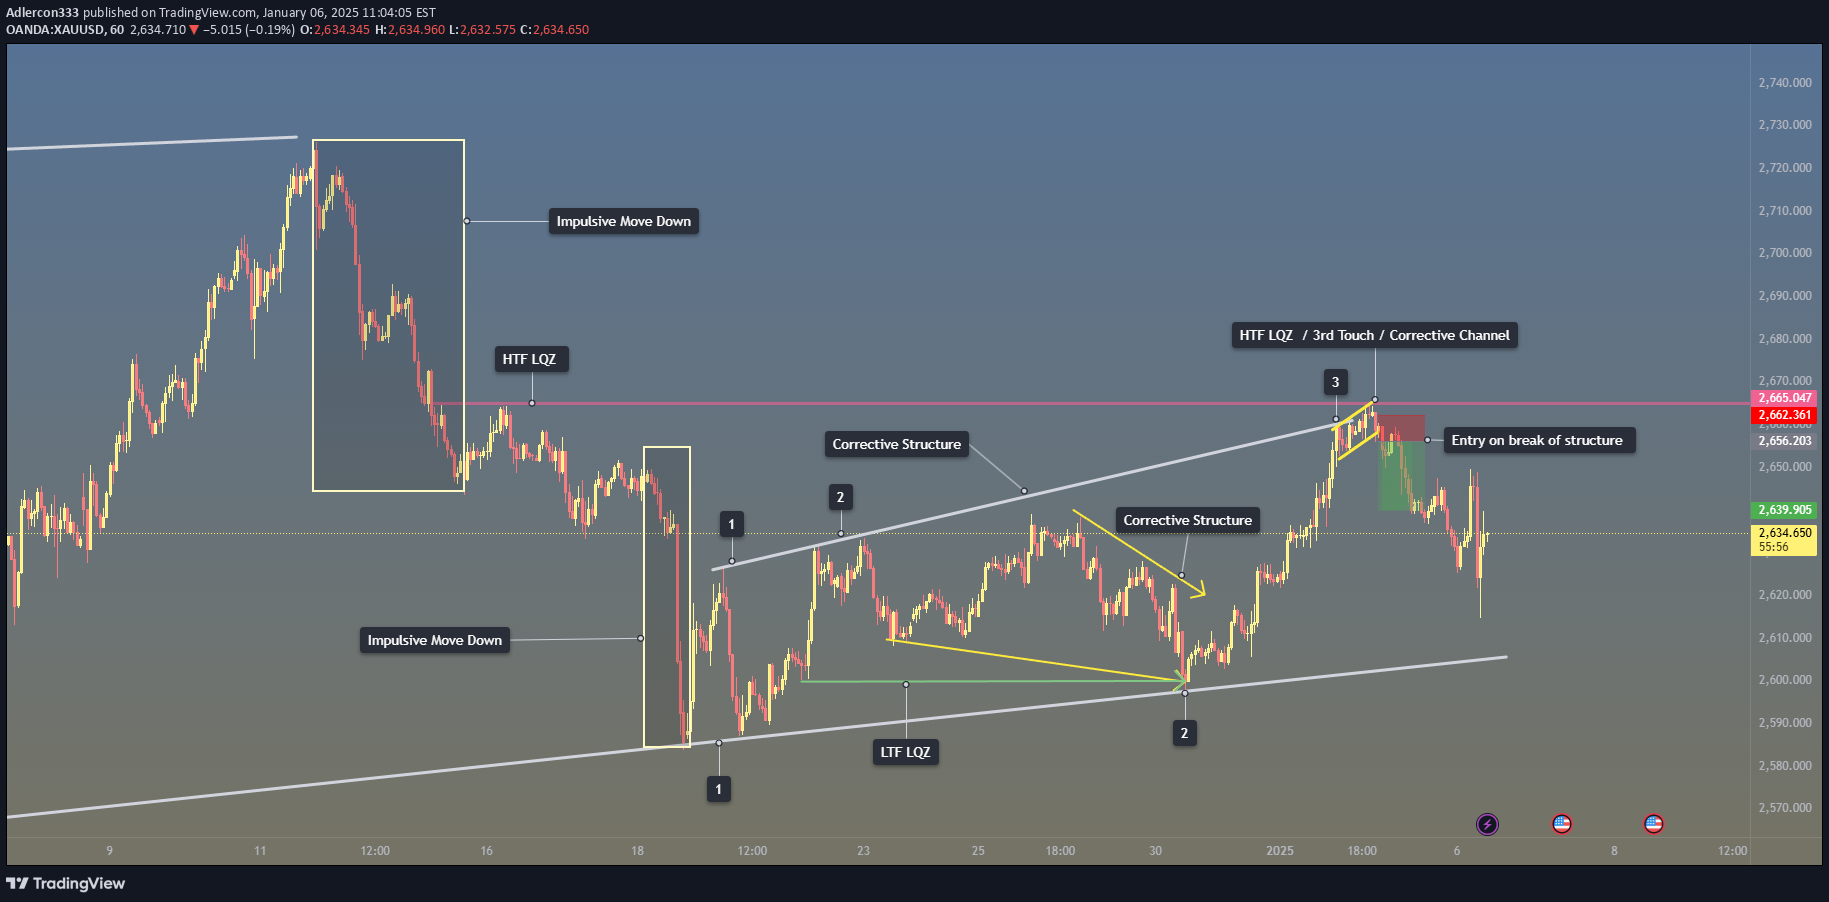
Reversal Setup Analysis: HTF Liquidity Zone + Ascending Channel Breakdown This chart highlights a high-probability bearish reversal setup based on key technical confluences. Here’s a step-by-step breakdown of the analysis: 1. High-Timeframe (HTF) Liquidity Zone (LQZ): - The red zone marks a major HTF supply area where price previously rejected with a strong impulsive move downward. This liquidity zone is critical as it represents an area where institutional players have shown activity, creating a high-probability region for a potential reversal. - As price approached this zone again, it did so in a corrective manner (via an ascending channel), which indicates weakening bullish momentum. 2. Impulsive vs. Corrective Structures: - Impulsive Move: The strong move away from the HTF LQZ (highlighted earlier in the chart) confirms bearish intent, serving as a key reference point for this trade idea. Corrective Structure: The price forms an ascending channel on the way back to retest the HTF LQZ, signaling exhaustion of buyers. - The third touch of the channel’s trendline coincides with the HTF LQZ, adding confluence for a potential bearish reversal. 3. Liquidity Zones in Play: - HTF Liquidity Zone (Supply): Serves as the key resistance level and primary rejection zone. - 15-Minute Liquidity Zone (Demand): Acts as a potential target for bearish momentum post-breakdown. - This multi-timeframe liquidity alignment strengthens the trade idea by providing clear areas of interest for entry, stop-loss, and take-profit placement. 4. Breakdown Entry and Structure: - Entry Trigger: The trade is triggered on the break of structure, where price falls through the lower boundary of the ascending channel. This breakdown confirms bearish momentum resuming after the corrective phase. - Stop-Loss Placement: Ideally placed above the HTF liquidity zone and beyond the third touch of the channel to account for potential fake-outs. - Take-Profit Levels: Targets can be set near the 15M liquidity zone or prior swing lows for a solid risk-to-reward ratio. 5. Key Takeaways: - This setup offers an excellent example of combining HTF liquidity zones, structural patterns, and market context to develop a high-probability trade idea. The rejection from the HTF LQZ aligns with the broader bearish narrative, while the ascending channel acts as a corrective structure leading to a continuation of the downward move. - By focusing on confluence factors like liquidity zones, impulsive vs. corrective moves, and structural breaks, this trade idea demonstrates a disciplined and strategic approach to trading reversals. Educational Insights: - Always zoom out to identify HTF zones of significance to ensure alignment with the larger market context. - Differentiate between impulsive and corrective structures to gauge the strength and intent of price movements. - Use pattern confluences (e.g., ascending channels) in combination with key zones to identify high-probability entries. - Prioritize patience and discipline by waiting for clear structural breaks to confirm your setup.
Adlercon333
This is an image of the original Video tutorial i made walking through XAU/USD Chart Analysis Summary In both charts, we see a prominent ascending channel on a higher time frame (HTF), suggesting an overall bullish structure initially. However, there are signs of potential reversals, especially around critical levels where price fails to break higher and instead forms correctional structures. The ascending channel shown aligns with The Rule of Three, as it often precedes reversals after the third touch due to exhaustion in the trend. Reversal Signal: Double Top with Bearish Flag The first chart illustrates a double top pattern within the broader ascending channel, a common reversal signal. This pattern suggests a weakening bullish momentum, aligning with a probable corrective phase. Following the double top, we observe a bearish flag or descending channel, indicating that the price may continue downward after a break. This aligns with Patterns within Patterns, where a smaller bearish flag within a larger corrective structure increases the probability of a downside move. Bull Flag Structure and Liquidity Zone Testing The second chart labels a large bull flag on the higher time frame (4H) near a liquidity zone. The corrective phase within this flag aligns with the market psychology of retracement after an impulsive move. Multi-Touch Confirmation indicates that these structures gain credibility with multiple touches on key support/resistance lines, making the upcoming third touch a critical point for deciding the direction. Potential Entry and Exit Scenarios Based on Entry Types from your strategy: High-Probability Entry: Enter on a break of the corrective structure (such as the bear flag or descending channel) following multiple touches. Place a stop loss above the recent high if you’re anticipating a downside continuation, using a reduced-risk entry if you see low-momentum candles and ascending channels close to the top. Wait for Confirmation: Given the corrective nature, it might be safer to wait for a confirmed breakout rather than entering at the top without solid confirmation. Back-tested data often shows better results when entries are taken after the third touch or initial pullback post-breakout. Confluence of Multi-Touch and Patterns The multi-touch confirmation method supports the idea of a third touch before a potential breakout or breakdown. Additionally, patterns within patterns enhance reliability, as seen with ascending or descending channels within larger structures, suggesting the market’s next probable moves more accurately. Strategy Application: Assess the Momentum: Enter on the first pullback (flag formation) after a significant breakout if momentum is strong. For a conservative approach, watch for a third touch on the boundary of the corrective channel. Risk Management: As part of your trading plan, place stops conservatively to avoid getting caught in corrective waves, as tight stops near liquidity zones may result in unnecessary stop-outs. Psychological Preparation: Avoid the perfectionist trap; if the confluence signals are strong but not perfect, following the 80/20 rule may be more beneficial than waiting for ideal entries, as markets rarely align perfectly with expectations.All targets we discussed and reasoning behind them covered in the video i shared yesterday have been reached and with CRAZY accuracy. Be sure to go back and watch that video for an in depth review of the market action before a major event such as the election. Also to why having the right technical is they key to when major news comes out just increasing the volatility of the overall direction in the market.
Adlercon333
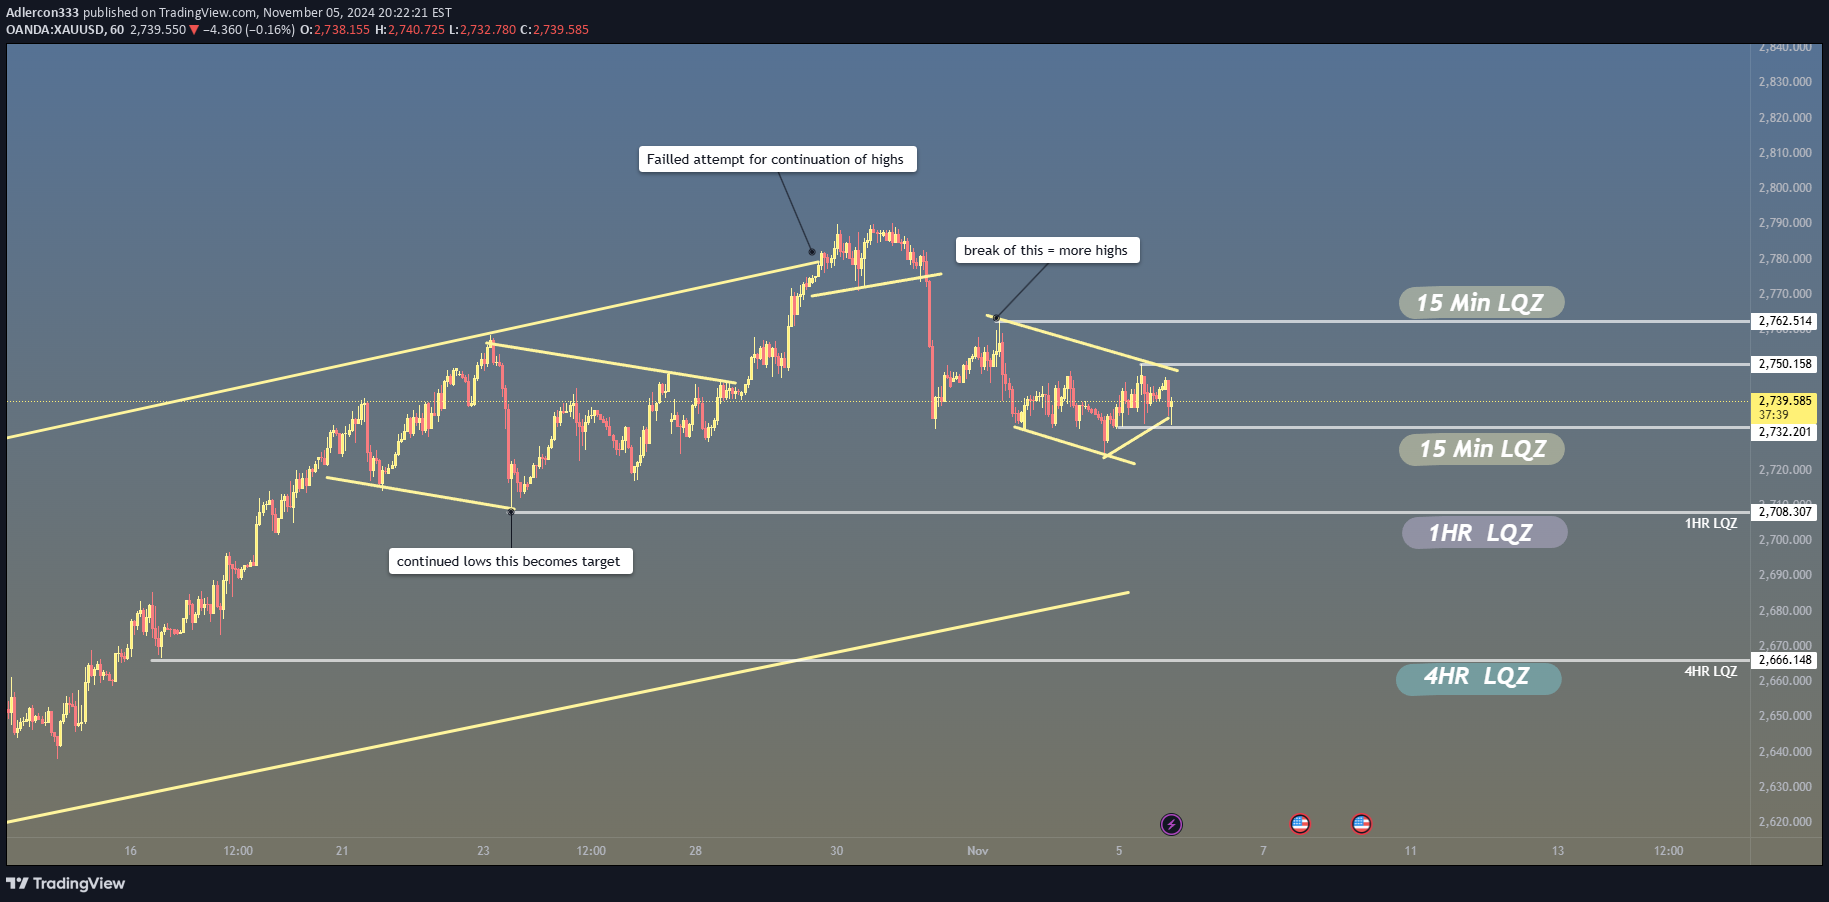
Chart Analysis Summary In both charts, we see a prominent ascending channel on a higher time frame (HTF), suggesting an overall bullish structure initially. However, there are signs of potential reversals, especially around critical levels where price fails to break higher and instead forms correctional structures. The ascending channel shown aligns with The Rule of Three, as it often precedes reversals after the third touch due to exhaustion in the trend. Reversal Signal: Double Top with Bearish Flag The first chart illustrates a double top pattern within the broader ascending channel, a common reversal signal. This pattern suggests a weakening bullish momentum, aligning with a probable corrective phase. Following the double top, we observe a bearish flag or descending channel, indicating that the price may continue downward after a break. This aligns with Patterns within Patterns, where a smaller bearish flag within a larger corrective structure increases the probability of a downside move. Bull Flag Structure and Liquidity Zone Testing The second chart labels a large bull flag on the higher time frame (4H) near a liquidity zone. The corrective phase within this flag aligns with the market psychology of retracement after an impulsive move. Multi-Touch Confirmation indicates that these structures gain credibility with multiple touches on key support/resistance lines, making the upcoming third touch a critical point for deciding the direction. Potential Entry and Exit Scenarios Based on Entry Types from your strategy: High-Probability Entry: Enter on a break of the corrective structure (such as the bear flag or descending channel) following multiple touches. Place a stop loss above the recent high if you’re anticipating a downside continuation, using a reduced-risk entry if you see low-momentum candles and ascending channels close to the top. Wait for Confirmation: Given the corrective nature, it might be safer to wait for a confirmed breakout rather than entering at the top without solid confirmation. Back-tested data often shows better results when entries are taken after the third touch or initial pullback post-breakout. Confluence of Multi-Touch and Patterns The multi-touch confirmation method supports the idea of a third touch before a potential breakout or breakdown. Additionally, patterns within patterns enhance reliability, as seen with ascending or descending channels within larger structures, suggesting the market’s next probable moves more accurately. Strategy Application: Assess the Momentum: Enter on the first pullback (flag formation) after a significant breakout if momentum is strong. For a conservative approach, watch for a third touch on the boundary of the corrective channel. Risk Management: As part of your trading plan, place stops conservatively to avoid getting caught in corrective waves, as tight stops near liquidity zones may result in unnecessary stop-outs. Psychological Preparation: Avoid the perfectionist trap; if the confluence signals are strong but not perfect, following the 80/20 rule may be more beneficial than waiting for ideal entries, as markets rarely align perfectly with expectations.All targets reached we discussed yesterday! AMAZING trading session everyone and we are going to have some incredible opportunities coming into the rest of this year.
Adlercon333
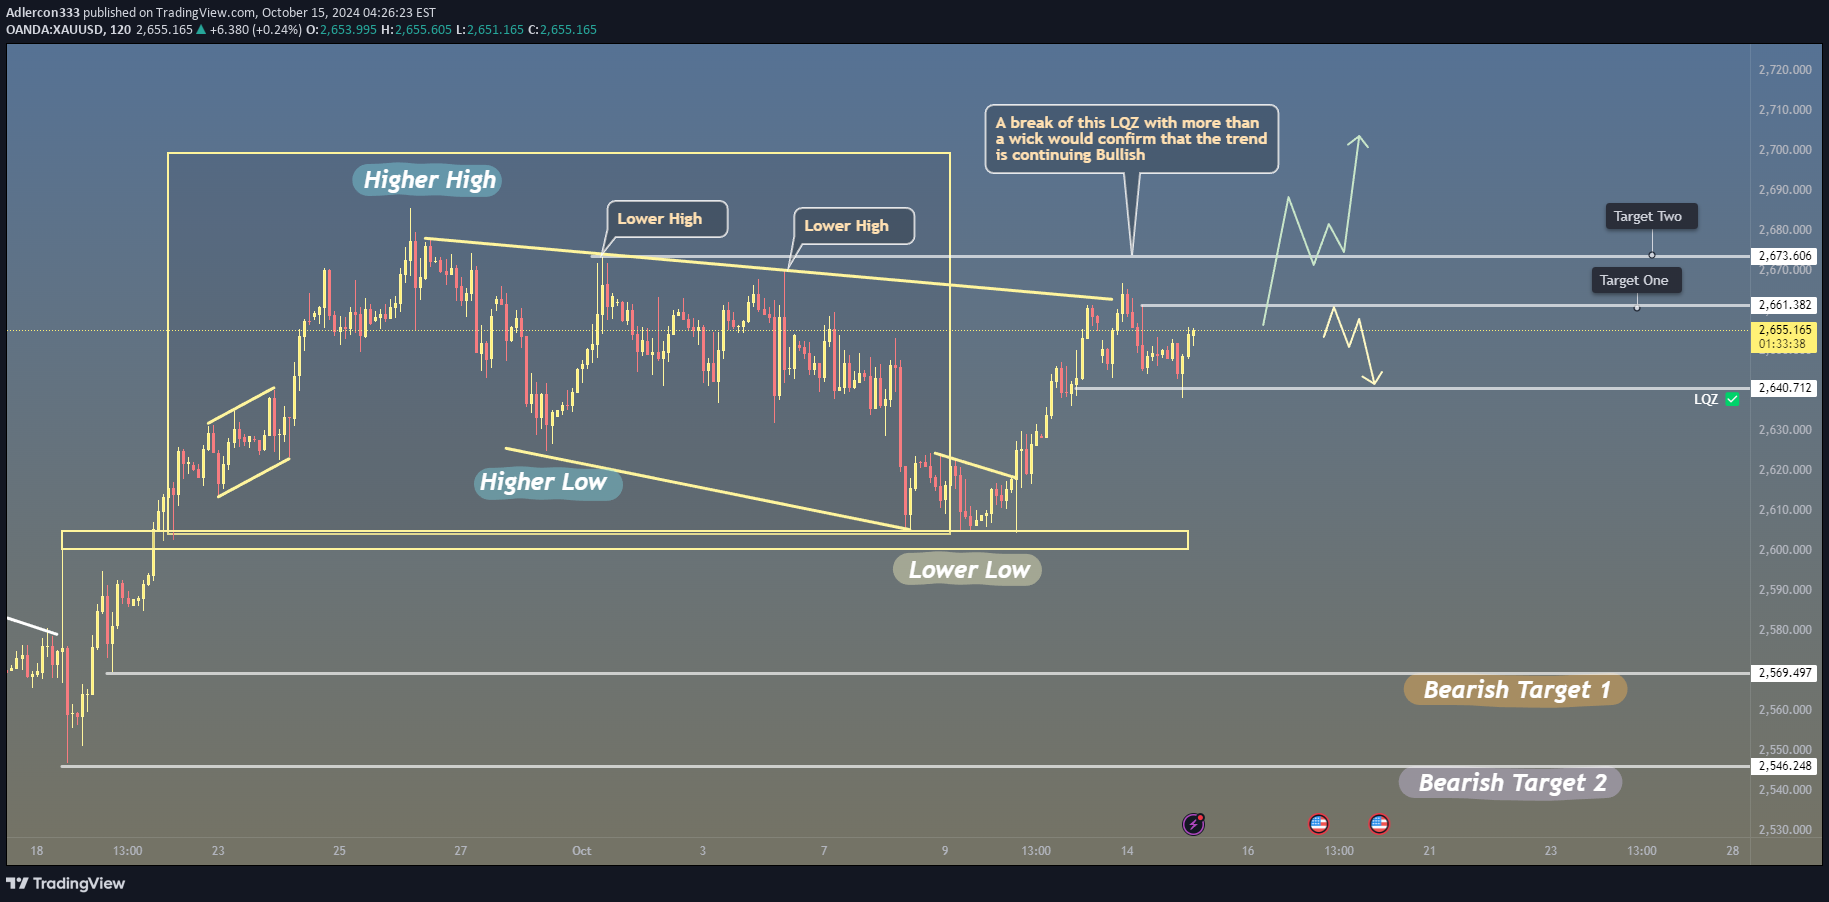
1. Recognizing Market Structures: Uptrends and Downtrends Higher Highs (HH) and Higher Lows (HL): These are signs the market is in an uptrend—prices keep moving up, forming new highs (peaks) and lows (dips) that are higher than the previous ones. Think of it like climbing stairs: each step higher shows the market’s strength. Lower Highs (LH) and Lower Lows (LL): When prices stop climbing and start forming lower peaks and lower dips, it signals that the market might be slowing down or reversing into a downtrend. In the chart: The first part shows a bullish (upward) move with Higher Highs and Higher Lows. Later, the market shifts to lower highs, signaling a potential slowdown or shift toward a downward move. 2. What Is the LQZ (Liquidity Zone)? Liquidity Zone (LQZ): This is a key price area where a lot of trading activity happens—like a hotspot where buyers and sellers clash. When price reaches such a zone, it either breaks through and keeps moving in that direction (bullish continuation) or bounces back down (rejection). Think of it like a soccer goal line: if the ball crosses the line, the team scores a goal (bullish move); if it’s blocked, the ball goes the other way (bearish move). In the chart: The LQZ is highlighted as the key level to watch. A clean breakout (with more than just a quick spike or wick) signals that buyers are strong enough to push the market higher. If the price gets rejected at this zone, the sellers regain control, and the market might move down. 3. Scenarios: What Happens Next? The chart offers two possible outcomes based on how price behaves near the LQZ. Bullish Scenario: If the price breaks above the LQZ and stays there, it’s likely to continue upward towards: Target 1: 2,661.38 Target 2: 2,673.60 These are the next levels where buyers might take profits or where new sellers could appear. Bearish Scenario: If the price gets rejected at the LQZ and drops lower, it could move towards: Bearish Target 1: 2,569.49 Bearish Target 2: 2,546.25 This suggests the sellers have taken control, pushing the market down. 4. How to Know When to Enter a Trade? The chart highlights the importance of waiting for confirmation before jumping into a trade. Here’s a simple trade plan: For a Buy (Long) Trade: Wait until the price breaks above the LQZ and stays above it. Enter on the first pullback (dip) after the breakout—this is often called a flag or retest. For a Sell (Short) Trade: If the price gets rejected at the LQZ, wait for a clear downward movement. Enter after the first lower high forms, confirming that the sellers are in control. Why wait for confirmation? Jumping in too early might cause you to get caught in a false breakout or fake move. Think of it like waiting to see which team scores first before betting on the game. 5. Avoid Emotional Trading and Manage Risk This chart reflects a key lesson: trading is a game of patience and probabilities. If the trade doesn't go as expected, it’s important to step back and wait for the next opportunity. Don’t chase trades just because you fear missing out (FOMO). You might enter too soon and hit your stop loss unnecessarily. Risk Management Tip: Use stop losses to protect your account from big losses. Avoid placing multiple risky trades on the same pair just because you’re impatient. It’s better to wait for high-probability setups. 6. Summary: A Simple Trading Plan Watch the LQZ level: If the price breaks above, look to buy on the next dip. If the price gets rejected, look to sell when it starts forming lower highs. Set Clear Targets: For bullish trades, aim for Target 1 and 2 above. For bearish trades, aim for Bearish Targets 1 and 2 below. Don’t Rush: Wait for clear confirmation before entering. Follow your trading plan and avoid emotional decisions.Gold has now Hit both profit targets and we are now in the process of waiting for it to give us a pull back for more entries.All trades have been closed and all targets have been reached for this week! I haven't been posting as much lately because whenever i post something for you the community it is because i will be actively engaging in the market myself! Beautiful trading week overall and accumulating 400 pips in opportunity.
Adlercon333
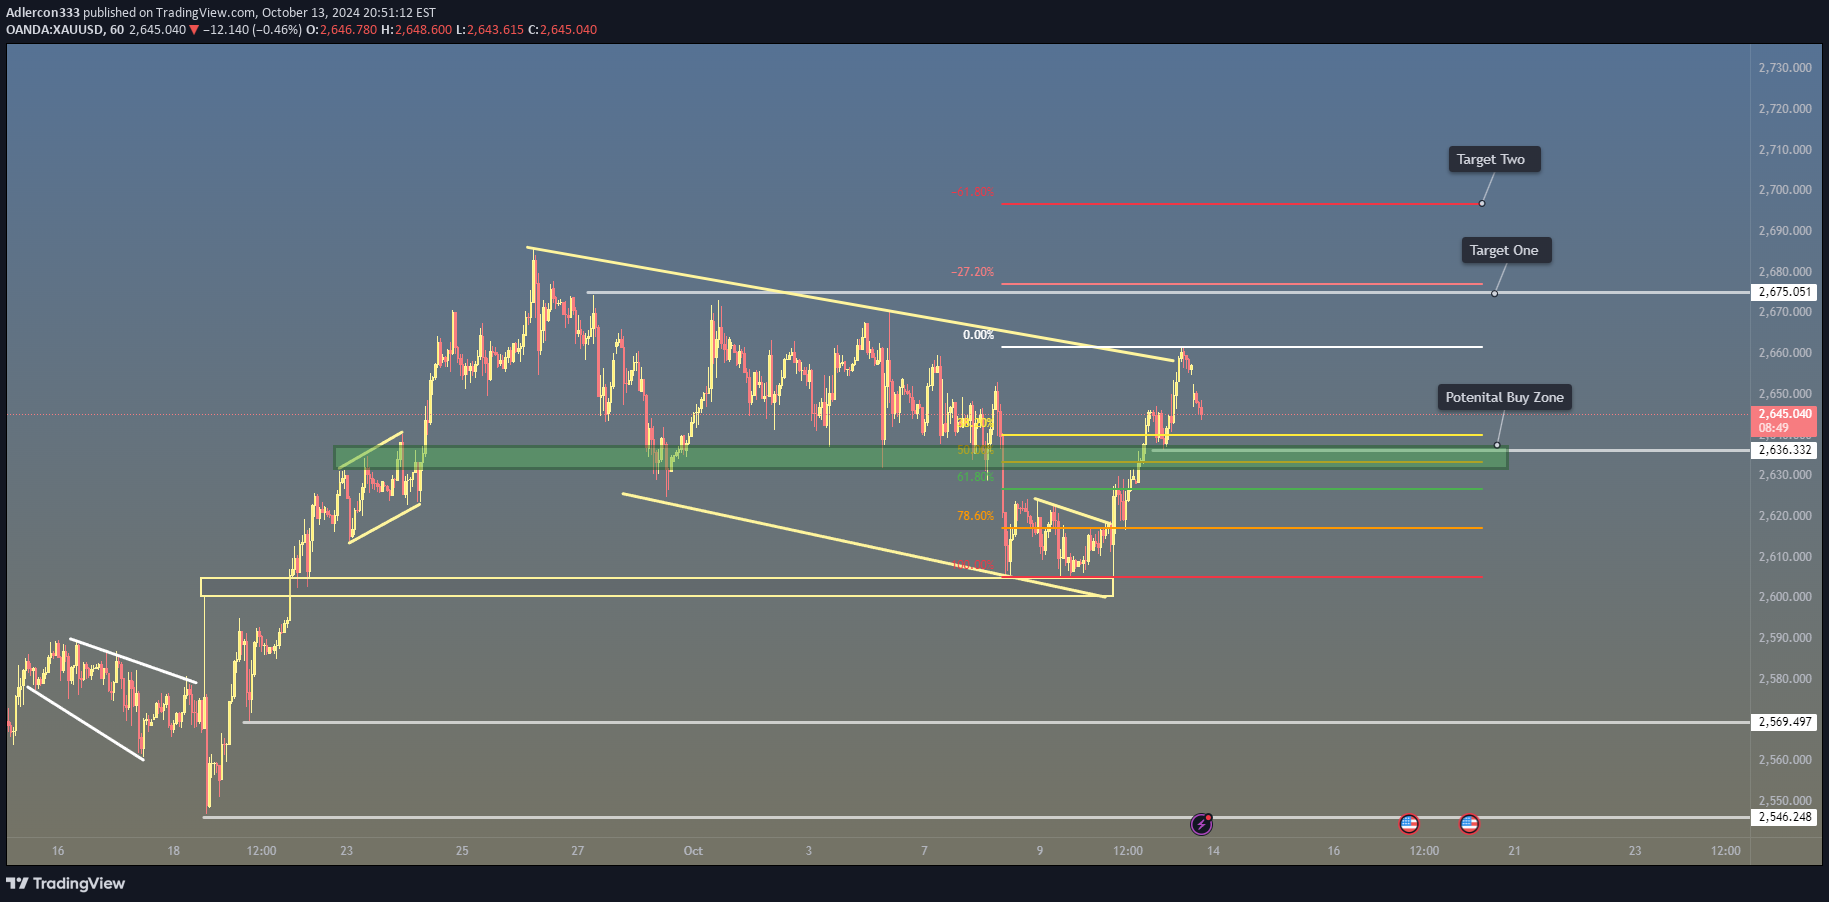
IWhat’s Changed and What to Look for Now? 1. Structure and Pattern Focus: Wedge and Correction Identified The yellow descending lines still highlight a wedge-shaped correction after the price made an upward impulsive move. Wedges often act as continuation patterns, meaning the trend (in this case, bullish) is likely to resume once the wedge is broken. Price has already broken out of the wedge and pulled back, hinting that the market might continue upward after this slight retracement. 🔍 What to Do: If you spot a wedge breakout like this, wait for a retest—which seems to be forming now—before entering the trade. This increases the chance of entering at a safer spot rather than chasing the move. 2. Identifying the "Potential Buy Zone" You have a Potential Buy Zone marked around the 2,636–2,647 range, which aligns with both: Key Fibonacci levels: 61.8% and 78.6% retracement levels. Demand area: The price previously bounced from this region, showing there’s buying interest. 📝 What to Do: Watch for price action signals within the buy zone, such as: Pin bars (candles with long lower wicks). Engulfing candles (strong green candles that close above the previous red ones). Mini flags or pullbacks to signal buyers stepping in. 3. Set Entry and Stop-Loss Levels Smartly If you enter within the buy zone, place your stop-loss below the 78.6% Fibonacci level (around 2,620). This ensures you’re protected if the trade goes against you. Target One: 2,675.051 Target Two: Around 2,700 These targets are based on previous highs and Fibonacci extensions (-27.2% and -51.8%). 🔍 Pro Tip: Always plan 2:1 or 3:1 risk-reward ratios. In this case, the stop-loss is relatively tight compared to the potential reward, making this a high-reward trade setup if price respects the buy zone. 4. Using "The Rule of Three" to Confirm the Setup Based on the Rule of Three, you should always have three confirmations before entering a trade. In this scenario, here’s how it applies: First confirmation: Price has entered the Fibonacci zone and buy zone (2,636–2,647). Second confirmation: A bullish reaction or candlestick signal forms (like a pin bar). Third confirmation: If price breaks above a mini-flag or consolidates slightly above this zone, it’s a strong sign to enter the trade. 5. What to Watch for as a Beginner If price touches the buy zone and starts to show signs of rejection (like a wick or small bullish candles), that’s your signal to consider entering. Be patient: If the price doesn’t give a clear signal, stay on the sidelines. Waiting for a proper entry reduces losses from impulsive trades. How to Back-Test This Setup: Look at past trades where the price pulled back into a similar buy zone with Fibonacci overlap. Record how often these setups worked and whether waiting for the confirmation signals improved your success rate. Summary for New Traders This chart is a great example of a continuation setup: Trend identification: The trend is still up, with a correction (wedge). Entry zone: The buy zone is based on Fibonacci and prior support. Wait for confirmation: Use candlestick patterns or break/retest setups. Targets and stop-loss: Define a stop below the buy zone, and target the next highs (2,675 and 2,700). This is an excellent opportunity to practice patience and discipline—wait for the right signals, and trade according to the plan. Use small positions if you're new, or try this setup in a demo account to build confidence!Gold Hit our predicted Buy Area and immediately moved away from our area for 145 pips late yesterday evening till this morning.All Targets have been Reached on gold! If you have the ability to hit the replay button on the chart above it is worth it to see how this played out.
Disclaimer
Any content and materials included in Sahmeto's website and official communication channels are a compilation of personal opinions and analyses and are not binding. They do not constitute any recommendation for buying, selling, entering or exiting the stock market and cryptocurrency market. Also, all news and analyses included in the website and channels are merely republished information from official and unofficial domestic and foreign sources, and it is obvious that users of the said content are responsible for following up and ensuring the authenticity and accuracy of the materials. Therefore, while disclaiming responsibility, it is declared that the responsibility for any decision-making, action, and potential profit and loss in the capital market and cryptocurrency market lies with the trader.