
Adilforgood
@t_Adilforgood

What symbols does the trader recommend buying?
Purchase History
پیام های تریدر
Filter
Adilforgood
Price Analytics: $TRUMP's Potential Correction and Future Rally
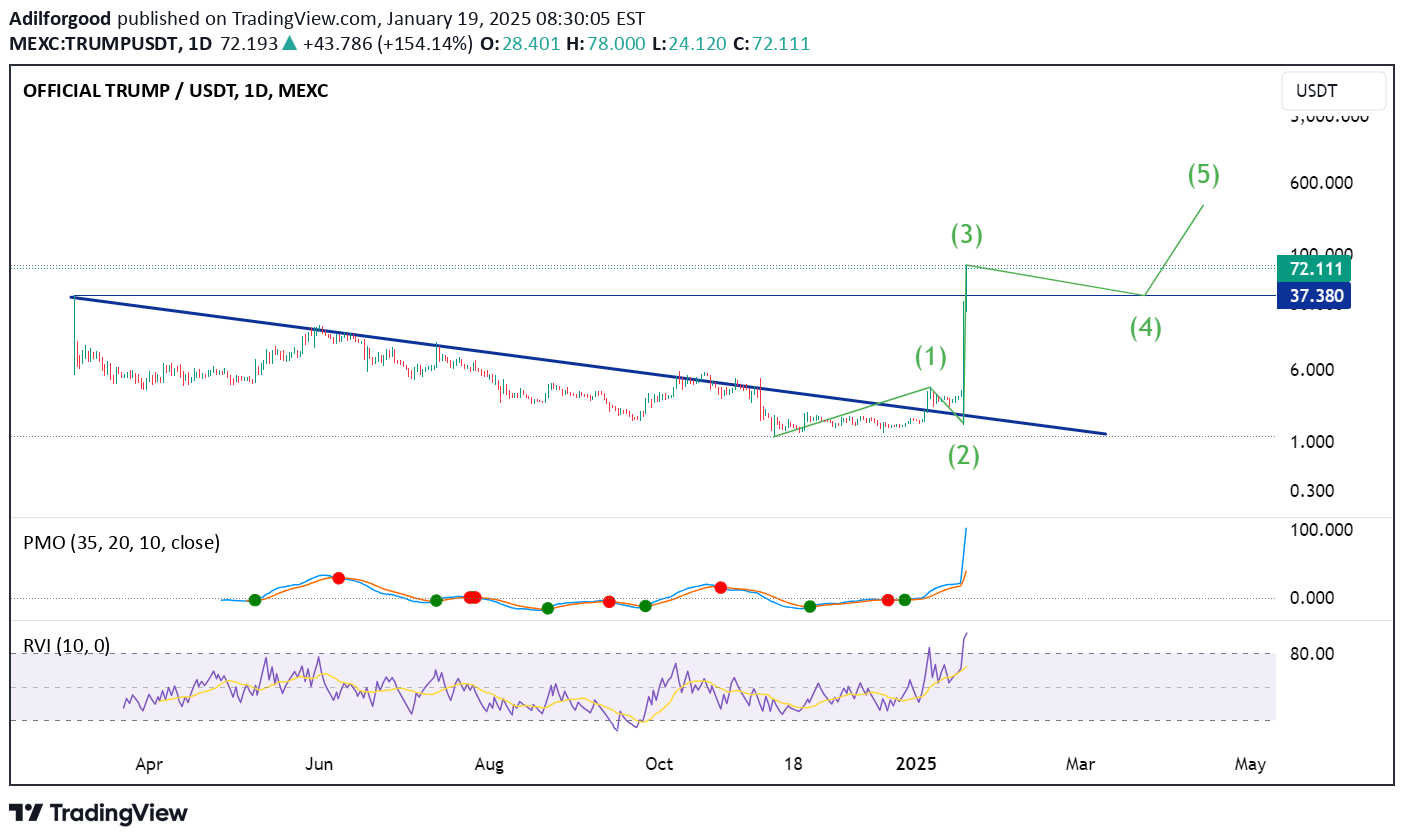
Possible Rebranding of an Existing Token: A Strategic Collaboration with the President The recent announcement of the TRUMPUSDT cryptocurrency has ignited discussions about its origin and its sudden rise to fame. Market data suggests that $TRUMP might not be entirely new but a rebranded version of an existing token. Historical price charts from exchanges like Gate.io and MEXC reveal trading activity for a $TRUMP -named token as far back as March 2024, long before the President’s public endorsement. Rebranding an existing token in collaboration with a high-profile figure like the President offers several advantages: Instant Market Hype: Association with a well-known personality generates massive publicity, attracting retail and institutional investors. Enhanced Trust and Legitimacy: A presidential collaboration can shift market perception, making the token appear more credible. Reviving Dormant Projects: Tokens with limited traction can leverage rebranding to reignite interest and trading activity. If the TRUMPUSDT token is indeed a rebranded project, its association with the President has proven successful, as evidenced by its meteoric rise in value to $72 shortly after the announcement. Current Analysis: The TRUMPUSDT token is currently trading at $72, experiencing a surge due to its high-profile launch. However, considering historical data and market patterns, a price correction to the $37–$40 range is likely. This range aligns with the previous all-time high (ATH) of $37–$38 recorded on March 5, 2024. Short-Term Projection: If the token revisits its previous ATH, this retesting could act as a strong support level. Historically, price corrections to significant levels often precede larger upward movements, as they confirm market confidence in these levels. Long-Term Projection: Assuming the token completes the #5 Wave of the Elliott Wave cycle, it could potentially surpass the $100 mark. The Elliott Wave theory suggests that the fifth wave is often driven by strong market sentiment and euphoria, fueled by both technical and fundamental catalysts. Conclusion: While the TRUMPUSDT token's current momentum is undeniable, investors should anticipate a near-term correction to $37–$40 before a rally beyond $100. This projection combines historical data, technical analysis, and the hype surrounding its rebranding and presidential collaboration. However, as with any volatile asset, investors should exercise caution and conduct thorough due diligence.Strategy still valid
Adilforgood
In depth #Dogecoin price movement basing on previous history (2)

Dogecoin's Post-Bitcoin Halving Trend: A December-January SurgeThis is the update to my DOGEUSD analysis from 2nd December 2024https://www.tradingview.com/chart/DOGEUSD/I5U77Mz3-Dogecoin-analysis-in-depth/Dogecoin's price movements have always intrigued traders and investors alike. Upon analyzing historical data,I have uncovered a fascinating and repetitive pattern: Dogecoin tends to experience significant price increases in December of the same year as a Bitcoin halving and January of the following year.Key ObservationsBitcoin Halving Events:These occur approximately every four years and historically impact the entire cryptocurrency market by reducing Bitcoin’s mining rewards, creating supply scarcity.Halving years: 2016, 2020, and the upcoming 2024.Conclusion:The 2024 Bitcoin halving, which occurred in April, sets the stage for potential bullish activity in Dogecoin during December 2024 and January 2025. Traders and investors should monitor Dogecoin’s performance closely during this period for opportunities.Trading Tips:Track Dogecoin price trends and market sentiment in the weeks leading up to December.Watch for volume spikes and social media activity, which often signal Dogecoin rallies.Combine historical data with technical indicators to make informed decisions.
Adilforgood
Bitcoin Halving and Its impact on price growth

Executive Summary BTCUSDT Bitcoin’s halving events have historically marked significant milestones in its price trajectory, often serving as catalysts for substantial growth. Each halving reduces the reward for mining new blocks by half, effectively decreasing Bitcoin’s issuance rate and increasing its scarcity. This predictable supply shock, combined with growing global adoption, has led to a recurring cycle of price surges post-halving.In this analysis, I'm trying to explore Bitcoin’s price performance after each halving event, focusing on the time it takes to surpass previous all-time highs (ATHs) and reach new price peaks. Using historical data and trendline analysis, we provide insights into Bitcoin’s current trajectory following the April 19, 2024, halving, and evaluate the potential for its price to reach unprecedented levels in this cycle.Key observationsNovember 28, 2012 HalvingAfter Bitcoin's first halving, it took approximately 368 days to surpass its previous ATH of ~$31 (set in June 2011).New ATH (November 2013): ~$1,242.July 9, 2016 HalvingPost-halving, Bitcoin took 266 days to exceed its prior ATH of ~$1,242 (set in November 2013).New ATH (December 2017): $19,764.May 11, 2020 HalvingFollowing the 2020 halving, Bitcoin surpassed its previous ATH of $19,764 (from December 2017) in just 161 days.New ATH (November 2021): $69,000.April 19, 2024 Halving (Projected)As of December 2024, 238 days post-halving, Bitcoin has already surpassed its prior ATH of $69,000 (from November 2021) and is currently trading at $101,393.Trendline AnalysisDrawing a trendline connecting the 2017 ATH ($19,764) and 2021 ATH ($69,000) reveals a potential upper boundary for BTCUSDT Bitcoin’s post-halving growth. This trendline indicates that Bitcoin may test the upper range, with a target price around $200,000 USD in the current cycle.Risks to ConsiderMacro-Economic Factors: Geopolitical events, interest rate changes, or regulatory actions could disrupt market trends.Market Liquidity: Declining liquidity could delay BTCUSD price breakout despite favorable conditions.Unexpected Events: Network-specific issues or technological vulnerabilities may impact price movements.RecommendationsFor Traders: Monitor key resistance levels and trading volumes for breakout confirmation.For Long-Term Investors: Consider accumulating during consolidation phases for optimal entry points.For Analysts: Keep an eye on macroeconomic indicators and Ethereum’s network activity to validate price movement projections.ConclusionBitcoin’s consistent post-halving price surges underscore the significant role halvings play in shaping its growth trajectory. Historical data and trendline projections suggest that Bitcoin has the potential to reach unprecedented highs in this cycle, with a plausible target near $200,000 USD. While macroeconomic factors and market dynamics may influence short-term movements, the long-term growth pattern remains compelling for investors and analysts alike.Disclaimer: This analysis is based on historical data and is not financial advice. Cryptocurrency investments carry risks, and readers are advised to conduct their own research.
Adilforgood

Adilforgood
Dogecoin analysis in depth

Key Observations from Historical Data DOGEUSDT DOGEUSD : After July 9, 2016 (BTC halving to 12.5 BTC): Dogecoin rose 10,062% in 550 days.Key takeaways: A steady rise occurred over a prolonged period after Bitcoin's halving, benefiting from the general bullish market sentiment. After May 11, 2020 (BTC halving to 6.25 BTC): Dogecoin rose 18,693% in 362 days.Key takeaways: The price skyrocketed faster and more aggressively, possibly due to increased retail interest, the rise of meme coins, and Dogecoin-specific catalysts.Post-2024 Halving Projections:If Bitcoin's April 2024 halving (to 3.125 BTC per block) follows similar patterns, historical precedent suggests a significant price surge for Dogecoin. However, the extent and timing depend on various factors. Projection Based on Historical Patterns: If Dogecoin repeats the 10,062% rise (2016 pattern): This would imply a 100-fold increase from current levels. Assuming Dogecoin's price is around $0.07 at halving, the price could theoretically reach $7-$8.If Dogecoin replicates the 18,693% rise (2020 pattern): This implies a 187-fold increase, pushing the price into the $12-$14 range.Extrapolating Higher Growth (24–30 USD): This requires a compounded acceleration beyond prior patterns. While ambitious, it assumes higher adoption, widespread FOMO, and a stronger meme culture fueled by media and influential endorsements.Timing to New ATH:1)The 2016 halving saw Dogecoin take 550 days to peak.2) The 2020 halving saw Dogecoin take 362 days to peak.3) Given the shortening cycles, 300–500 days post-halving for a new ATH seems plausible.Factors That Could Impact Growth: Bitcoin's Dominance: The overall crypto market typically follows Bitcoin's lead. If BTC establishes a strong bull run, altcoins like Dogecoin tend to outperform during later phases of the cycle. Market Conditions: Macroeconomic factors (interest rates, liquidity, regulations) and overall sentiment toward cryptocurrencies could amplify or dampen growth. Dogecoin-Specific Catalysts: Increased adoption (e.g., more merchant acceptance). Continued celebrity endorsements or community-driven initiatives. Development of utility beyond memes (e.g., real use cases, Layer 2 solutions). Retail and Institutional Interest: In 2020-2021, Dogecoin benefited from a meme-stock culture and retail FOMO. A similar sentiment, fueled by a strong community and media coverage, could reignite. Competition from Newer Meme Coins: The meme coin market is increasingly crowded, which might dilute Dogecoin's dominance in this space.Feasibility of $24-$30:While Dogecoin reaching $24–$30 implies an extremely aggressive growth trajectory, it is not entirely implausible given crypto's volatile nature and history of extraordinary rallies.Conclusion:1) A 300–500 day timeline for a significant peak is reasonable based on prior patterns.2) The price target of $24–$30 is an ambitious upper limit and assumes exponential adoption and exceptional market conditions. A more conservative range of $7–$14 could more aligns with historical data, but Dogecoin is about exception and future.Will update analytics soon.
Adilforgood
Solana (SOL/USD): Bullish Prospects and the Potential for a $10K

An Elliott Wave AnalysisAs of today, SOLUSD is trading at approximately $263 per coin, and it's become clear from a technical perspective that the cryptocurrency is currently in the midst of an exciting journey within Elliott Wave Theory’s third wave. For investors and traders monitoring Solana’s potential, understanding this wave structure can offer significant insights into its future price trajectory, with a bold possibility that could see the price surpass $10,000 in the coming years — given favorable market conditions.Understanding Elliott Wave Theory and its Application to SolanaElliott Wave Theory is a popular and effective method of technical analysis that identifies recurring price patterns driven by investor psychology and market sentiment. In a typical market cycle, there are five waves in the direction of the trend (impulse waves), and three corrective waves against the trend. Wave 1 represents the initial surge, often unnoticed by the majority of market participants. Wave 2 is a correction or pullback. Wave 3 is typically the longest and most powerful of the impulse waves, driven by widespread adoption and market enthusiasm. Wave 4 brings about a minor correction, and Wave 5 concludes the bullish trend.Currently, Solana appears to be in Wave 3, a phase in which the price tends to expand considerably. This third wave, as per the theory, is usually the longest and most explosive, often surpassing the length of Wave 1. This offers a promising outlook for the SOL/USD trading pair in the medium to long term, especially as Solana continues to mature as a blockchain platform.Why the Third Wave is Crucial for Solana’s PotentialThe third wave of an Elliott Wave cycle is particularly significant for several reasons: Wave 3 is the longest – Historical price action shows that Wave 3 tends to be the most extended of the five waves in the cycle. If Solana is indeed in this wave, we can expect its upward momentum to be strong, pushing prices to new highs. Market sentiment – Wave 3 is driven by mass market participation, often following a period of increasing institutional interest, technological advancements, and favorable news. Solana’s growing adoption as a blockchain for decentralized finance (DeFi), NFTs, and decentralized applications (dApps) puts it in an ideal position to fuel this momentum. Potential for exponential growth – Given that Wave 3 is typically more robust and substantial than Wave 1, we could see Solana’s price extend into an uncharted territory, far beyond the current $263 mark.Solana’s Path Towards $10,000Looking forward, if Solana continues its strong development, adopts newer technologies, and maintains robust network upgrades, the price could experience exponential growth. Historical patterns suggest that, when in the third wave, markets can experience significant price appreciation.If we extrapolate this logic, considering the magnitude of Wave 1 and Wave 2, and assuming Solana continues to solidify its place as a leading blockchain platform, the third wave might take the price of SOL above $10,000 per coin.Here’s why this is a potential scenario: Technological Innovation – Solana has distinguished itself as one of the fastest and most scalable blockchains in the crypto space. As the Solana ecosystem continues to evolve, new developments such as the potential for Solana to become a key player in the DeFi and NFT sectors could increase its value drastically. Broader Market Adoption – If more institutional investors and users gravitate toward Solana as their blockchain of choice, the demand for SOL tokens will rise significantly, likely pushing the price even higher. This will be especially true if Solana attracts more decentralized finance projects or integrates with other major platforms. Favorable Political and Economic Environment – The cryptocurrency market’s long-term growth potential depends largely on regulatory clarity and broader political factors. If political environments remain favorable, particularly in key regions such as the US, Europe, and Asia, Solana could benefit from increased adoption. Continued DeFi and NFT Growth – Solana’s blockchain has seen growing use in both the decentralized finance (DeFi) and NFT spaces, with more projects launching on its fast, low-fee network. If these trends continue, demand for Solana's native token could continue to grow, helping to push prices higher.A Long-Term PerspectiveWhile it's important to note that cryptocurrency markets are highly volatile, and predicting the exact price of Solana years down the road remains speculative, it’s clear that if Solana continues to develop, and the market conditions align favorably, it could see incredible price growth. The current formation of the Elliott Wave structure on the monthly timeframe suggests that Solana might just be at the beginning of an incredibly bullish phase, with the third wave offering massive upside potential.The price target of $10,000 for Solana may seem lofty at first glance, but considering that Wave 3 tends to be the longest and most powerful phase in an Elliott Wave cycle, such a scenario becomes feasible over the long term. For now, traders and investors should keep an eye on the ongoing price movement and macroeconomic factors that could help shape Solana’s future trajectory.ConclusionThe Solana/USD pair is currently in the midst of the third wave in Elliott Wave Theory, which historically is the most powerful and lengthy of the impulse waves. Given Solana's technological advantages, strong growth in DeFi and NFTs, and favorable market conditions, there is a significant possibility that the price of Solana could exceed $10,000 in the future. However, it’s important to monitor the broader market sentiment, technological advancements, and political stability that will influence the trajectory of this crypto asset.For now, if you're holding Solana, the future looks promising, with the potential for massive returns over the coming years — provided the bullish momentum from Wave 3 continues to develop as expected.For research purposes only!
Adilforgood
Analyzing Bitcoin's price to 200K$

Analyzing the BTC/USD ChartA very interesting pattern is forming on the BTC/USD chart, particularly on the 1-month time frame. After analyzing the chart and considering Bitcoin's historical behavior, I believe we're currently within an uptrend channel—a trend that has been intact for several years now. The price has been consistently making higher highs and higher lows, suggesting strong upward momentum. This is a significant indicator of Bitcoin's long-term bullish trend.Larger Timeframe Pattern: The Triangle FormationLooking at the larger time frame, I observe that a triangle pattern is gradually taking shape. These triangles typically form during periods of consolidation, where price action compresses within converging trendlines. This suggests that we're witnessing a significant pattern of indecision between buyers and sellers.Crucially, triangles often lead to a breakout once the price is forced to move beyond the confines of the pattern. Given Bitcoin’s history of explosive moves following periods of consolidation, it seems plausible that we are on the verge of another major breakout.Anticipating a Breakout and Price MovementIf the triangle pattern continues to develop as expected, I anticipate that Bitcoin could break to the upside, potentially seeing substantial price appreciation in the coming years. The extent of this breakout will depend on how the market reacts as the triangle continues to tighten. If sustained demand and interest continue—especially from institutional investors—the breakout could be significant, driving Bitcoin’s price even higher.Why Bitcoin Could Reach $200,000: Key FactorsI believe there is a strong case for Bitcoin reaching $200,000 for one BTC within the next few years. Here’s why:a. Long-Term Uptrend ChannelBitcoin has demonstrated an ability to remain in an uptrend for long periods, even amidst volatility. The structure of higher highs and higher lows points to an ongoing bullish trend, driven by factors such as increasing adoption, technological advancements, and growing recognition of Bitcoin as a store of value.b. Institutional AdoptionMajor institutional players are increasingly embracing Bitcoin. Companies like MicroStrategy, Tesla, and Grayscale have purchased significant amounts, and platforms like PayPal and Fidelity have integrated Bitcoin into their offerings. As institutional demand continues to grow, it could drive Bitcoin’s price much higher.c. Scarcity and Supply DynamicsBitcoin operates on a deflationary model, with a fixed supply of only 21 million coins. As demand increases, especially with Bitcoin’s growing use as a hedge against inflation, its price should naturally rise. The increasing amount of Bitcoin held long-term by investors and institutions reduces the available supply in the market, which could further drive up prices.d. Global Economic TrendsThe current macroeconomic environment, with rising inflation and potential fiat currency devaluation, makes Bitcoin an increasingly attractive alternative asset. Bitcoin is being viewed more and more as a “safe haven” asset—similar to gold—which strengthens the case for higher prices as more people look for stores of value outside traditional financial systems.e. Technological and Network UpgradesBitcoin continues to evolve with improvements like the Lightning Network, which enhances scalability and transaction speeds. As Bitcoin’s infrastructure grows, its real-world use case increases, making it more valuable and usable for daily transactions, which in turn could further elevate its price.f. Psychological Factors and FOMOThe Fear of Missing Out (FOMO) is a powerful force in financial markets, especially in the cryptocurrency space. As Bitcoin’s price begins to climb toward higher levels, it will likely attract more retail and institutional investors, accelerating its growth. A significant rally towards $200,000 could be fueled by this psychological factor.Conclusion: The Road to $200,000While Bitcoin's price movements are never without volatility, I believe that if it continues to follow the patterns we see on the chart, the breakout from the triangle could drive Bitcoin's price to $200,000 or even higher in the next few years. The fundamental factors supporting Bitcoin’s long-term growth—such as institutional adoption, scarcity, economic conditions, technological upgrades, and FOMO—make this projection plausible.
Adilforgood
Consolidation and Recovery phase for TIA/USDT

TIAUSDT has entered Consolidation and Recovery (C&R) phase.which should last upper till it reaches previous ATH, if cross it, then it will enter new BULL run phase.P.S.: When you get rich with my analysis, don't forget to thank me to my wallet, I will appriciate it.P.S.S.: DYOR.
Adilforgood
BAND/USDT is in consolidation and recovery phase

BANDUSDT is consolidating and recovering.This product worth of watching and keeping observation.P.S.: When you get rich with my analysis, Don't forget to thank me to my wallet. I will appricicate it.P.S.S.: DYOR.It is active
Adilforgood
ENA/USDT price is aiming go higher and higher

This reletively new ENAUSDT ENA/USDT has entered the Consolidation and Recovery (C&R) phase.Awaiting to break out the global channel and enter the Bull market phase.P.S: When you get rich, don't forget to thank me to my wallet. I will appriciate it.P.S.S: DYOR.It is well developing. Nice asset.
Disclaimer
Any content and materials included in Sahmeto's website and official communication channels are a compilation of personal opinions and analyses and are not binding. They do not constitute any recommendation for buying, selling, entering or exiting the stock market and cryptocurrency market. Also, all news and analyses included in the website and channels are merely republished information from official and unofficial domestic and foreign sources, and it is obvious that users of the said content are responsible for following up and ensuring the authenticity and accuracy of the materials. Therefore, while disclaiming responsibility, it is declared that the responsibility for any decision-making, action, and potential profit and loss in the capital market and cryptocurrency market lies with the trader.