
Cryptoπ
@g_1397879136

What symbols does the trader recommend buying?
Purchase History
پیام های تریدر
Filter
Cryptoπ
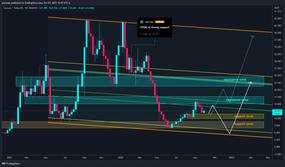
#Atom/usdt $ Atom is an huge descending channel. 🐻 Now Price is rejected from Middle Line of a Channel Who is the same with Long-Term Resistance Zone, so it is posSible that contents downtrend to Break Down of $ 10 and Touch Lower of Channel. 🐮 But if Price Going to Hold the Support of $ 10, it will be easy breaking out from Resistance Around $ 17 to Touch Upper Line of Channel Who is Middle Line of Bigger Channel. In the Long-Term Price Can Touch The Upper Line of the Bigger Channel. #Atom The price is inside the channel. 🐻 The price has now returned from the middle of the channel and possibly breaks $ 10 support and falls to the bottom of the channel and then act for the new uptrend. 🐮 But if it can maintain $ 10 support and the resistance of about $ 17, which is at the same time as the middle of the channel, breaks down to the upper channel, which is the larger middle channel. In the long run, the price can climb to the top of the channel. #Woman_ Freedom #Mahsa_amini TRADINGView
Cryptoπ
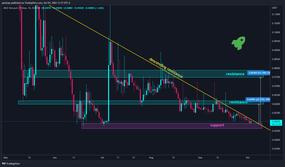
#Aioz/USDT $ AIOZ is About to Break From a Long-Triangle, 🐮 Breaking Out from Long-Serm Descending Resistance, Will Increase Price Toward Resistance Zone Around $ 0.06 and Even Resistance of $ 0.075. and Breaking Out from $ 0.08 CAN MOVE UP PRICE TOWER TREND TREND LINES. 🐻 Break Down from Support Zone Around $ 0.045 Will Invalid This Scenario. #Iz_Neturk The price is at the end of the long -term triangle pattern. Long -term descending resistance failure can raise prices to about $ 0.06 and even $ 0.075 resistance. If the resistance of $ 0.08 is broken, the price can rise to higher descending lines. 🐻 Failure to support the support range of about $ 0.045 invalidates this scenario. #Woman_ Freedom #Mahsa_amini TRADINGView
Cryptoπ
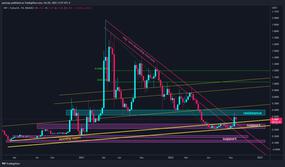
#XRP/USDT $ XRP Hold the Long-Term Ascending Support and Broke out of Long-Term Descending Resistance and Candle of this Week Is Making a Pullback to Confirm the Broken Resistance As Support. 🐮 Price Touchd the Resistance Zone, Break out of this Resistance Zone Will Increase Price to Upper Ascending Trend Lines. In the Long-Term Price May Touch The 0.5 Fib Level of the WHOL SWING Down. #Ripple Price maintained long -term support and broke the long -term descending resistance range. This week, Kendel was a broken resistance to confirm it as support. 🐮 The price of the resistance range has touched and the moneyback may continue until next week to support the support range, and then increase the failure of the price range to higher trendy lines. In the long run, there is the potential to reach 0.5 fibonachi levels in the total downtrend. #Woman_ Freedom #Mahsa_amini TRADINGView
Cryptoπ
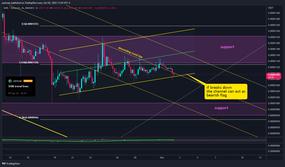
#Shib/USDT #Update $ Shib shaped an ascending channel, and Price is Struggling to Break Down from the Lower Line. 🐻 Breaking Down from Channel Cannel Can Shape a Bearish Flag and Drop Price to Support Zone Around 0.786 Fib Level Once Again. 🐮 Holding the Lower Line as Support Will Increase Price to Middle Line of Channel. #Shiba #Update The price is inside the uptrend and is trying to fail the bottom line of the channel. 🐻 Failure of the bottom line of the channel activates the descending flag pattern and the price can fall to the support range that coincides with the level of 0.786 fibonacci. 🐮 Maintaining the bottom line of the channel as a support increases the price to the middle line of the channel. #Woman_ Freedom #Mahsa_amini TRADINGView
Cryptoπ
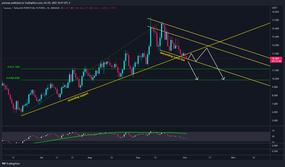
#ATOM/USDT قیمت ATOM خط حمایت صعودی را شکسته است. 🐻 به احتمال زیاد تا سطوح فیبوناچی ۰.۵ و ۰.۶۱۸ ریزش داشت، فقط مسیر این ریزش ممکن است متفاوت باشد. - ممکن است قیمت، خط روند نزولی را حفظ کند و یک نوسان نزولی در داخل کانال نزولی داشته باشد. - و اگر خط روند نزولی شکسته شود، شاهد یک دامپ (ریزش) شدید بود. #اتم
Cryptoπ
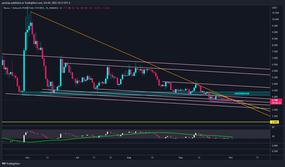
#Waves/USDT $ Waves is Inside a triangle that is beelow a long-perm triangle. 🐻 If Price Follow the Prevoice Triangle It will be Breaks down the line to the descending Trend Trend Lines Around $ 3.5 and $ 3.2, and Break Down from $ 3 will Toward Last Last Last Last Last Last Last Last Last Last Last Last Last Last Last Last Last Last Last Last Last Last Last Last Last Last Last 🐮 Holding the Lower Line of Triangle Will Increase Price Price to Break out of Long-Term Descending Resistance to Reach Resistance Zone ARound $ 4.2 and Will Increase More Toward Upper Trend Lines. #Views The price is inside the triangular pattern that is like the long -term triangle and is now lower than the previous triangle. 🐻 If the pattern repeats the previous triangle, breaks down the lower line of the triangle and falls to the lower descending lines of about $ 3.5 and $ 3.2. Failure of $ 3 can reduce the price to $ 2 in long -term support. 🐮 Maintaining a 4 -hour triangle lower line as support increases the price for the long -term descending resistance line and increased by about 4.2 and its failure can increase the price to higher trendy lines. #Woman_ Freedom #Mahsa_amini TRADINGView
Cryptoπ
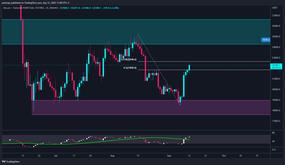
#BTC/USDT #Update $ BTC is Inside a Crucial Zone Between 0.618 and 0.5 Fib Level of the Last Swing Down. 🐮 Break out of this zone will increase it to resistance zone. 🐻rejection from this zone will Drop it to Support Zone. #Bitcoin #Update The price lies in the resistance range between levels of 0.5 and 0.618 fibonacci oscillations. 🐮 Failure of this range can increase the price to a higher resistance range. 🐻 Return from this range can push the price to the support range. TRADINGView
Cryptoπ
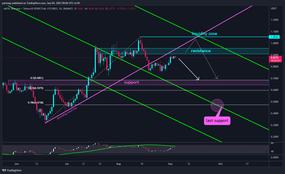
#MATIC/USDT $ Matic Broke Down from Ascending Support and Stayed Below Resistance Zone. 🐻 SO Price Can Drop to Support Zone Between 0.5 and 0.618 FIB Levels of Swing High. and it can Continue IT downtrend to 0.786 fib level where Meet the Descending Trend Line. 🐮🐻 Be Careful about the Top Price, Where Ascending and Descending Trend Lines Meet and Price Can Touch It Again. #Matthew The price of the trend is broken and is lower than the resistance range. 🐻 Therefore, the price can fall to the support range between levels of 0.5 and 0.618 fibonacci ascending fluctuations. There is a possibility of continuing to drop up to 0.786 fibonacci, where the descending line is intertwined. 🐮🐻 Prior to the price may again touch the previous peak within the confluence of the trendy lines. TRADINGView
Cryptoπ
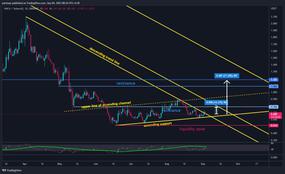
#1inch/USDT $ 1Inch Broke outward from daily descending Trend Line and is in Pullback to Broken Line, ALSO IT is Rejected from Lower Line of Ascending Channel. 🐮 Holding Above ascending Support Will Increase Price to Resistance Around $ 0.78 and Maybe Upper Line of Channel. IF Price Touch the Upper Line of Channel It is an image breaking out and price can Continue iT upward move toward resistance Zone Around $ 1.1. 🐻 Break Down from Ascending Support CAN DROP PRICE TO LIQUIDity Zone Around $ 0.5 #Van_ Inch The price of the trendy line has broken the downtrend and is approved as support. It is also higher than the trendy line. 🐮 Maintaining the lower channel line as support can increase the price to about $ 0.78 and even the top of the channel. If the price reaches the top of the channel and breaks down the descending line, it can increase its uptrend to about $ 1.1. 🐻 Failure of the lower line of the canal causes the price to fall to the Likiditite range of about $ 0.5. TRADINGView
Cryptoπ
#Document_Box The price of the downtrend is broken and fluctuates between the support range of about $ 0.76 and the resistance of about $ 1.5. The price is now close to the support range, which is the long -term trend. 🐮 Maintaining this support raise prices to $ 1.5 resistance, which coincides with the descending line. The failure of this resistance can increase the price by about $ 3. So the current price has a good risk to entering the currency. The failure of the support range causes the price to fall to the trend of the downtrend, and I think it will probably take a long time for the cows to regain market power.
Disclaimer
Any content and materials included in Sahmeto's website and official communication channels are a compilation of personal opinions and analyses and are not binding. They do not constitute any recommendation for buying, selling, entering or exiting the stock market and cryptocurrency market. Also, all news and analyses included in the website and channels are merely republished information from official and unofficial domestic and foreign sources, and it is obvious that users of the said content are responsible for following up and ensuring the authenticity and accuracy of the materials. Therefore, while disclaiming responsibility, it is declared that the responsibility for any decision-making, action, and potential profit and loss in the capital market and cryptocurrency market lies with the trader.