Technical analysis by readCrypto about Symbol BTC on 10/27/2025

readCrypto
رمز ارزها در انتظار: تفسیر نمودارها با ۳ اندیکاتور کلیدی (BTC، ETH، XRP)
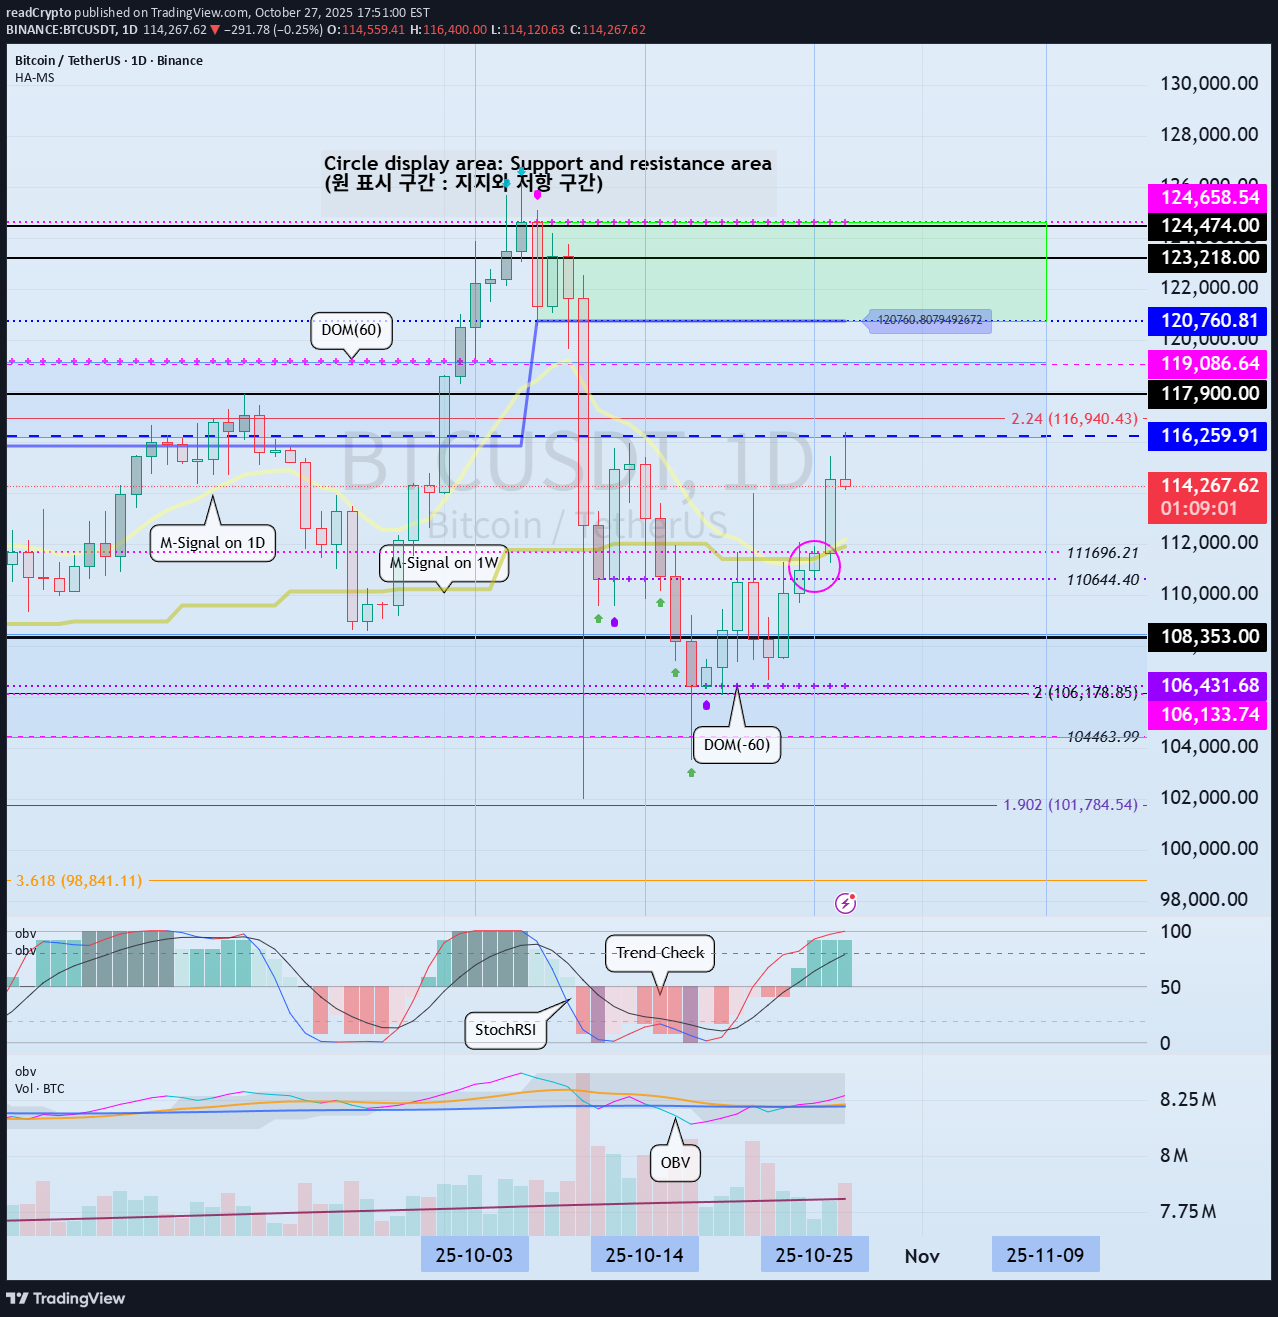
Hello, fellow traders! Follow us to get the latest information quickly. Have a great day! ------------------------------------- #BTCUSDT To break above a key point or range and continue the uptrend, 1. The StochRSI indicator must be trending upward. Ideally, it should not enter the overbought zone. 2. The On-By-Signal (OBV) indicator must show an upward trend. If possible, it should remain above the High Line. 3. The TC (Trend Check) indicator must show an upward trend. If possible, it should remain above the 0 level. Currently, only the TC indicator satisfies the above conditions. Therefore, if the price remains above the 110644.40-111696.21 range and the above conditions are met, we should see if the price rises above 116259.91 and remains there. If the On-By-Signal (OBV) indicator remains above EMA 1 and EMA 2 and rises above the High Line, further upside is likely. However, if the K indicator of the StochRSI indicator enters the overbought zone and the slope changes, the upside may be limited. When the TC (Trend Check) indicator touches its highest point, there's a high probability of forming a new high, so you should consider a response plan. Summary of the above: Support Zone: 110644.40-111696.21 Resistance Zone: 116259.91-119086.64 (up to 124658.54) ------------------------------------ #ETHUSDT As mentioned in the BTC chart description, ETH is also showing similar movements. However, the OBV indicator is just about to break above EMA 1 and EMA 2, so if it finds support near 4109.80, there's a possibility of further upside. ------------------------------------- #ZECUSDT Based on the BTC chart description, ZEC is likely to continue its upward trend. The chart is broken due to the sudden surge, making it difficult to determine the duration of volatility. -------------------------------------------- #XRPUSDT The key is whether the price can find support at key support and resistance levels and rise above 2.9092. ------------------------------------------ Ultimately, trading will be based on the support and resistance levels drawn on the 1M, 1W, and 1D charts. However, it is recommended to use auxiliary indicators to confirm whether to initiate a trade. The basic trading strategy is to buy in the DOM(-60) ~ HA-Low range and sell in the HA-High ~ DOM(60) range. However, if the price rises in the HA-High ~ DOM(60) range, a step-up trend is likely, while if the price falls in the DOM(-60) ~ HA-Low range, a step-down trend is likely. Therefore, a fractional trading strategy is recommended. In this context, the coin (token) currently closest to buying is XRP. - Thank you for reading to the end. I wish you successful trading. --------------------------------------------------