Technical analysis by CryptoChartDaily about Symbol INJ on 7/18/2025

CryptoChartDaily
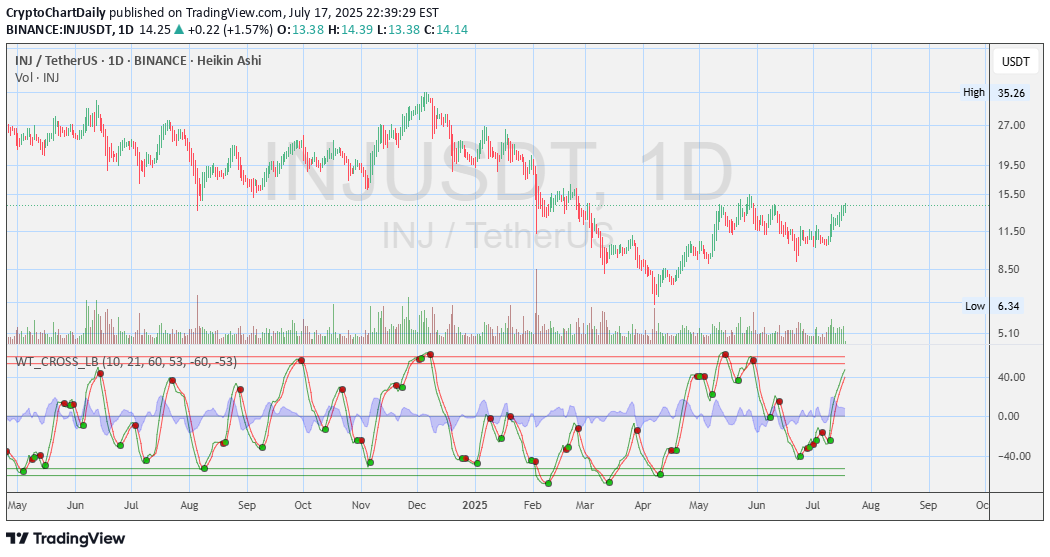
Here’s a detailed **technical analysis** of the chart you uploaded for **INJ/USDT (Injective Protocol)** on the **1D (Daily) timeframe** using **Heikin Ashi** candles and the **WaveTrend Cross Indicator (WT\_CROSS\_LB)**: --- 📊 **Current Price Zone:** * **Current Price:** \~\$13.59 * **Sell/Buy Spread:** \$14.18 Sell / \$14.19 Buy * **Daily Range:** \$12.83 – \$14.06 * **Volume:** Moderate, slightly increasing on green candles — showing growing interest. --- 📈 **Price Structure (Heikin Ashi Candles):** * Recent series of **strong green candles** — Heikin Ashi confirms trend direction well. * Steady **bullish momentum** after the reversal from \~\$8.5–9.0 zone in late May. * Price has formed a **higher low** and now attempting a **higher high**, indicating a potential trend reversal. --- 📉 **WT\_CROSS\_LB (WaveTrend Oscillator):** * **WaveTrend lines are surging upward**, indicating **strong bullish momentum**. * Green dot confirmed around mid-June (early entry signal). * The oscillator is now approaching the **+60 zone** — nearing **overbought territory**, so a short-term pullback could happen soon. * Previous tops at similar levels have resulted in **minor corrections**, so watch closely for divergence or exhaustion. --- 🧱 **Support & Resistance Levels:** * **Immediate Support:** \$11.20 – \$12.00 range (recent base) * **Current Resistance Zone:** Around \$14.50–\$15.00 * **Major Resistance Ahead:** \$17.50 and \$20.00 (psychological round numbers) * **Macro Resistance:** \~\$26 and \$35 (based on previous highs) --- 🔄 **Trend Overview:** * **Short-Term:** Bullish (higher lows, strong momentum) * **Medium-Term:** Reversal in progress — needs a break above \$15 for confirmation. * **Long-Term:** Still under macro resistance (\~\$20+), but shaping into recovery mode after long downtrend. --- ⚠️ **Key Risks & Notes:** * WaveTrend is nearing overbought → watch for divergence or volume drop. * Macro resistance levels remain strong — sentiment shift or BTC weakness could drag it back. --- ✅ Summary: INJ is showing **early bullish structure**, with momentum indicators supportive of further upside. It’s approaching resistance near \$14.5–15.0, which, if broken, could open up room toward \$17 and beyond. A small consolidation/pullback is healthy here. Volume and broader market sentiment will be critical to watch. -- Disclosures: This analysis is for informational purposes only and is not financial advice. It does not constitute a recommendation to buy, sell, or trade any securities, cryptocurrencies, or stocks. Trading involves significant risk, and you should consult with a qualified financial advisor before making any investment decisions. Past performance is not indicative of future results.
