
CryptoChartDaily
@t_CryptoChartDaily

What symbols does the trader recommend buying?
Purchase History
پیام های تریدر
Filter
CryptoChartDaily
آیا زمان شمعهای سبز **PLUME RWA** فرا رسیده است؟ تحلیل و نظرات کلیدی
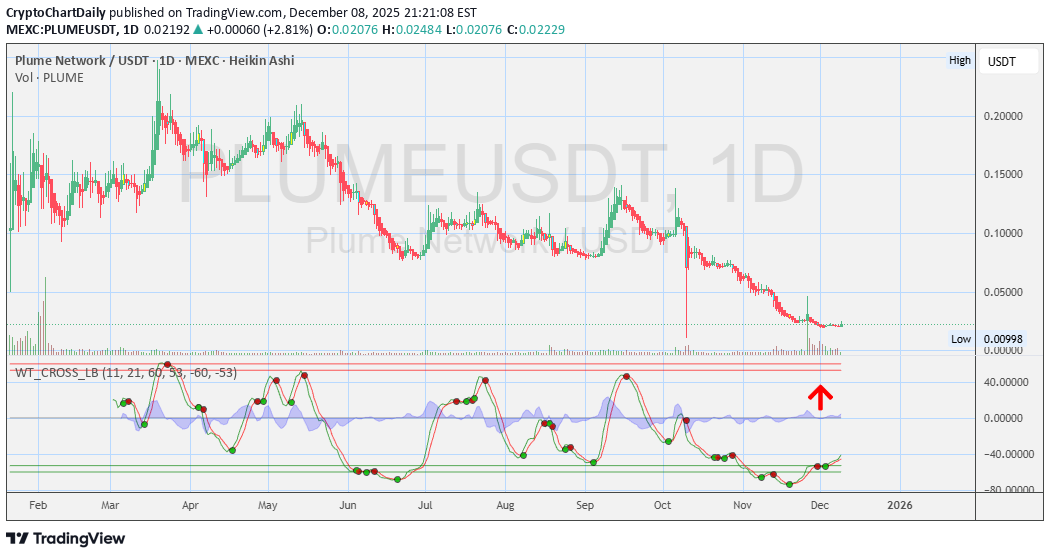
🧠 Keep it on watch. Momentum shifting. PLUME RWA - Is it finally time for some GREEN candles? Opinions? Lets share any opinions ⚠️ Disclosures : This analysis is for informational purposes only and is not financial advice. It does not constitute a recommendation to buy, sell, or trade any securities, cryptocurrencies, or stocks. Trading involves significant risk, and you should consult with a qualified financial advisor before making any investment decisions. Past performance is not indicative of future results.
CryptoChartDaily
سیگنال صعودی PLUME در نمودار روزانه: آیا وقت خروج از اصلاح است؟
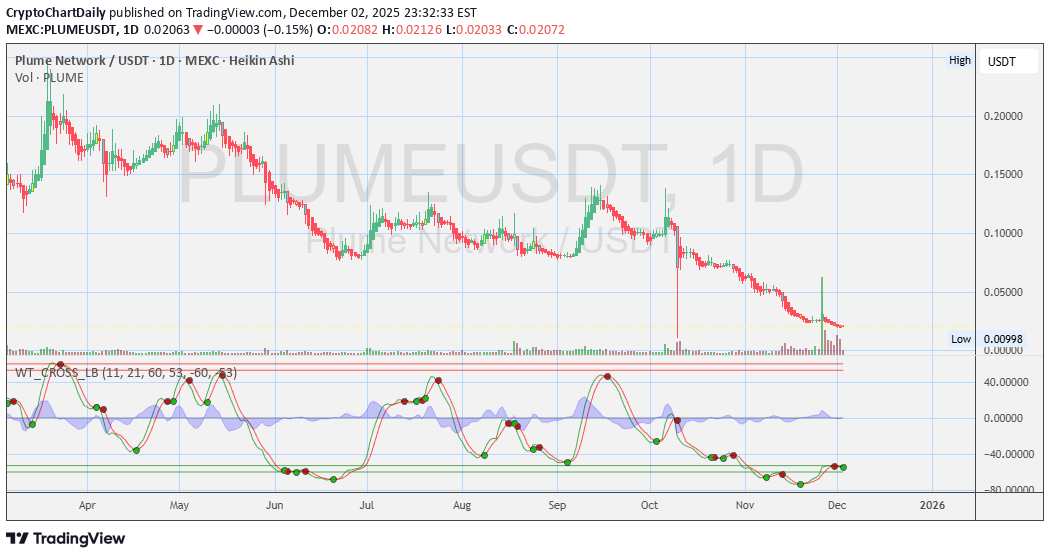
🧠 Keep it on watch. Momentum shifting. Time to see some green candles? Uptrend? or? Opinions? Lets share any opinions ⚠️ Disclosures : This analysis is for informational purposes only and is not financial advice. It does not constitute a recommendation to buy, sell, or trade any securities, cryptocurrencies, or stocks. Trading involves significant risk, and you should consult with a qualified financial advisor before making any investment decisions. Past performance is not indicative of future results.
CryptoChartDaily
پایان فروش سایبرماندی: آیا زمان بازگشت سبز پلاوم (PLUME) فرا رسیده است؟
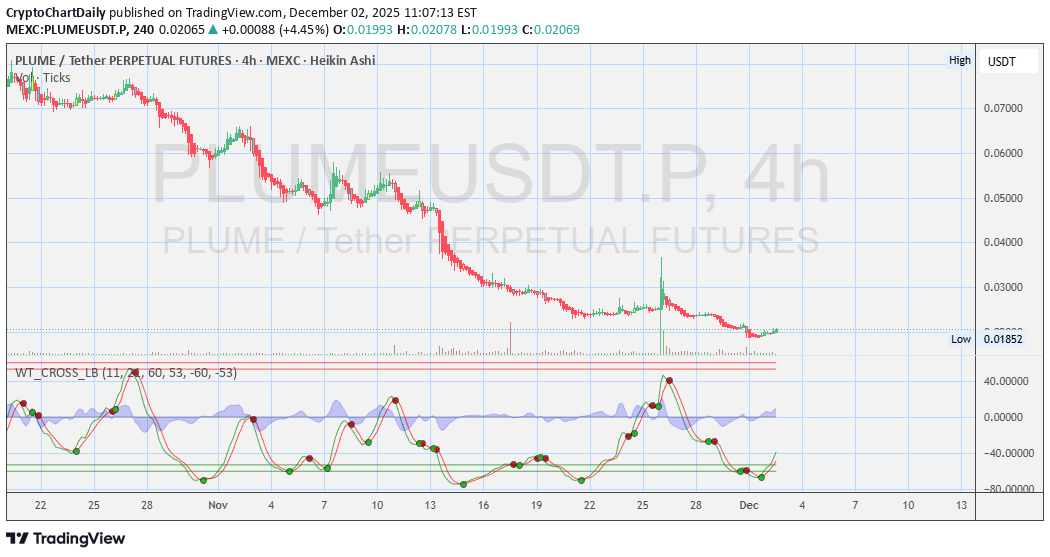
🧠 Keep it on watch. Momentum shifting. Time to see some green candles? Uptrend? or? Opinions? Lets share any opinions ⚠️ Disclosures : This analysis is for informational purposes only and is not financial advice. It does not constitute a recommendation to buy, sell, or trade any securities, cryptocurrencies, or stocks. Trading involves significant risk, and you should consult with a qualified financial advisor before making any investment decisions. Past performance is not indicative of future results.
CryptoChartDaily
سقوط ۸۰ درصدی PLUME: آیا زمان بازگشت و سبزشدن فرا رسیده است؟
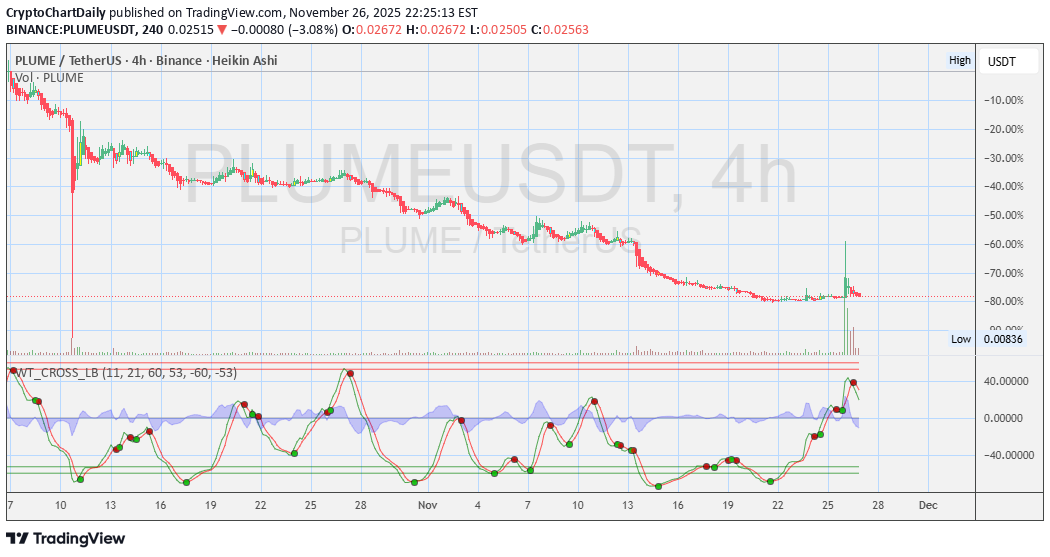
🧠 Keep it on watch. Momentum shifting. Any Opinions on HUGE VOLUME Yesterday? Time for see some green candles? Uptrend? or? Lets share any opinions ⚠️ Disclosures : This analysis is for informational purposes only and is not financial advice. It does not constitute a recommendation to buy, sell, or trade any securities, cryptocurrencies, or stocks. Trading involves significant risk, and you should consult with a qualified financial advisor before making any investment decisions. Past performance is not indicative of future results.
CryptoChartDaily
سیگنال تغییر مومنتوم بازار: نمودار روزانه توربو را از دست ندهید!
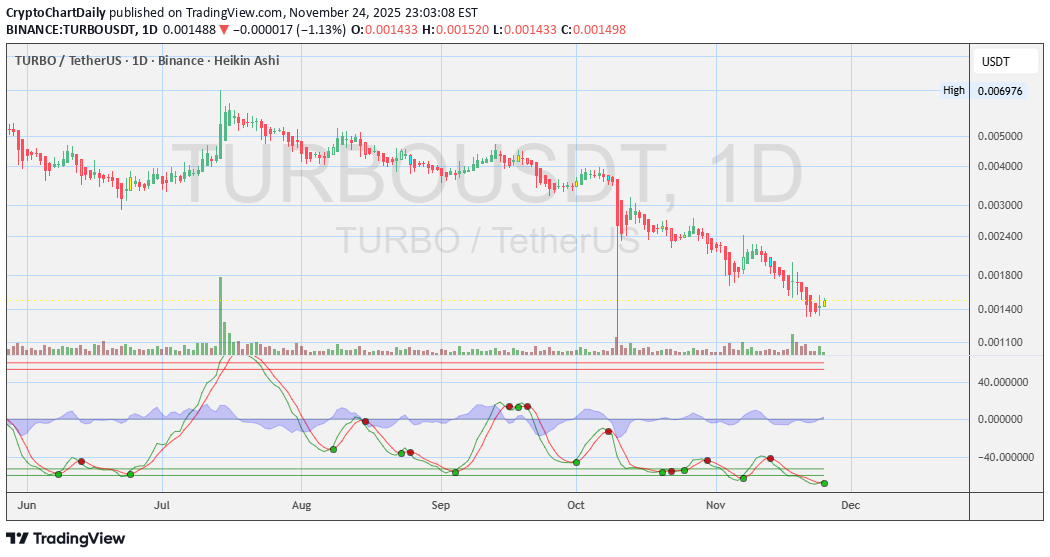
🧠 Keep it on watch. Momentum shifting. 🔥 WT Cross Signal Turning ⚠️ Disclosures: This analysis is for informational purposes only and is not financial advice. It does not constitute a recommendation to buy, sell, or trade any securities, cryptocurrencies, or stocks. Trading involves significant risk, and you should consult with a qualified financial advisor before making any investment decisions. Past performance is not indicative of future results.
CryptoChartDaily
تحلیل روزانه آواکس (AVAX): سیگنالهای مهمی که نباید از دست بدهید!
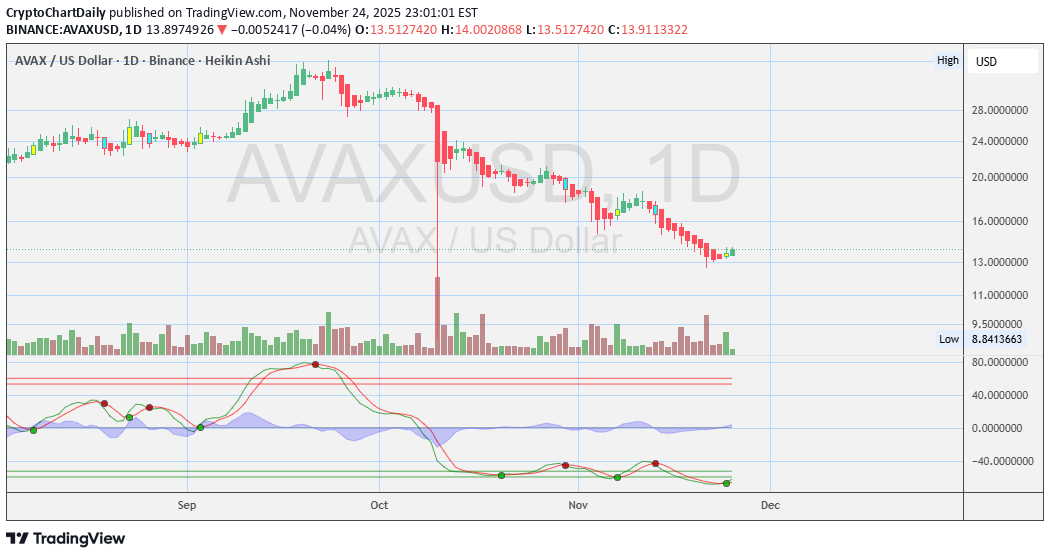
🧠 Keep it on watch. Momentum shifting. 🔥 WT Cross Signal Turning ⚠️ Disclosures: This analysis is for informational purposes only and is not financial advice. It does not constitute a recommendation to buy, sell, or trade any securities, cryptocurrencies, or stocks. Trading involves significant risk, and you should consult with a qualified financial advisor before making any investment decisions. Past performance is not indicative of future results.
CryptoChartDaily
تحلیل روزانه نمودار پلوم (PLUME): آیا زمان ورود فرا رسیده است؟
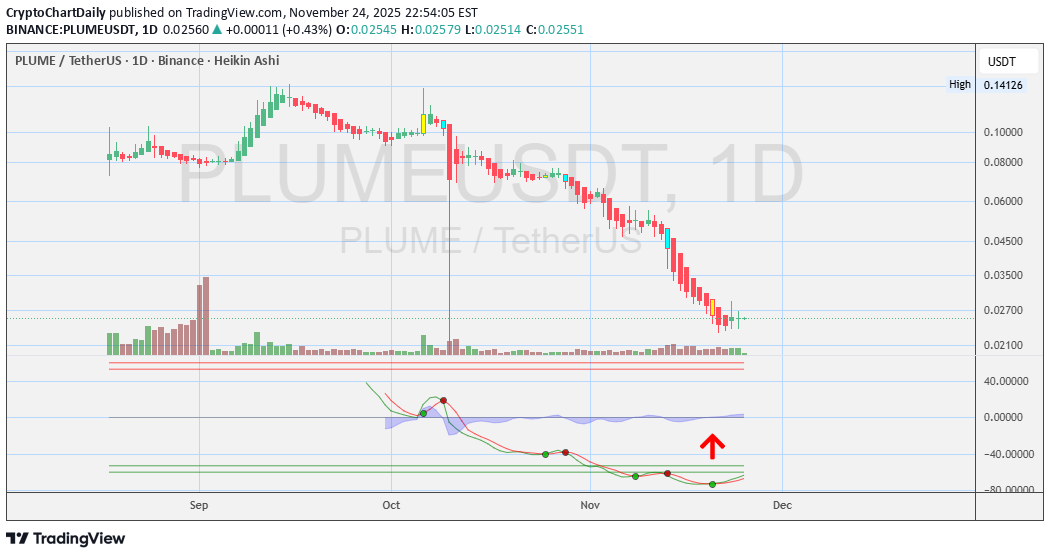
🧠 Keep it on watch. Momentum shifting. 🔥 WT Cross Signal Turning ⚠️ Disclosures : This analysis is for informational purposes only and is not financial advice. It does not constitute a recommendation to buy, sell, or trade any securities, cryptocurrencies, or stocks. Trading involves significant risk, and you should consult with a qualified financial advisor before making any investment decisions. Past performance is not indicative of future results.
CryptoChartDaily
شبکه PLUME: تحلیل ۳ ساعته و نشانه تغییر مومنتوم (هشدار سرمایهگذاری!)
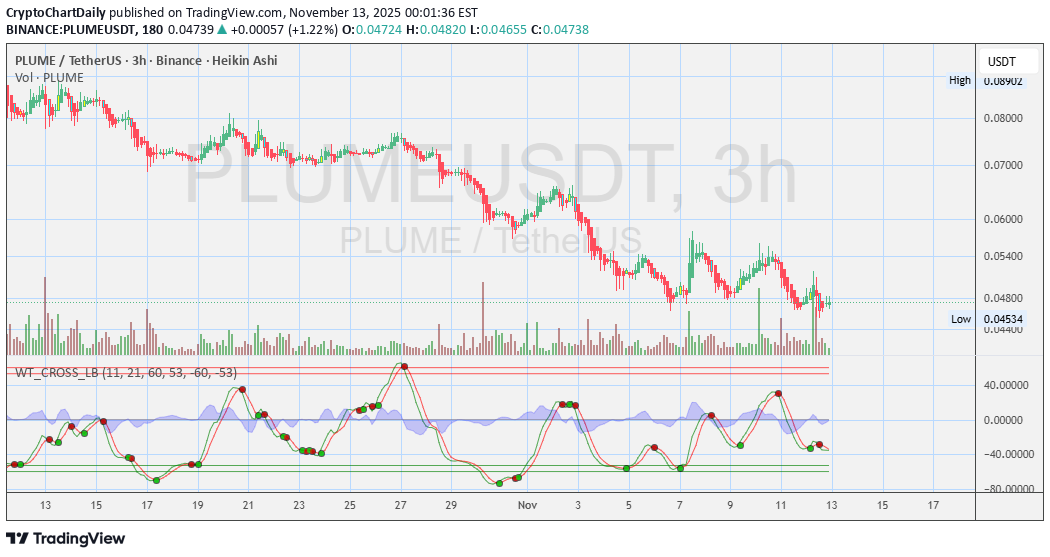
🧠 Keep it on watch. Momentum shifting. ⚠️ Disclosures : This analysis is for informational purposes only and is not financial advice. It does not constitute a recommendation to buy, sell, or trade any securities, cryptocurrencies, or stocks. Trading involves significant risk, and you should consult with a qualified financial advisor before making any investment decisions. Past performance is not indicative of future results.
CryptoChartDaily
تحلیل فوری بیت کوین (BTC): آیا زمان تغییر روند فرا رسیده است؟
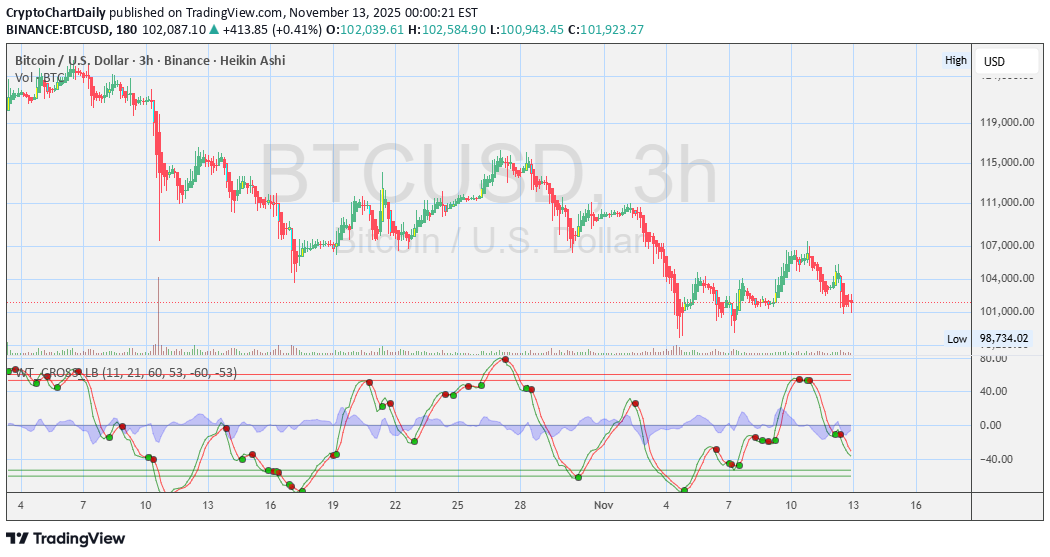
🧠 Keep it on watch. Momentum shifting. ⚠️ Disclosures : This analysis is for informational purposes only and is not financial advice. It does not constitute a recommendation to buy, sell, or trade any securities, cryptocurrencies, or stocks. Trading involves significant risk, and you should consult with a qualified financial advisor before making any investment decisions. Past performance is not indicative of future results.
CryptoChartDaily
تحلیل نمودار توربو (TURBO) پس از 3 ساعت: آیا زمان خرید یا فروش است؟
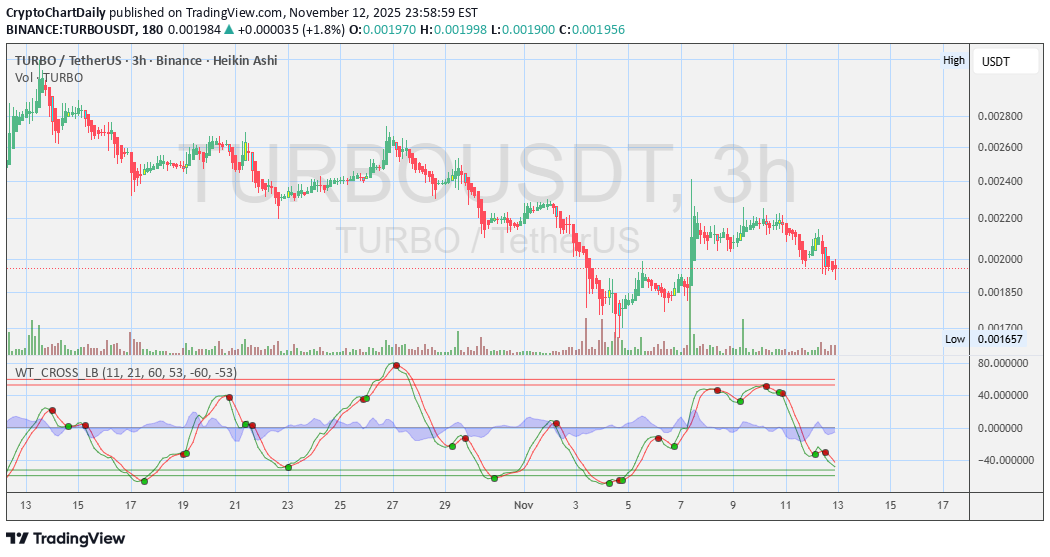
🧠 Keep it on watch. Momentum shifting. ⚠️ Disclosures : This analysis is for informational purposes only and is not financial advice. It does not constitute a recommendation to buy, sell, or trade any securities, cryptocurrencies, or stocks. Trading involves significant risk, and you should consult with a qualified financial advisor before making any investment decisions. Past performance is not indicative of future results.
Disclaimer
Any content and materials included in Sahmeto's website and official communication channels are a compilation of personal opinions and analyses and are not binding. They do not constitute any recommendation for buying, selling, entering or exiting the stock market and cryptocurrency market. Also, all news and analyses included in the website and channels are merely republished information from official and unofficial domestic and foreign sources, and it is obvious that users of the said content are responsible for following up and ensuring the authenticity and accuracy of the materials. Therefore, while disclaiming responsibility, it is declared that the responsibility for any decision-making, action, and potential profit and loss in the capital market and cryptocurrency market lies with the trader.