
ZIL
Zilliqa
| تریدر | نوع سیگنال | حد سود/ضرر | زمان انتشار | مشاهده پیام |
|---|---|---|---|---|
 CryptoCoinsCoachRank: 14705 | خرید | حد سود: تعیین نشده حد ضرر: تعیین نشده | 11/30/2025 |
Price Chart of Zilliqa
سود 3 Months :
سیگنالهای Zilliqa
Filter
Sort messages by
Trader Type
Time Frame

CryptoAnalystSignal
#ZIL/USDT Descending channel ?

#ZIL The price is moving in a descending channel on the 1-hour timeframe. It has reached the lower boundary and is heading towards breaking above it, with a retest of the upper boundary expected. We have a downtrend on the RSI indicator, which has reached near the lower boundary, and an upward rebound is expected. There is a key support zone in green at 0.00470. The price has bounced from this zone multiple times and is expected to bounce again. We have a trend towards consolidation above the 100-period moving average, as we are moving close to it, which supports the upward movement. Entry price: 0.00486 First target: 0.00494 Second target: 0.00504 Third target: 0.00515 Stop loss: Below the support zone in green. Don't forget a simple thing: capital management. For inquiries, please leave a comment. Thank you.#ZIL First target: 0.00494 Reached Second target: 0.00504 Reached Third target: 0.00515 Reached
CryptoAnalystSignal
#ZIL/USDT Descending channel ?
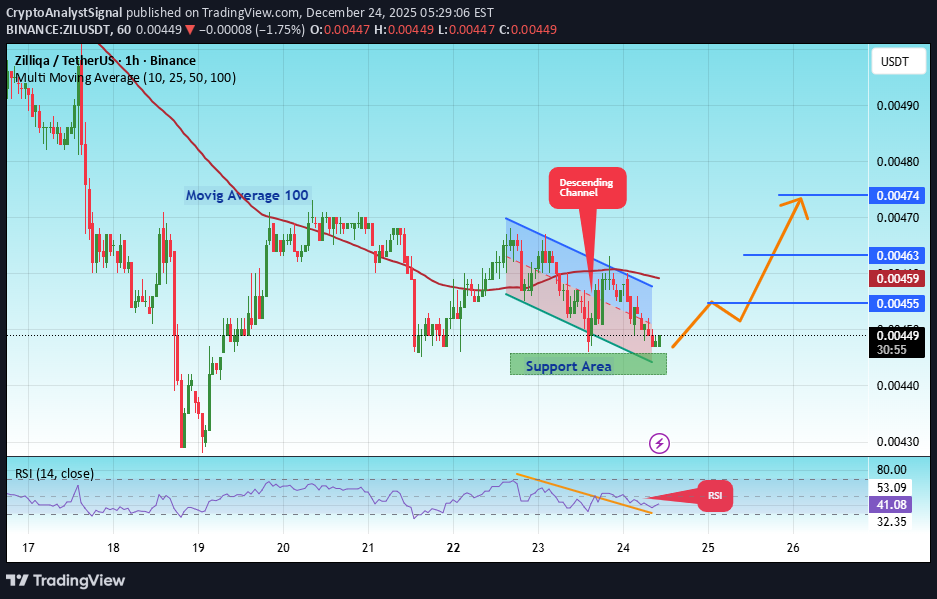
#ZIL The price is moving in a descending channel on the 1-hour timeframe. It has reached the lower boundary and is heading towards breaking above it, with a retest of the upper boundary expected. We have a downtrend on the RSI indicator, which has reached near the lower boundary, and an upward rebound is expected. There is a key support zone in green at 0.00444. The price has bounced from this zone multiple times and is expected to bounce again. We have a trend towards consolidation above the 100-period moving average, as we are moving close to it, which supports the upward movement. Entry price: 0.00449 First target: 0.00455 Second target: 0.00463 Third target: 0.00474 Don't forget a simple principle: money management. Place your stop-loss order below the green support zone. For any questions, please leave a comment. Thank you.#ZIL First target: 0.00455 Reached Second target: 0.00463 Reached Third target: 0.00474 Reached
CryptoCoinsCoach
سقوط ZIL تمام شد؟ یک شکست همه چیز را عوض میکند!
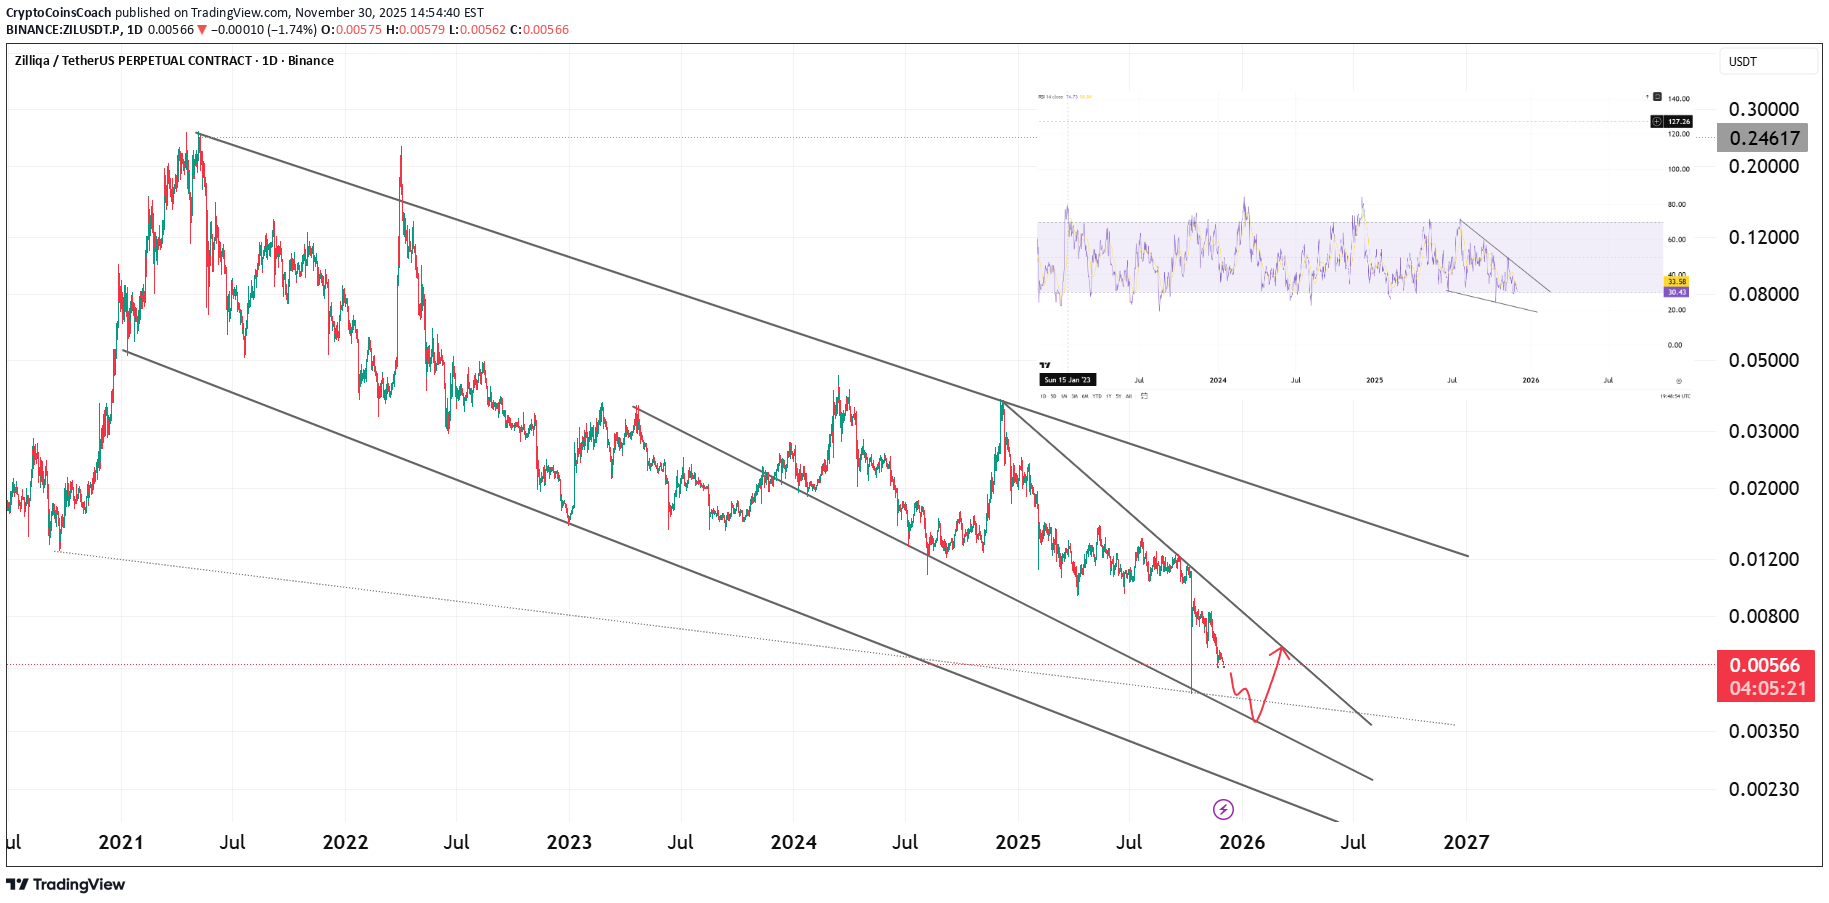
ZIL is currently trading inside a large multi-year falling channel, with price pressing into the lower boundary of the structure. This zone has historically acted as a major cycle low for ZIL, and the current reaction aligns with the broader pattern of diminishing volatility and trend exhaustion. Price recently tapped the lower support line of the macro channel while the RSI is showing a tightening descending structure. This combination often signals weakening bearish momentum and an upcoming trend shift once a breakout occurs. The market remains under pressure as long as ZIL stays inside the falling channel. However, the structure shows the early signs of accumulation, especially when price trades at the channel’s extreme lows and begins producing shorter bearish legs. Key technical notes: • Price is reaching the macro channel demand • RSI showing a compressed descending wedge hinting at potential reversal • Market sentiment still bearish, but structure supports trend exhaustion • A reclaim of the mid-channel would strengthen the bullish shift • Downside liquidity sweeps are still possible before a breakout Main scenario: ZIL may take one final liquidity dip into the channel floor before forming a reversal structure. If price then reclaims the mid-range and breaks the descending trendline, the next major bullish leg can begin with significant upside potential. Invalidation: A clean breakdown below the channel floor with continuation would invalidate the reversal scenario and extend the bearish cycle. In simple terms: ZIL is sitting at the extreme low of a multi-year falling channel. RSI is tightening. If ZIL breaks out of the descending structure, a macro trend reversal becomes likely. Until then, expect volatility and liquidity sweeps.
CryptoAnalystSignal
پیشبینی انفجار زل (ZIL): شکست کانال نزولی و اهداف صعودی جدید!
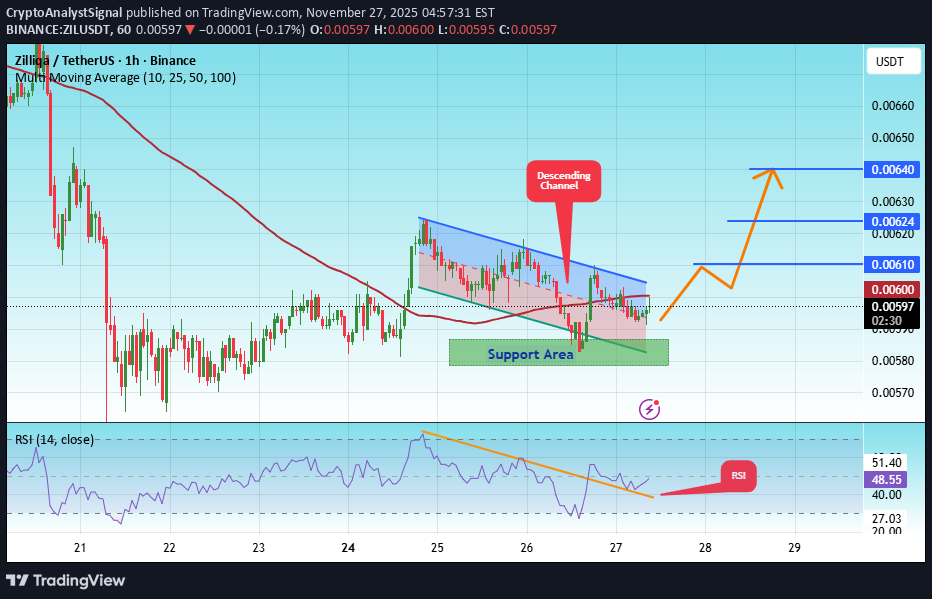
#ZIL The price is moving in a descending channel on the 1-hour timeframe. It has reached the lower boundary and is heading towards breaking above it, with a retest of the upper boundary expected. We have a downtrend on the RSI indicator, which has reached near the lower boundary, and an upward rebound is expected. There is a key support zone in green at 0.00580. The price has bounced from this zone multiple times and is expected to bounce again. We have a trend towards consolidation above the 100-period moving average, as we are moving close to it, which supports the upward movement. Entry price: 0.00600 First target: 0.00610 Second target: 0.00624 Third target: 0.00640 Don't forget a simple principle: money management. Place your stop-loss below the support zone in green. For any questions, please leave a comment. Thank you.

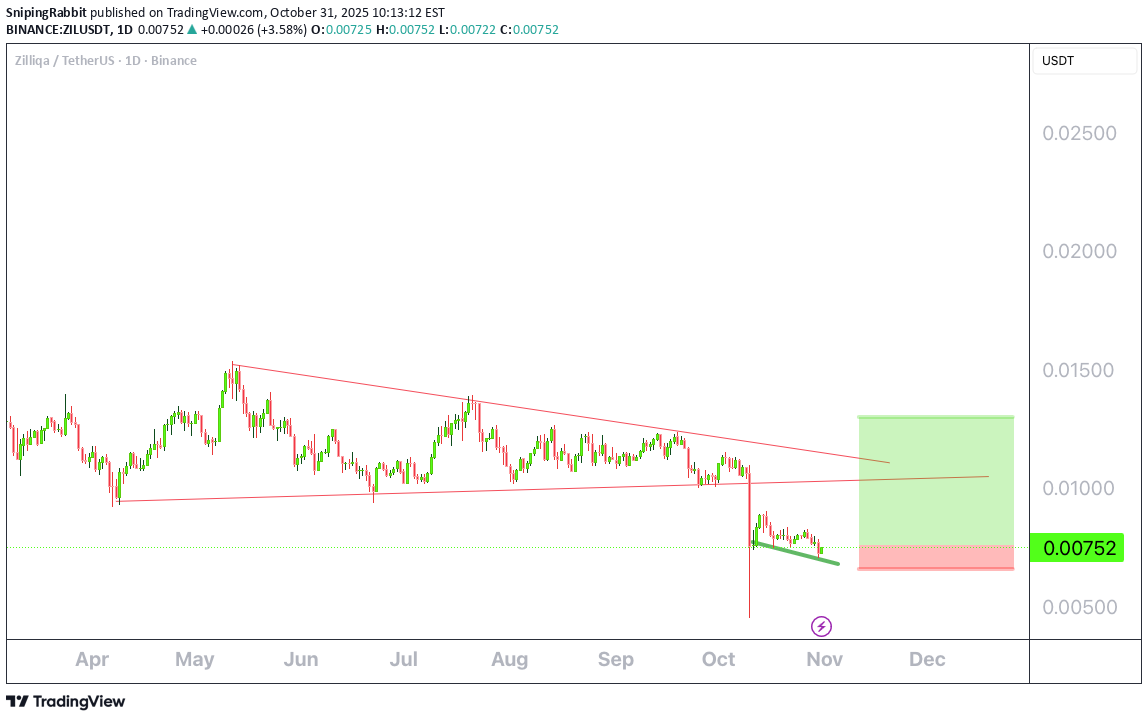
SnipingRabbit
خرید فوری ZIL: فرصتی کوچک با پتانسیل حجم بالا!

Happy Trading!! Happy Trading!! Happy Trading!! Happy Trading!! Happy Trading!! Happy Trading!! Happy Trading!! Happy Trading!! Happy Trading!! Happy Trading!! Happy Trading!! Happy Trading!! Happy Trading!! Happy Trading!! Happy Trading!! Happy Trading!! Happy Trading!! Happy Trading!!
CryptoAnalystSignal
تحلیل تکنیکال ZIL/USDT: آیا کانال صعودی ادامه مییابد؟ (اهداف و استراتژی ورود)
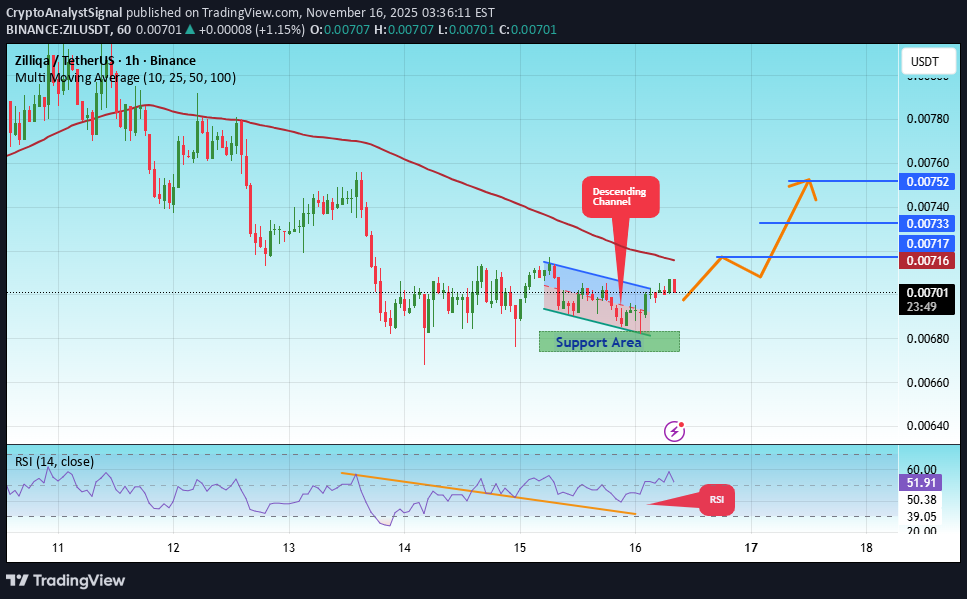
#ZIL The price is moving within an ascending channel on the 1-hour timeframe and is adhering to it well. It is poised to break out strongly and retest the channel. We have a downtrend line on the RSI indicator that is about to break and retest, which supports the upward move. There is a key support zone in green at 0.00680, representing a strong support point. We have a trend of consolidation above the 100-period moving average. Entry price: 0.00703 First target: 0.00717 Second target: 0.00733 Third target: 0.00752 Don't forget a simple money management rule: Place your stop-loss order below the green support zone. Once you reach the first target, save some money and then change your stop-loss order to an entry order. For any questions, please leave a comment. Thank you.

بیت کوین 1G: جهش قیمتی خیرهکننده در سال 2024! (یادآوری: سرمایهگذاری ریسک دارد)
https://www.tradingview.com/x/AbVGqmFh Bitcoin 1G It is not investment advice.

DragonCaoB
خرید پرقدرت ZIL: سیگنال صعودی قوی پس از شکست مثلث!
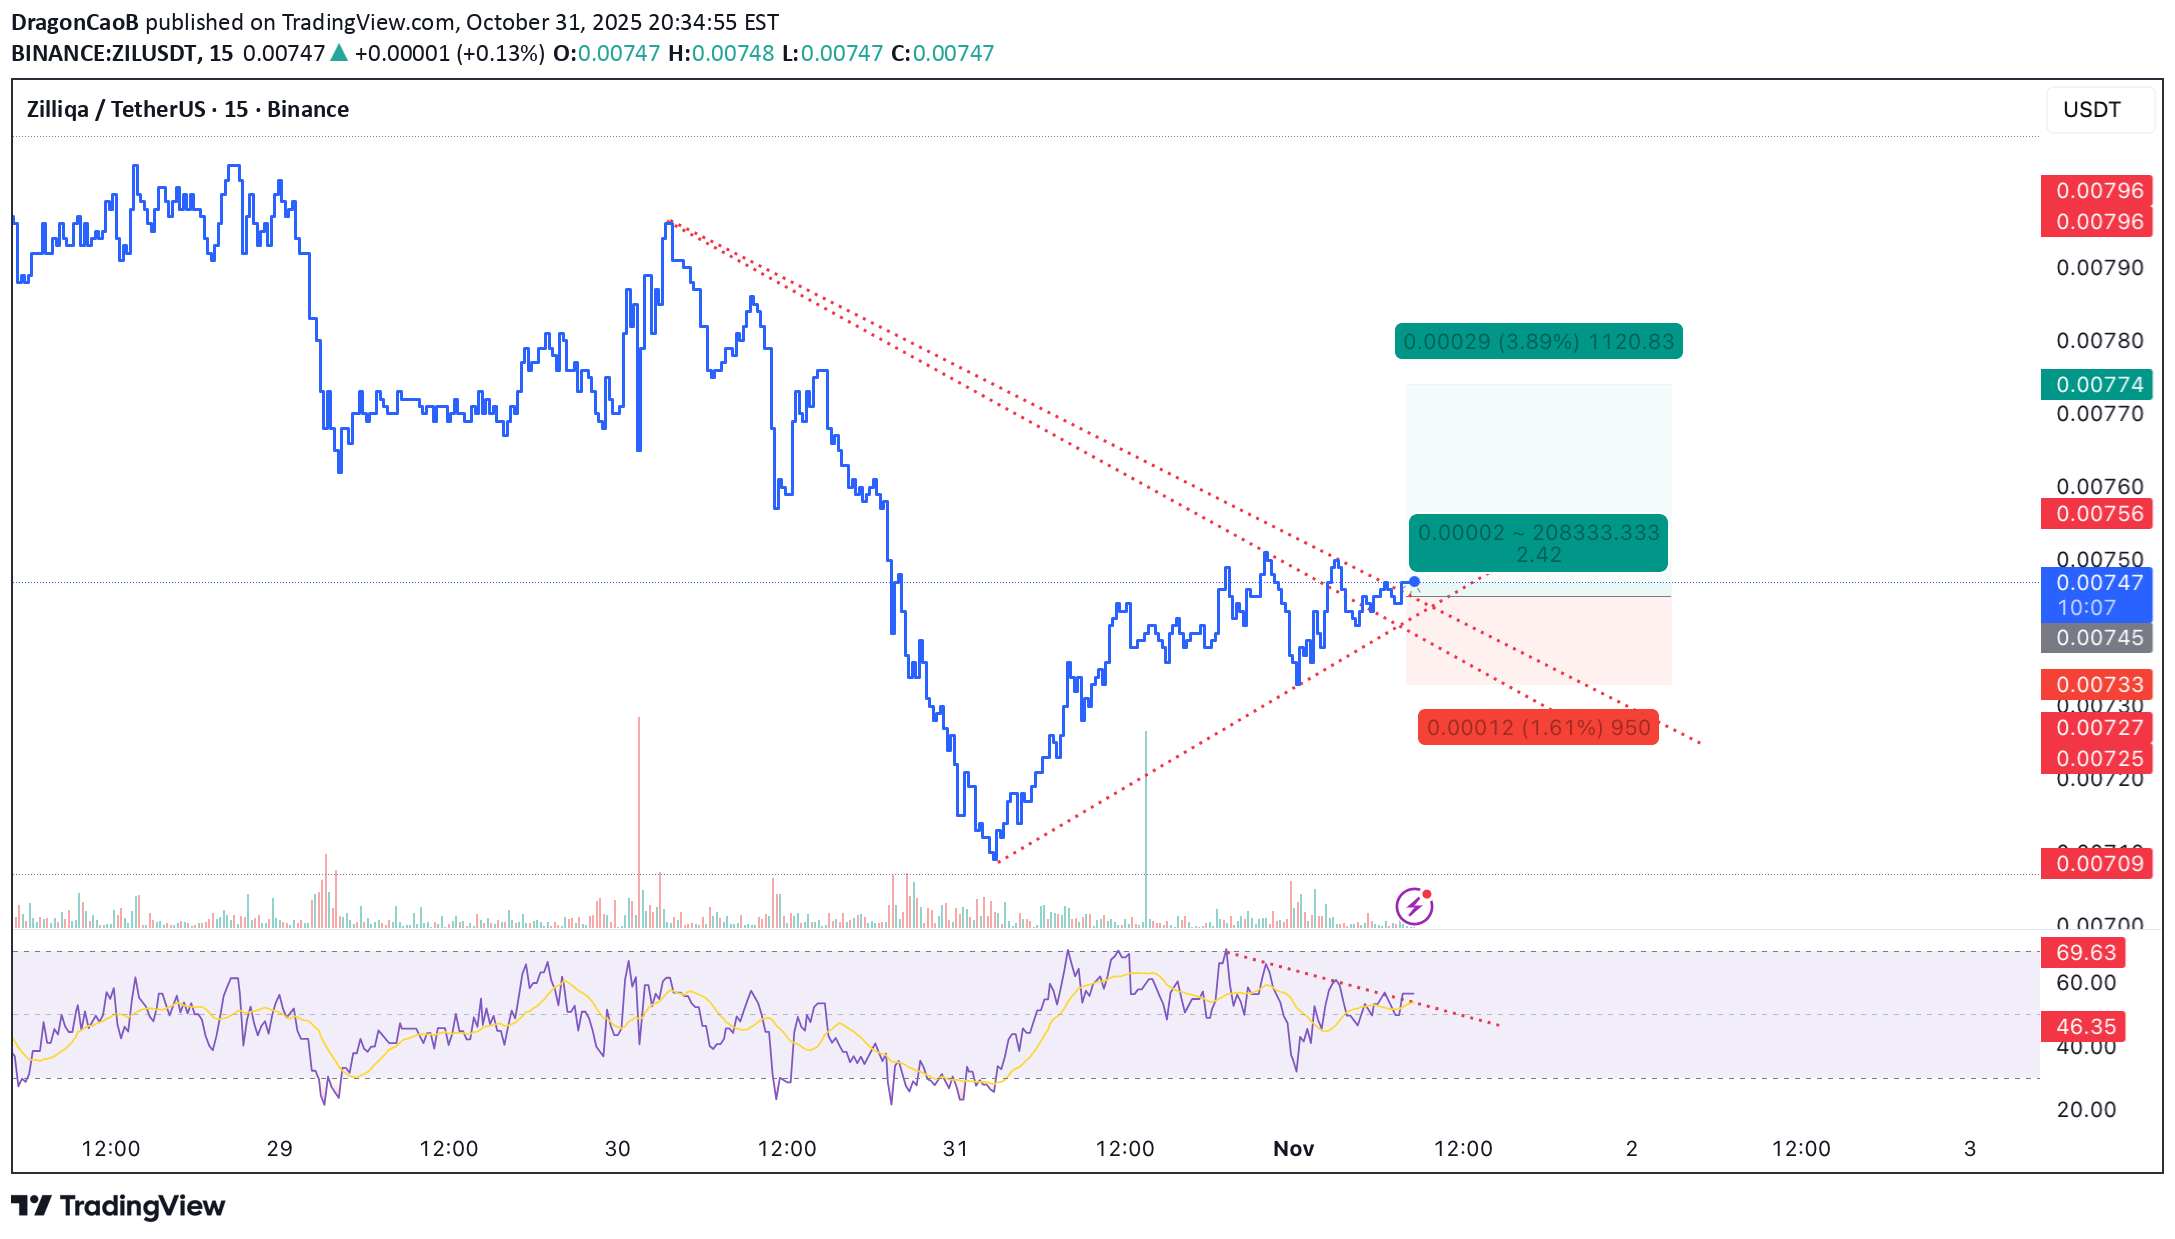
💎 Scalp Long – ZIL RSI has broken out of its downtrend, and price has broken above the triangle pattern, signaling a clear bullish shift. Buying volume is surging, confirming strong momentum behind the move. 🎯 Plan: → Enter after confirmation of breakout retest. → TP: 0.00774 | SL: 0.00733 | RR: 1 : 2.42 Momentum supports the long setup. Keep entries clean, trail SL as price advances. Stay patient — act only on confirmed breakout strength.
SnipingRabbit
فرصت خرید زنده پول (ZIL) با پتانسیل انفجاری؛ آیا قیمت دوباره اوج میگیرد؟
SnipingRabbit Crashed zil with a 1.5 million dollar position a few years back buy now looking for the crypto to rebound! Happy Trading! Happy Trading! Happy Trading! Happy Trading! Happy Trading! Happy Trading! Happy Trading!
cryptosignalpnl
انفجار صعودی قریبالوقوع ZIL/USDT: منتظر شکست بزرگ در فیوچرز باشید!
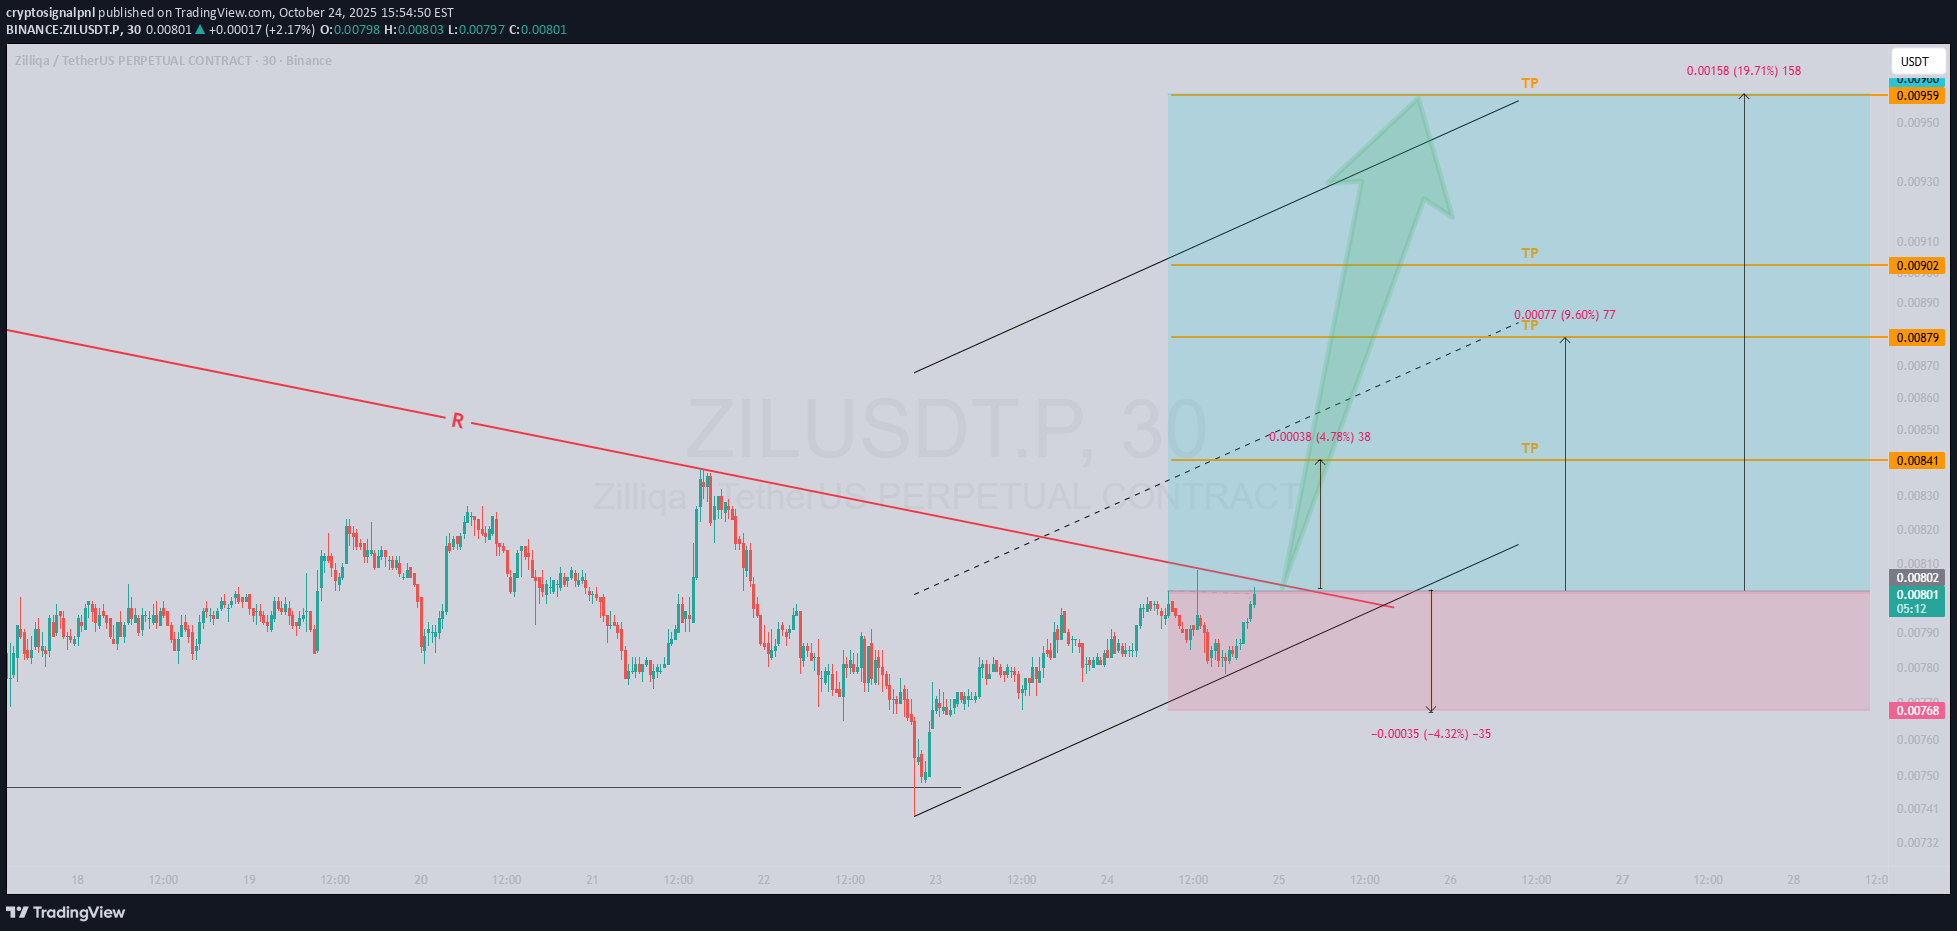
🚀 ZIL/USDT Futures: Primed for a Bullish Breakout Explosion! 🚀 Traders, get hyped! 🔥 This killer setup on Z ZIL/USDT Perpetual Futures is locked in on the 30-minute timeframe, where price is coiling tight against a descending trendline, building massive pressure for an upside breakout. We're on the edge of our seats waiting for that clean snap above the trendline – and when it happens (as we're betting it will), it's game on for some serious gains! 📈 📊 Setup Scoop: Timeframe: 30-minute – perfect for spotting this compression play. Key Action: Price hugging the descending trendline, ready to burst upward. Breakout confirmation = green light for entry! Profit Potential: Without leverage, we're eyeing at least 4% upside, with room to rocket up to 19%. Throw in leverage, and those returns could skyrocket – talk about multiplying your wins! 💥 This setup screams opportunity in the volatile world of ZIL – don't blink, or you might miss the launch! ⚠️ Disclaimer: Not financial advice – always DYOR and trade smart. Crypto's a wild ride, so manage your risk like a pro! 🚀 Epic Analysis + Signals? Follow NOW! ✅ 📊 Craving a Golden Chart? Smash BOOST! ✅ 💬 Got ideas? Drop a COMMENT – we reply to the best! ✅ Follow = Profits | Boost = Gold Chart | Comment = VIP Access! 😎stop reached
Disclaimer
Any content and materials included in Sahmeto's website and official communication channels are a compilation of personal opinions and analyses and are not binding. They do not constitute any recommendation for buying, selling, entering or exiting the stock market and cryptocurrency market. Also, all news and analyses included in the website and channels are merely republished information from official and unofficial domestic and foreign sources, and it is obvious that users of the said content are responsible for following up and ensuring the authenticity and accuracy of the materials. Therefore, while disclaiming responsibility, it is declared that the responsibility for any decision-making, action, and potential profit and loss in the capital market and cryptocurrency market lies with the trader.