
ZEC
Zcash
| تریدر | نوع سیگنال | حد سود/ضرر | زمان انتشار | مشاهده پیام |
|---|---|---|---|---|
 TheCoinCowboyRank: 232 | فروش | حد سود: تعیین نشده حد ضرر: تعیین نشده | 9 hour ago | |
 ReallifetradingRank: 348 | فروش | حد سود: تعیین نشده حد ضرر: تعیین نشده | 11/21/2025 | |
 NancyPelosisRank: 3103 | خرید | حد سود: تعیین نشده حد ضرر: تعیین نشده | 9 hour ago | |
 FahadafzalRank: 17238 | فروش | حد سود: تعیین نشده حد ضرر: تعیین نشده | 15 hour ago | |
فروش | حد سود: تعیین نشده حد ضرر: تعیین نشده | 11/21/2025 |

Price Chart of Zcash
سود 3 Months :
سیگنالهای Zcash
Filter
Sort messages by
Trader Type
Time Frame
TheCoinCowboy
۷ دلیل هشدار دهنده: زِک (ZEC) در آستانه سقوط آزاد به زیر ۳۰۰ دلار!
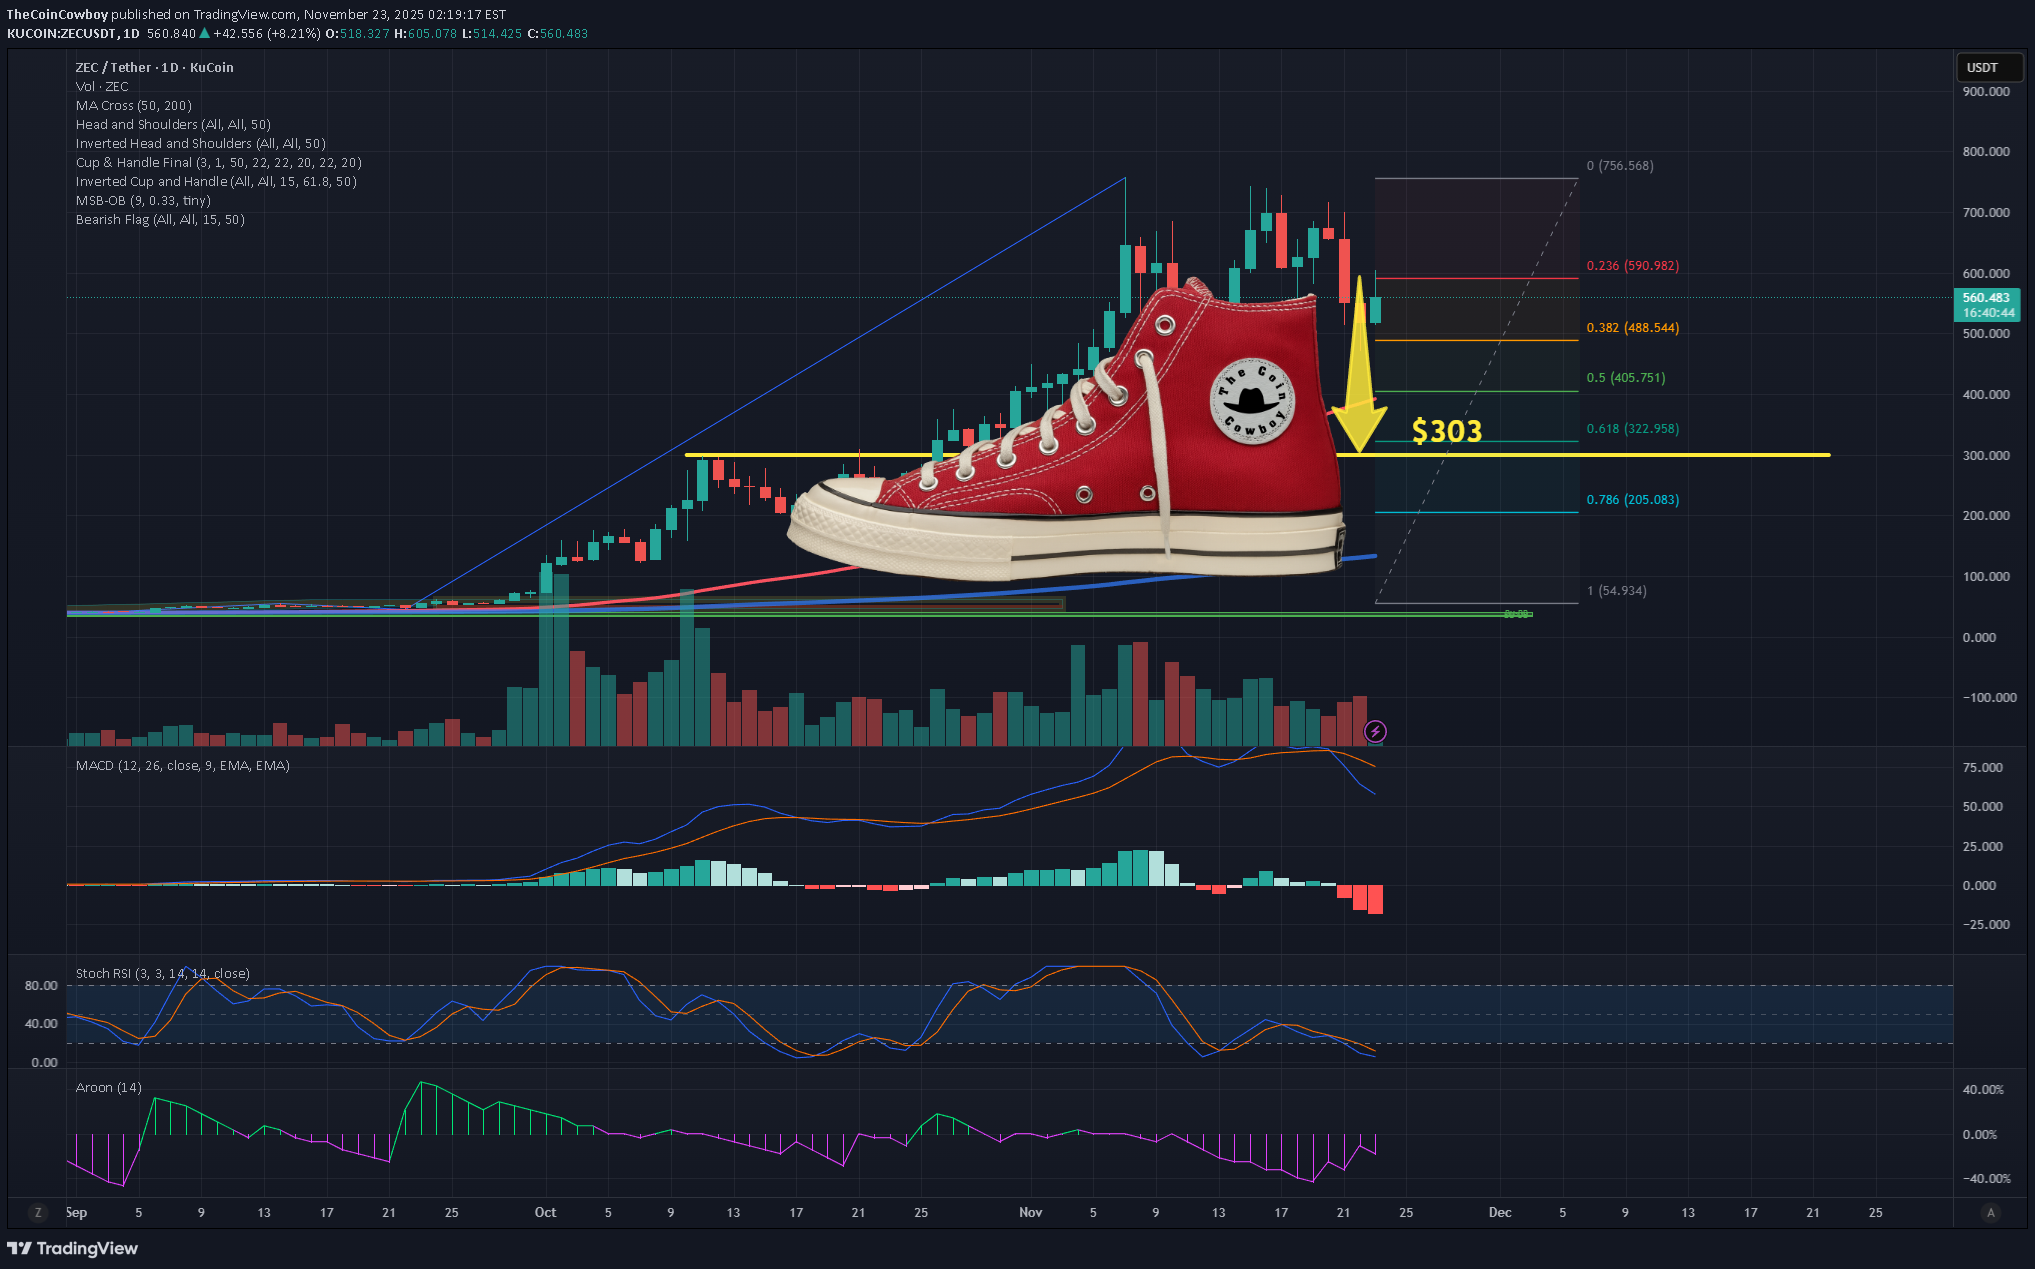
My 7 reasons why ZEC is about to drop to the heel of the shoe. 1. Price Rejected Hard at the 0.236 Fibonacci Level The recent top at $752 Strong rejection at $582 (0.236 level) Price tried to reclaim 0.236 multiple times and failed, which signals: The bullish trend has lost strength and a deeper retracement is likely. In most parabolic assets, 0.236 → 0.382 → 0.618 is the natural sequence when momentum dies. ZEC already hit 0.382 around $476, and bounced weakly. Next logical magnet is 0.618 = $306. 2. The $548 Horizontal Level Was Lost (Key Breakdown) $548 was: former support former demand zone heavy volume node (visible on histogram) Price closed below it, which makes it broken support → new resistance Losing this floor confirms that buyers couldn’t defend the mid-range. When a mid-range collapses, price usually moves to the next major liquidity pool, which here is: 👉 0.618 Fib at $306 👉 200MA cluster between $380–$400 3. Volume Profile Shows a Gap Below $480 Volume bars reveal high trading activity between $540–$620 A void / low-volume area between $470 → $380 Markets tend to fill low-volume gaps quickly because: There is little historical demand to slow price down This means once $480 breaks convincingly, price can accelerate rapidly toward: 📌 $380–$400 📌 $305–$330 4. MACD Bearish Cross With Increasing Bearish Momentum MACD shows: MACD line crossing below signal line Histogram printing deeper red bars MACD approaching the zero line A MACD cross this high up (after a parabolic run) is dangerous When MACD crosses down after a blow-off top, the retrace is usually 50–70%. That places ZEC’s ideal retrace zone between: 0.5 Fib → $391 0.618 Fib → $306 Again, pointing toward the $300 range 5. Stochastic RSI Bottoming? Not Yet — Could Stay Oversold in a Downtrend Stoch RSI is oversold, but this is misleading because: In downtrends, Stoch RSI can remain pinned down while price continues falling. This happens during macro trend reversals. Oversold Stoch does not mean reversal—it often means continuation. 6. Aroon Indicator Shows Strong Downtrend Confirmation Aroon indicator is down (purple) is dominating Aroon Up (green) is completely suppressed This means trend strength = bearish Aroon tends to be a leading indicator, so with this reading: Trend is already confirmed bearish. More downside is expected. 7. Market Structure: Lower Highs + Breakdown of Rising Structure The chart clearly shows: A lower high after the top (not a good sign) Breakdown of the parabolic rising wedge Failed retest zone around $600 Candle spreads widening on down moves (increasing sell pressure) All of that is consistent with a distribution pattern after a massive run Once distribution completes, assets typically retrace to: 📌 0.618 or 📌 the base of the breakout structure The base of ZEC’s breakout... → $300–$350 area
NancyPelosis
خیز بلند زِدکوین (ZEC): فرصت خرید طلایی پس از نقدینگیگیری در ۶۰۵!
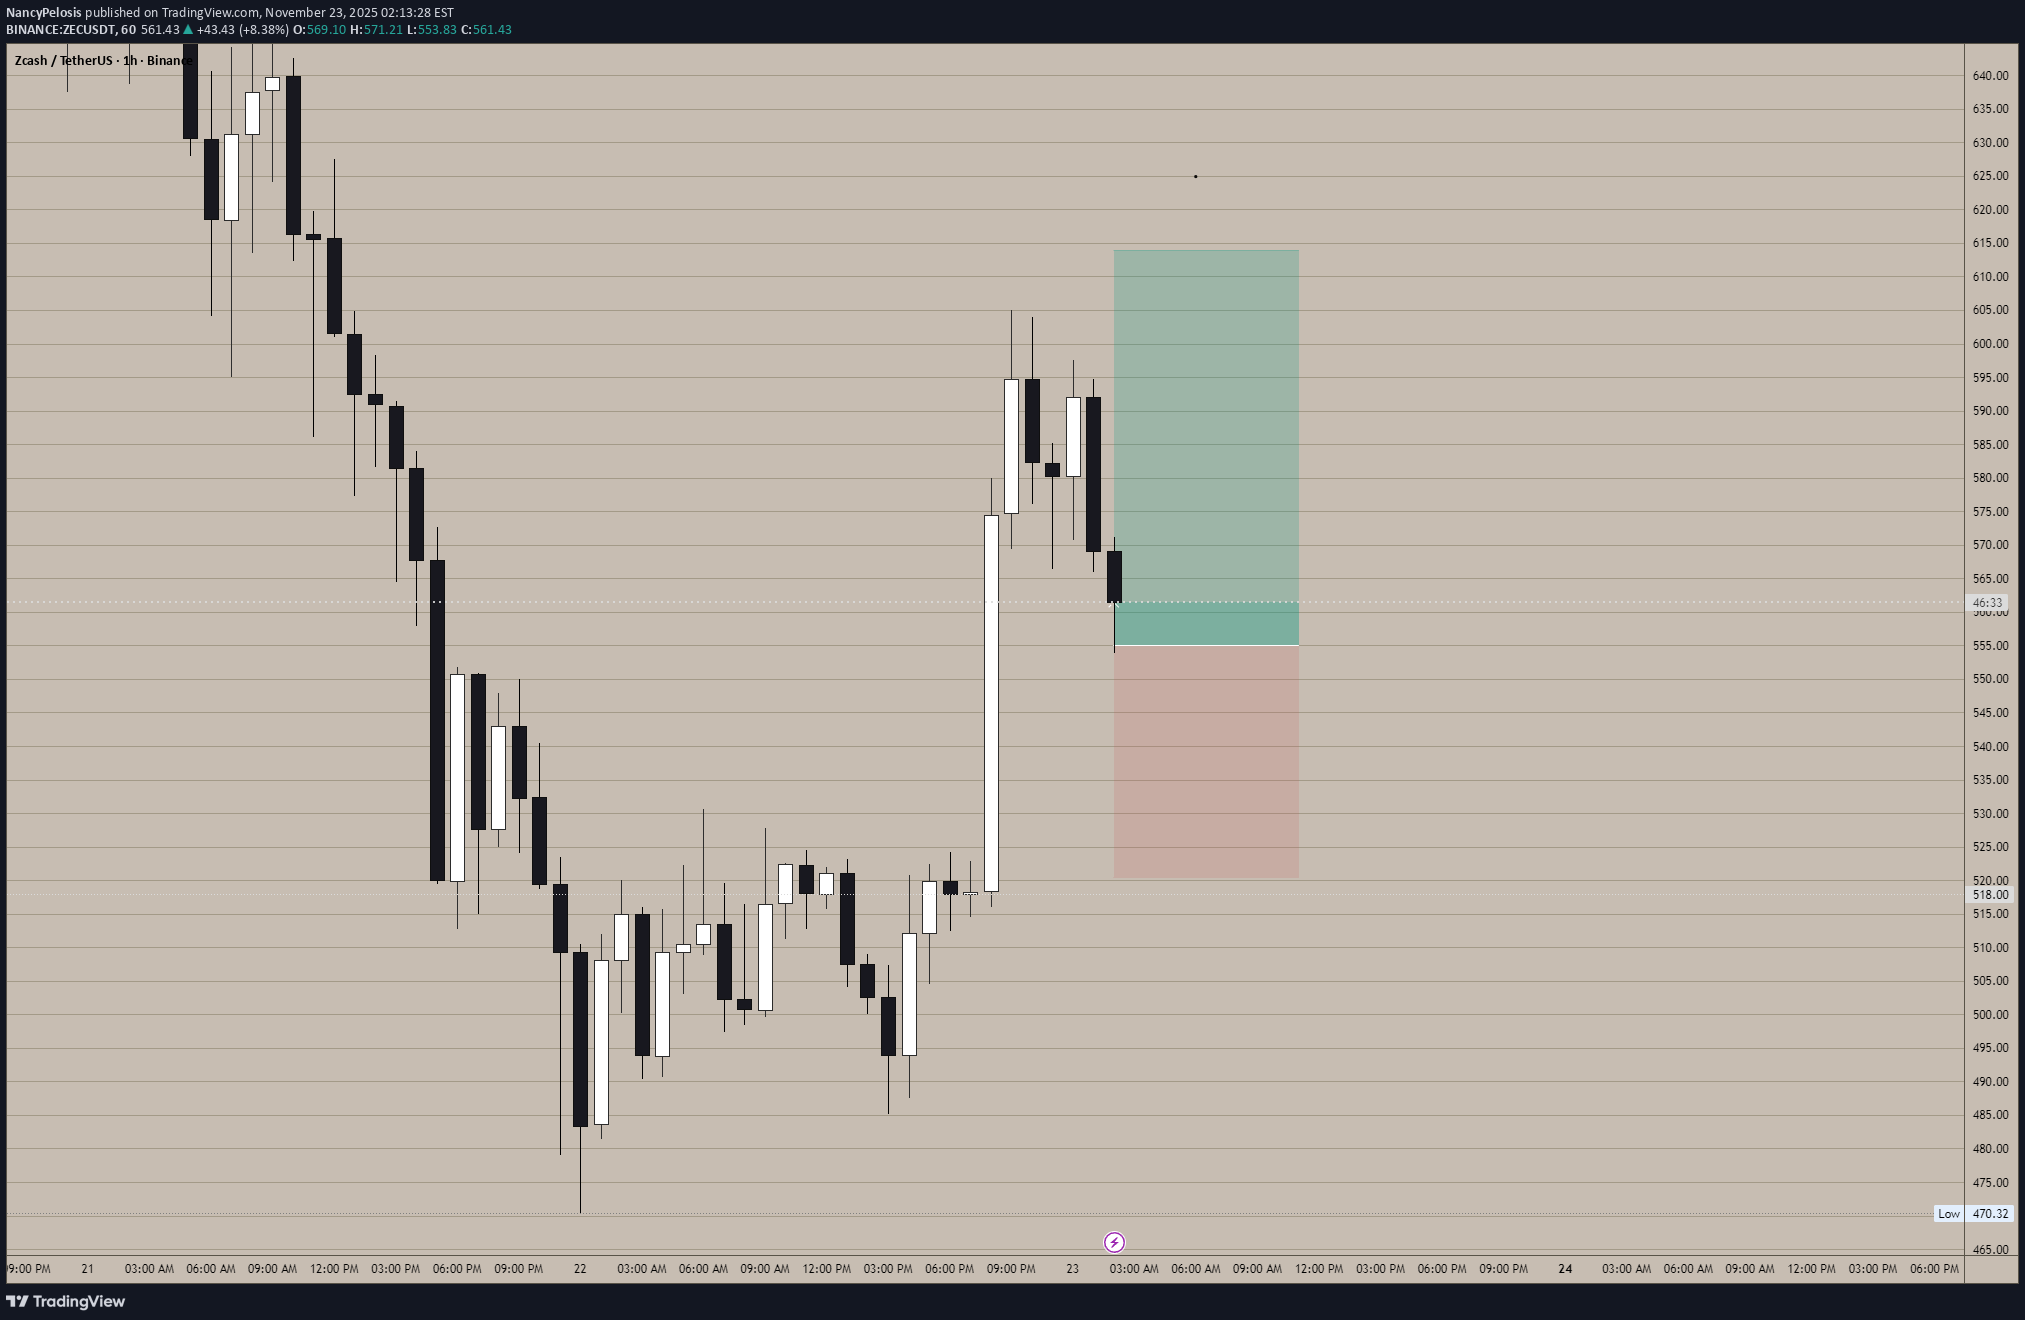
ZEC just swept liquidity at 605 and left a massive imbalance the next high-probability long is the retrace into 550–538 with continuation targets 578 → 600 → 615

melikatrader94
تحلیل ZEC/USDT: آیا سر و شانه معکوس شکسته میشود؟ سطوح حیاتی حمایت و مقاومت!
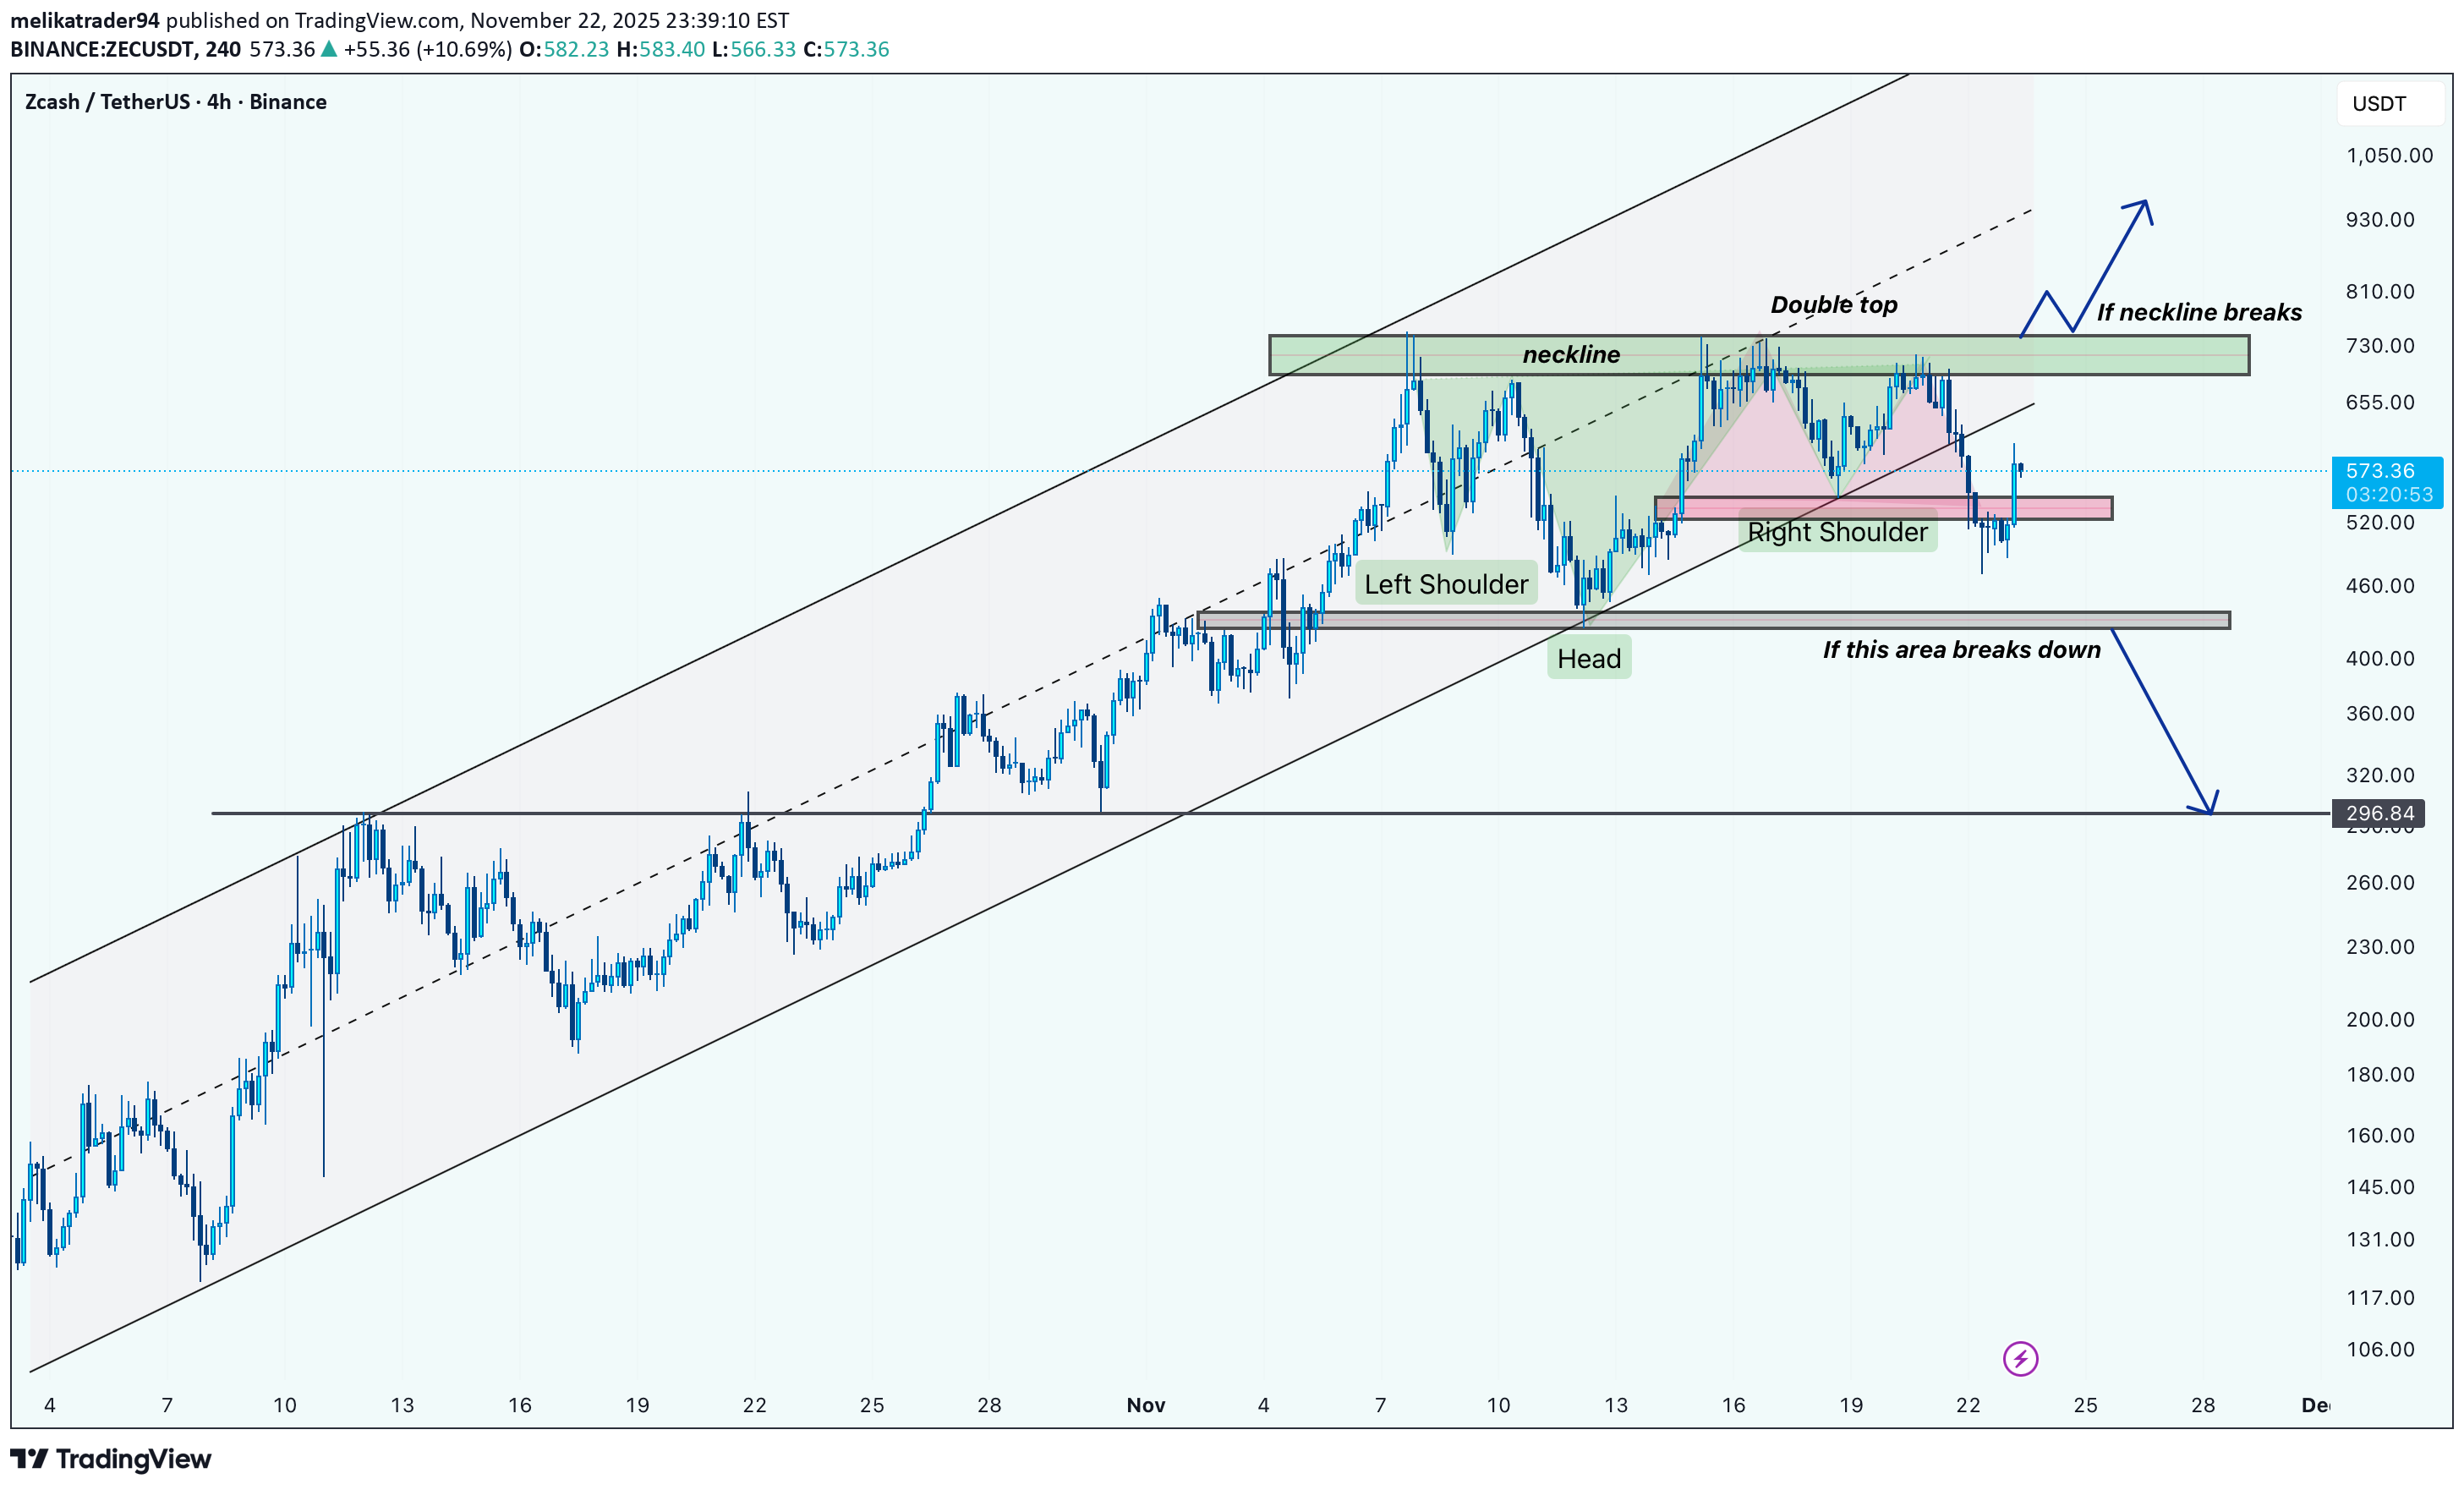
Hi! Pattern Structure Price has developed a clear inverse Head & Shoulders formation inside a long-term ascending channel. Neckline sits in the $640–$720 supply zone, which overlaps with a double-top region. Trend Context Despite being in a broader ascending channel since early November, the right shoulder rejection and break below the minor trendline indicate weakening bullish momentum. Critical Levels Neckline / Double-Top Resistance: $640–$720 Local Support: $505–$520 Major Support Zone: $440–$460 Final Support: $296–$310 (high-timeframe demand) Bearish Scenario If the $505–$520 zone breaks decisively, the next downside target becomes the $440–$460 demand zone. A further breakdown opens the door toward $296–$310, the next major structural support. Bullish Scenario If buyers reclaim the neckline area ($640–$720) with strong momentum, the pattern invalidates and the move toward $800+ becomes likely. So if the neckline of the inverse head and shoulders breakout, then get long positions! But if the support zone ($460) breaks down, then focus on shorts!
Fahadafzal
هشدار فروش فوری بیتکوین زِدک (ZEC): فرصت فروش با ریسک کم و سود بالا!


ThePennyMan
پیشبینی انفجاری ZCash: رسیدن به ۹۴۰ دلار یا سقوط آزاد؟

You hear that? The woes and cries of the bullish holders, the victory screeches of the bears? James Wynn basically cackling with laughter 'I told you all it's a manipulated pump it's going to $0' I'm a big fan of this setup here, seems very obvious imo, we might get one last local low to satisfy the micro-count I've got running. Other than that, I think we're about to tear straight to $940 - and that will be our significant top for this run. My confidence on this structure is EXTREMELY high. Utilizing some leverage even, if we get that newer low I will be adding even more size. Very excited to see how this plays out, Happy Holidays :)I want to be very clear, as everyone is rushing to a computer to long zcash - This is definitely a VERY real possibility. I feel very unsatisfied with my micro-count not being satiated. I'm still long and if this happens I'm going to add massively, just a word of caution for those rushing into leverage.

jhonnybrah
ZEC در آستانه انفجار: فرصت خرید نهنگها برای رسیدن به ۱۰۰۰ دلار!
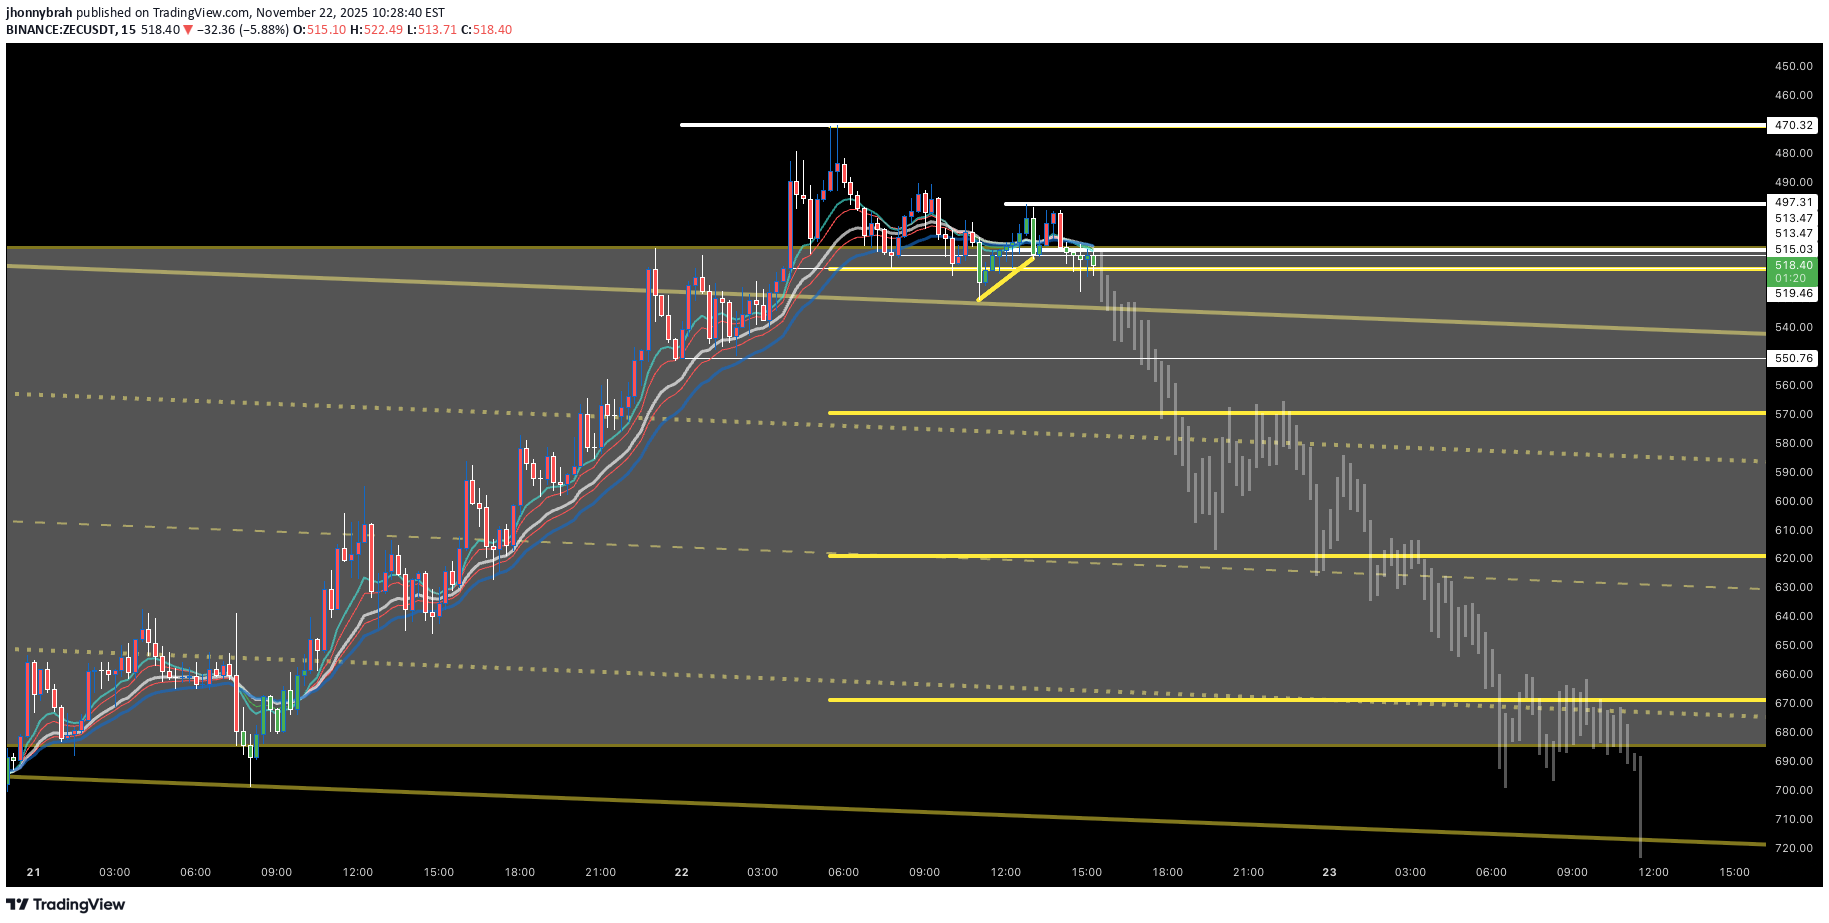
ZEC has been trading rangebound as whales reaccumulate in anticipation of the next leg higher to 1,000 imo. This recent selloff from 700 down to the lower end of the range at 470 creates an opportunity for a trade back up to the highs. Flipped the chart because orientation is irrelevant; it's a trade from one of the range to the other, whether it's top or bottom doesn't make any difference.

زدکش (ZEC) آماده انفجار نهایی؟ سطوح کلیدی برای صعود به بالای ۵۰۰ دلار!

Zcash is showing a structure very similar to Ethereum’s previous macro setup right before its final impulsive rally. Price has tapped into a major demand zone around $500 and is reacting with strength, keeping the overall bullish structure intact. As long as ZEC holds above the $500–$510 support range, the market has the potential to push into a final expansion phase before any deeper correction. 🔹 Key Levels to Watch •Support: $500 – $510 •Invalidation: Break and close below

mehdishirian
تحلیل انفجاری ارز دیجیتال ZEC: سقوط 31 درصدی محقق شد! (آپدیت جدید)
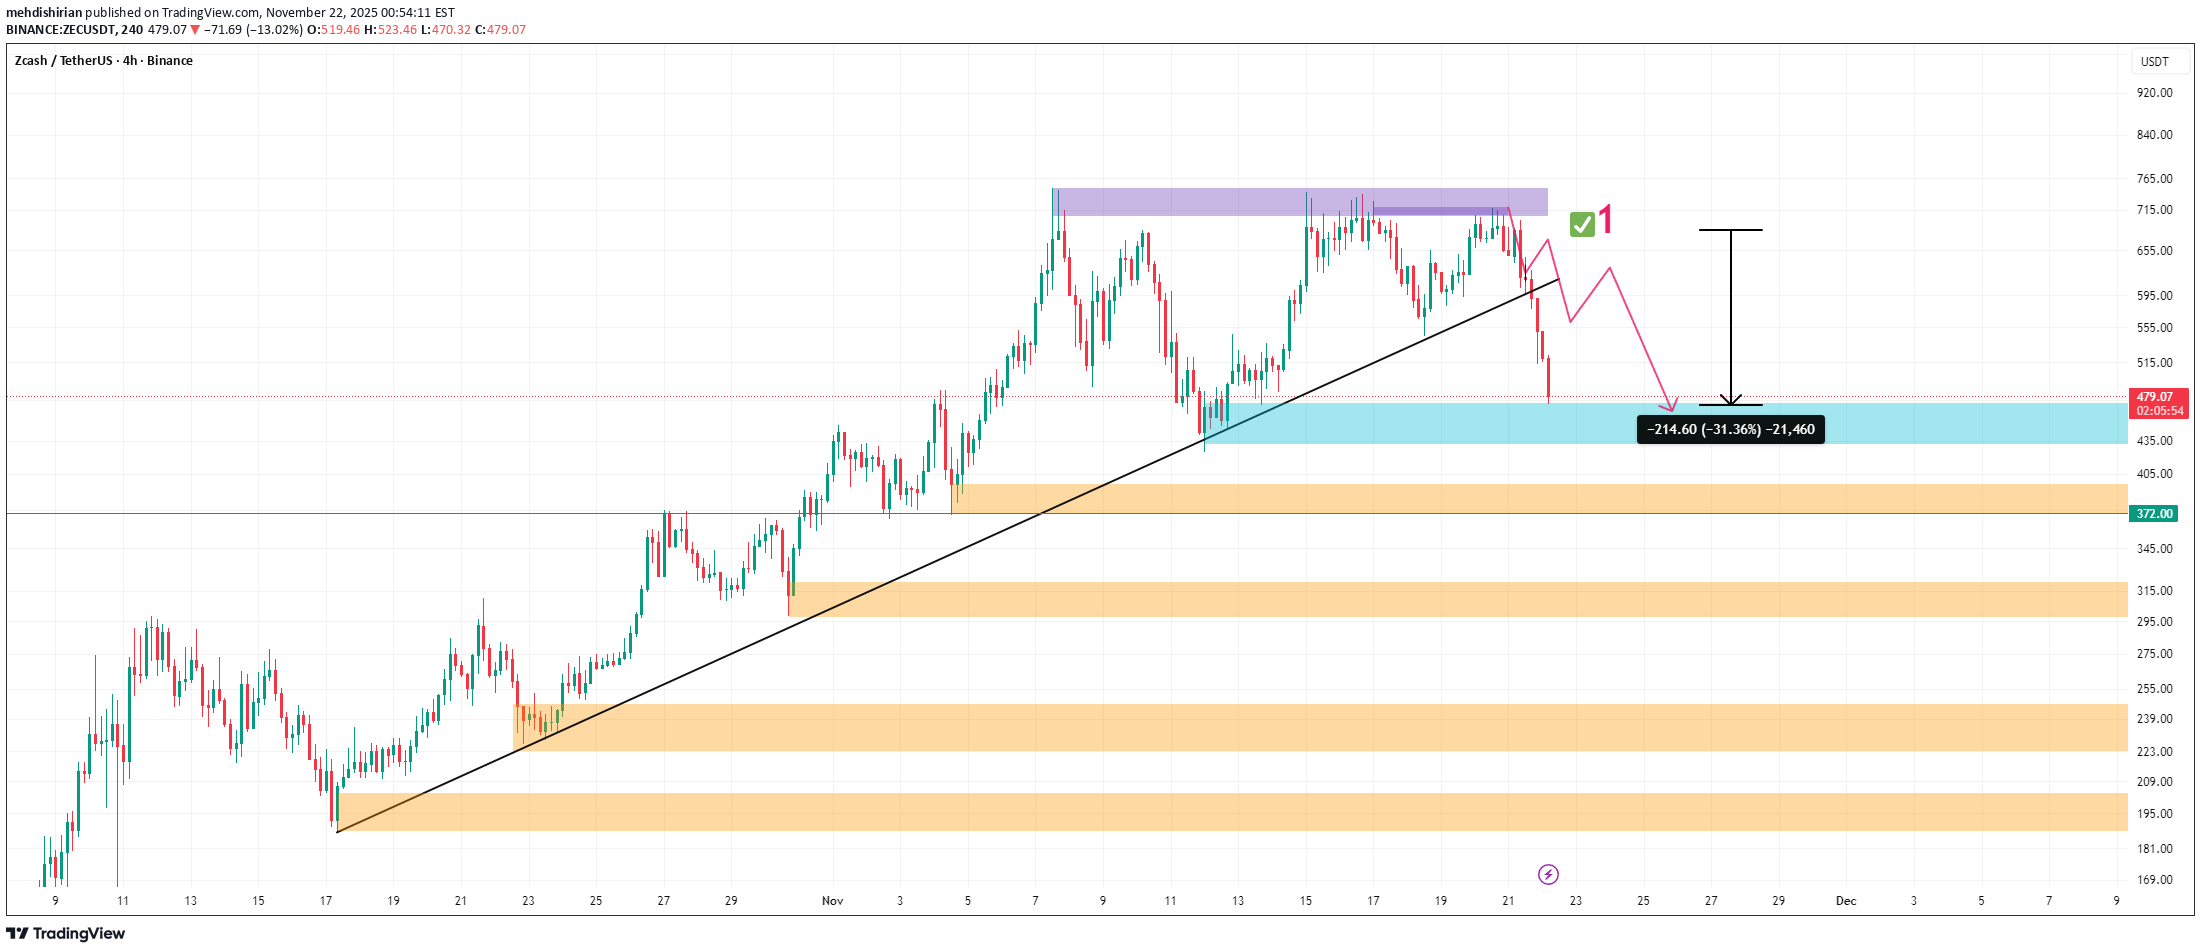
Hello everyone 😍 I hope you are well 👌😊 💁♂️ First of all, thank you for clicking the "boost button" to give me a thumbs up. ❤️ 🔥 I am back with another great analysis 💁♂️ In the last analysis I gave you of the ZEC - USDT cryptocurrency, we went through the first scenario as predicted and reached the first target very quickly 🔥 The result of this analysis was a 31% drop so far 🔥🔥🔥 🤔 Did you use this analysis? 💁♂️ To improve the analysis process that I am providing, please share your comments with me ❤️ Would you like to support me by donating to post more analysis? ❤️ ⚠️The analysis may not reach the final target, so at each target, if you make a good profit and see signs of a trend change, you can exit the trade or manage your capital. ⚠️ None of the analysis is a recommendation to buy or sell, but simply my personal opinions on the charts. You can use the charts and choose any that interest you and take a position if you wish. To support me, I would appreciate it if you boost the analysis and share it with your friends so that I can analyze it with more energy for you, my dears. Thank you all. 💖
پیشبینی سقوط قیمت: آیا سهام به ۳۷۵ دلار میرسد؟ (تحلیل الگوی M متوالی)
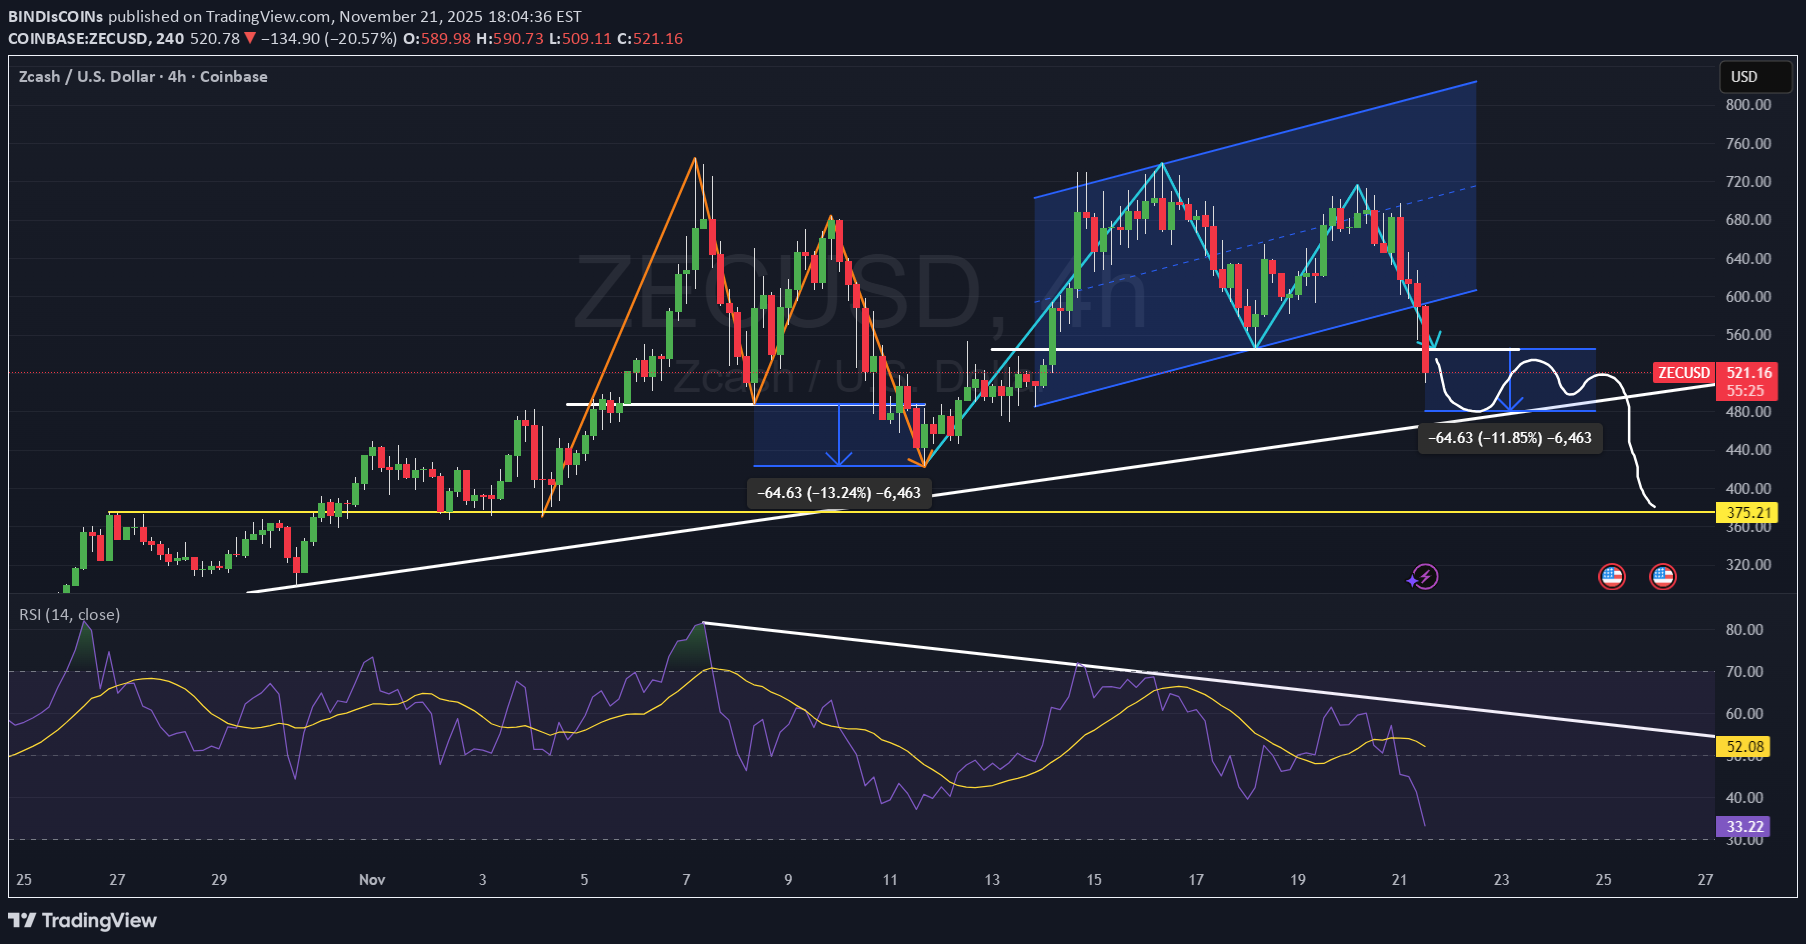
This 4H Chart shows a potential downward move to $375. Price has just broken the neckline of the second consecutive M pattern (Mtop), thus making this next downward move more extreme than the first. Please see the first M pattern in orange with a clear white neckline that was broken with a measured move down from the breakpoint to the next pivot low where price reversed, trended upwards to start forming the move up for the second M pattern to form. The second M pattern in light blue has now formed and broken below its neckline in white, with a duplicated measured move down added from first M pattern neckline. Notice how the second measured move down coexists with a strong upsloping trend line. There is also an upsloping parallel channel that has been broken. Also, negative divergence on RSI. Lastly, notice my projected path down in white.
Reallifetrading
الگوی سقف دوقلو در زیکش (Zcash): آماده سقوط بزرگ؟
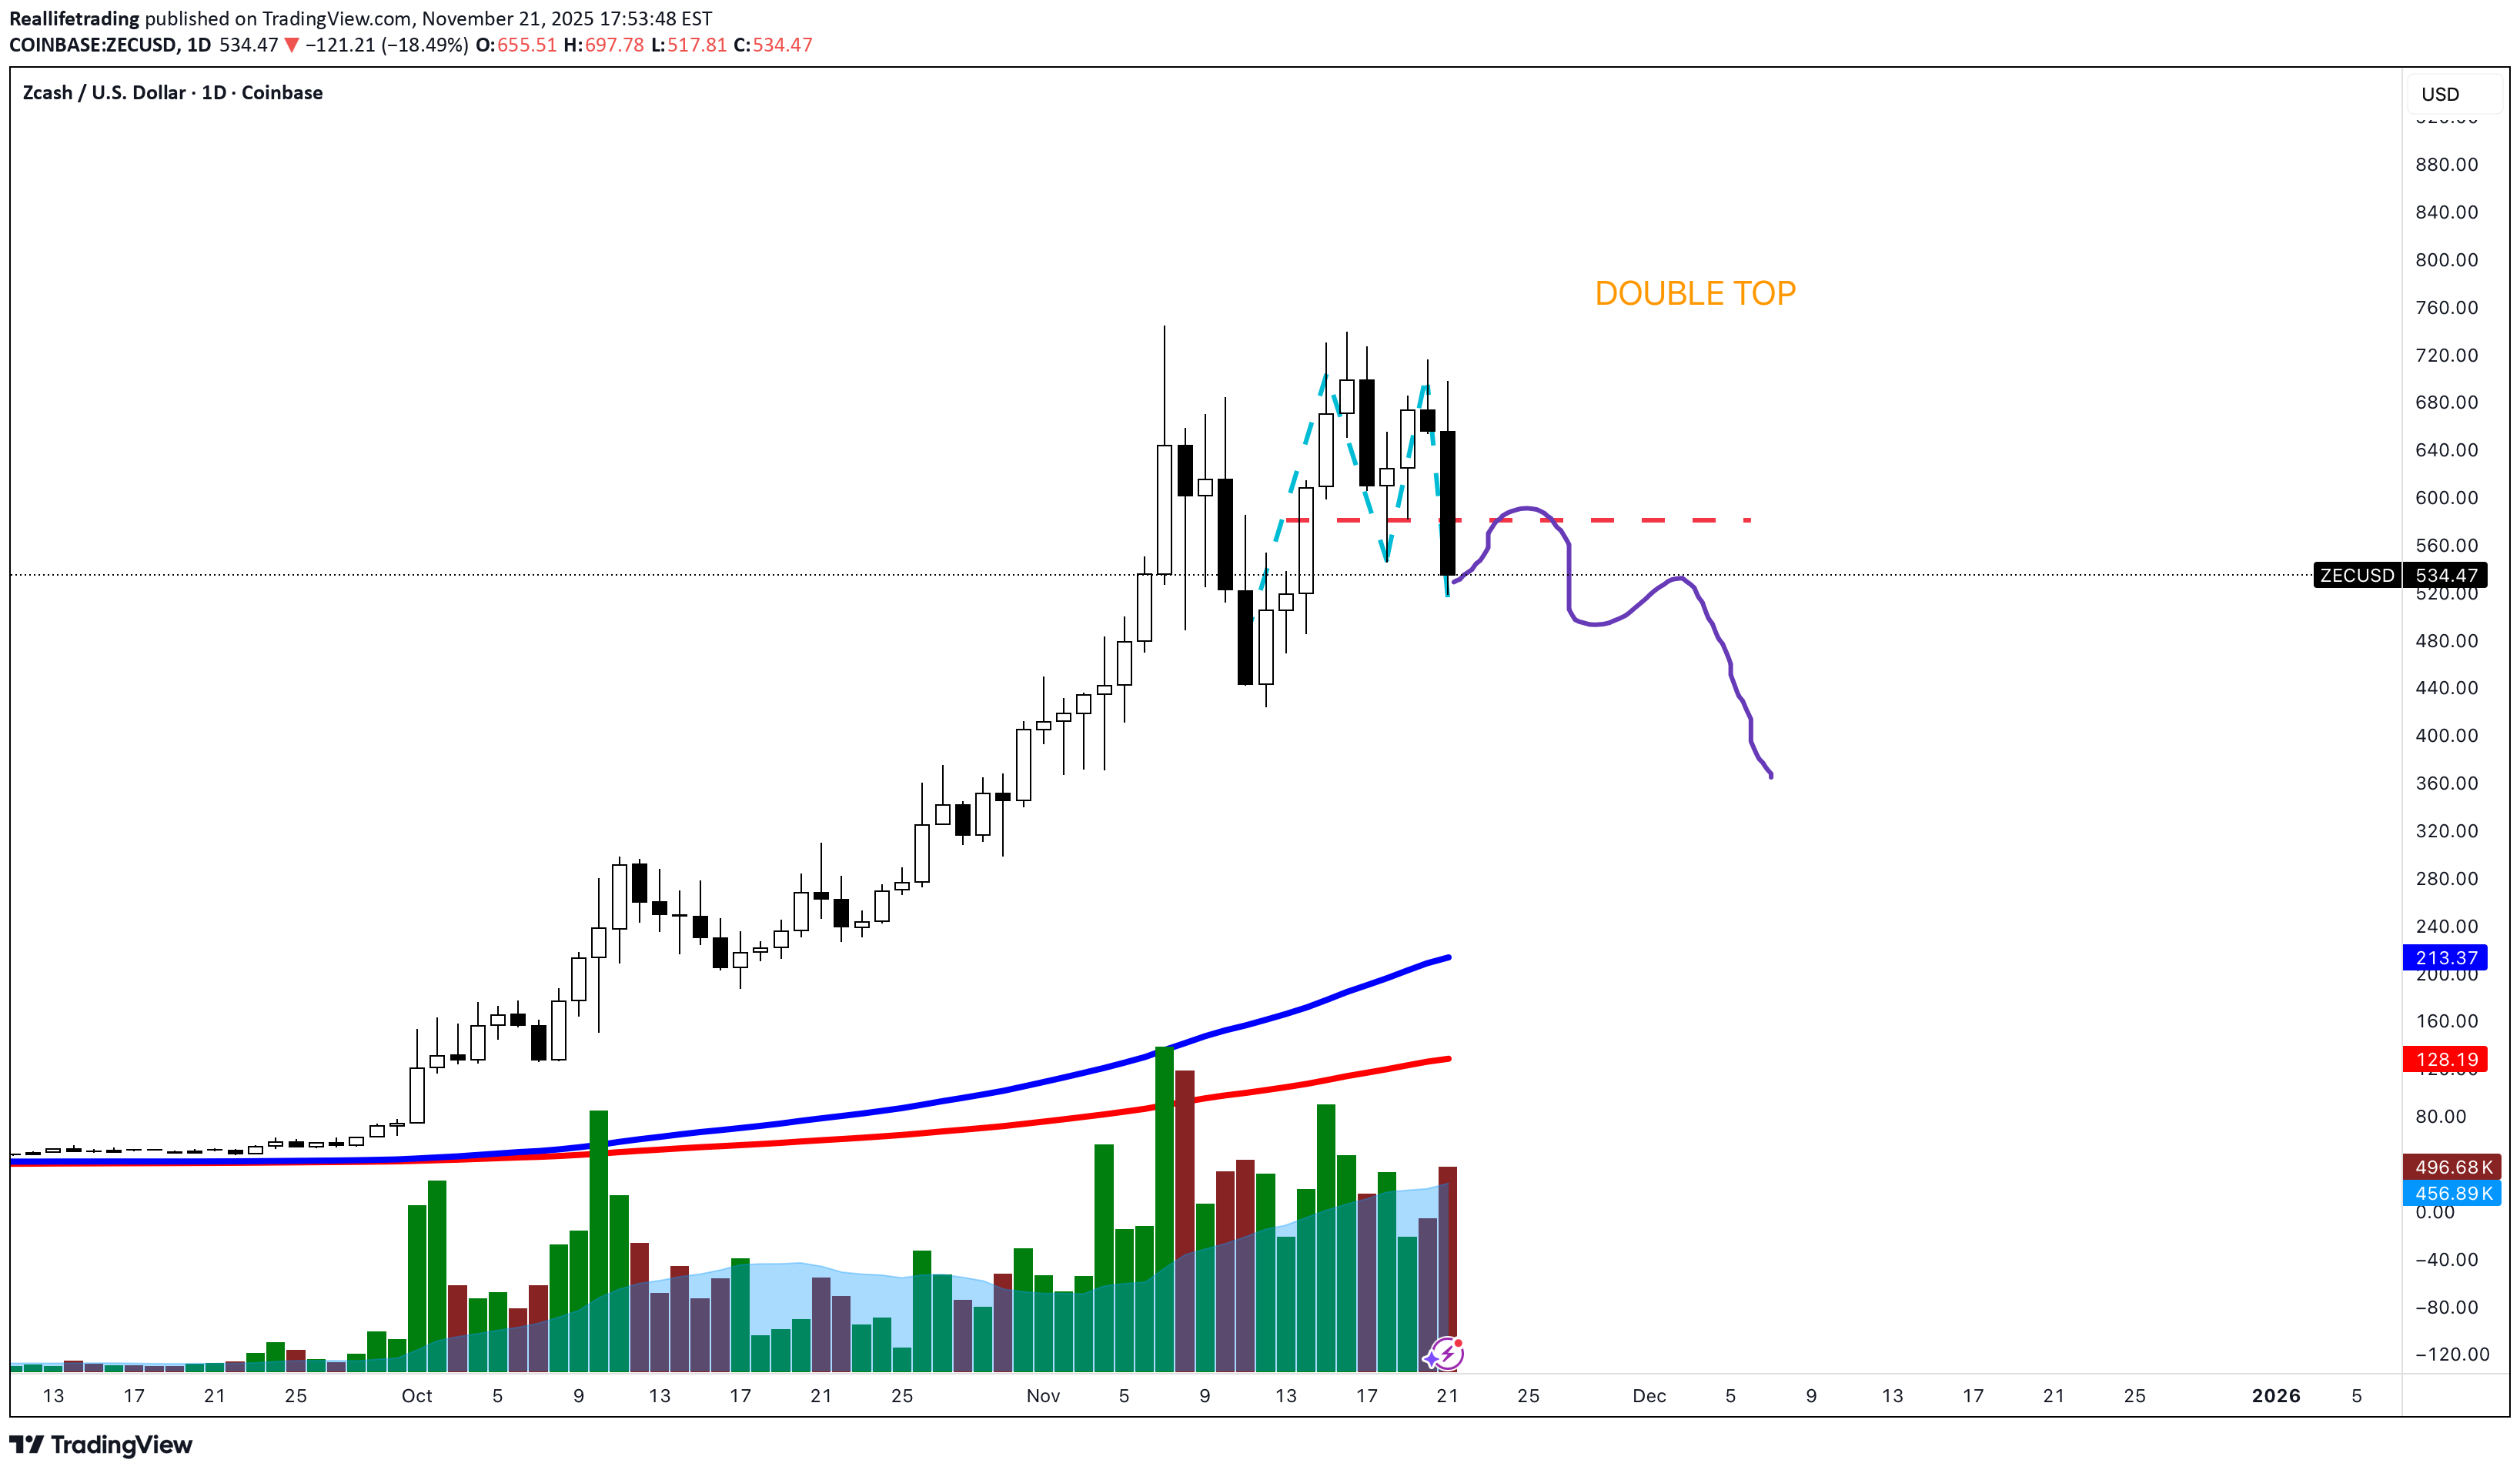
WOW! This one one ran up big.... and now... she's about to pull back. :) Crypto in general has been WILDLY weak...
Disclaimer
Any content and materials included in Sahmeto's website and official communication channels are a compilation of personal opinions and analyses and are not binding. They do not constitute any recommendation for buying, selling, entering or exiting the stock market and cryptocurrency market. Also, all news and analyses included in the website and channels are merely republished information from official and unofficial domestic and foreign sources, and it is obvious that users of the said content are responsible for following up and ensuring the authenticity and accuracy of the materials. Therefore, while disclaiming responsibility, it is declared that the responsibility for any decision-making, action, and potential profit and loss in the capital market and cryptocurrency market lies with the trader.