
BINDIsCOINs
@t_BINDIsCOINs

What symbols does the trader recommend buying?
Purchase History
پیام های تریدر
Filter
ICP Bottoming Tail & Repeat to $9.00

Happy New Year everyone. This is my take on current ICP Price action on 1D chart timeframe. Yesterday, a very nice Bottoming Tail (marked at top of white arrow) was printed after piercing the support trendline in orange that was a previous very important pivot low (marked with a green arrow) of $2.789 on October 30, 2025. This created a nice bounce up with decent volume forming a new recent low price of $2.662 and possibly another very important pivot low signaling a trend reversal. This shows strong buyer interest and makes a good bullish case with decent volume defending this level. Take note of what happened the last time this price action took place and you will see that the price increased to $9.849 (253.14%) in a matter of 9 days! Also, take into account each resistance area marked in order from pink, blue, yellow, and lastly green, where price may pause briefly (or be rejected) on the way up. Another bullish factor is the possible breakout at the top of the down sloping parallel channel, this will need to be confirmed tomorrow with a close above the wick price from today's candle. The top descending trendline in white that starts from $15.577 on December 7, 2024 and connects to the most recent high of $9.849 on November 8, 2025 will be the first price target of $8.788. If history repeats itself and the price moves up 253.14%, then the target becomes $9.708. Overall, a very interesting scenario and a very bullish set up with a possible journey to around $9.00.
Wedge Breakout, Bull Flag, & All Time Low

1D Chart Technical Analysis. An inside bar bull flag pattern in a parallel channel is forming after a breakout of descending wedge pattern highlighted in the bluish green triangle. Immediate support is at the bottom of the bull flag parallel channel. Next, and stronger support is at the white descending trendline that has had 3 hits over a much longer timeframe: (1st) First starting at the pivot low of $4.224 on December 30, 2022, connecting to (2nd) Second pivot low of $3.566 on October 19, 2023, and finally connecting to (3rd) Third and most recent low (ATL) of $1.654 on last Friday, December 26. Price should make a move up through the top of the parallel channel to test the recent resistance zone highlighted in the purple box. If price breaks through the purple resistance zone between $2.35 - $2.54, then look for a test of next resistance level of $3.377 marked with the red line. Overall, this is a very decent bullish setup that is bouncing up from an all time low.
WEDGE BREAKOUT, BULL FLAG, ALL TIME LOW

1D Chart Technical Analysis. An inside bar bull flag pattern in a parallel channel is forming after a breakout of descending wedge pattern highlighted in the bluish green triangle. Immediate support is at the bottom of the bull flag parallel channel. Next, and more strong support is at the white descending trendline that has had 3 hits over a much longer timeframe: (1st) First starting at the pivot low of $4.224 on December 30, 2022, connecting to (2nd) Second pivot low of $3.566 on October 19, 2023, and finally connecting to (3rd) third and most recent low (ATL) of $1.654 on last Friday, December 26. Price should make a move up to test the recent resistance zone highlighted in the purple box. If price breaks through the purple resistance zone between $2.35 - $2.54, then look for a test of next resistance level of $3.377 marked with the red line. Overall, this is a very decent bullish setup that is bouncing up from an all time low.
سقوط قریبالوقوع ZEC: آیا خط حمایت مهم میشکند؟

I will keep this 4H chart explanation simple. Notice the upsloping trend line in white. Price has just made the tenth (10) hit on it and has acted as support thus far. The support hits on the trend line are marked by the green up arrows. How many times can price hit and bounce up off of this support line? Price is at about a 85-90% chance of breaking below the trend line. We need a confirmed close below the trend line for the price to really dump down to the minor support lines in yellow. These will be temporary stops and reversals on the trip down. Not looking good for ZEC. Very bearish. Plus, there is still negative RSI divergence.
پیشبینی سقوط قیمت: آیا سهام به ۳۷۵ دلار میرسد؟ (تحلیل الگوی M متوالی)
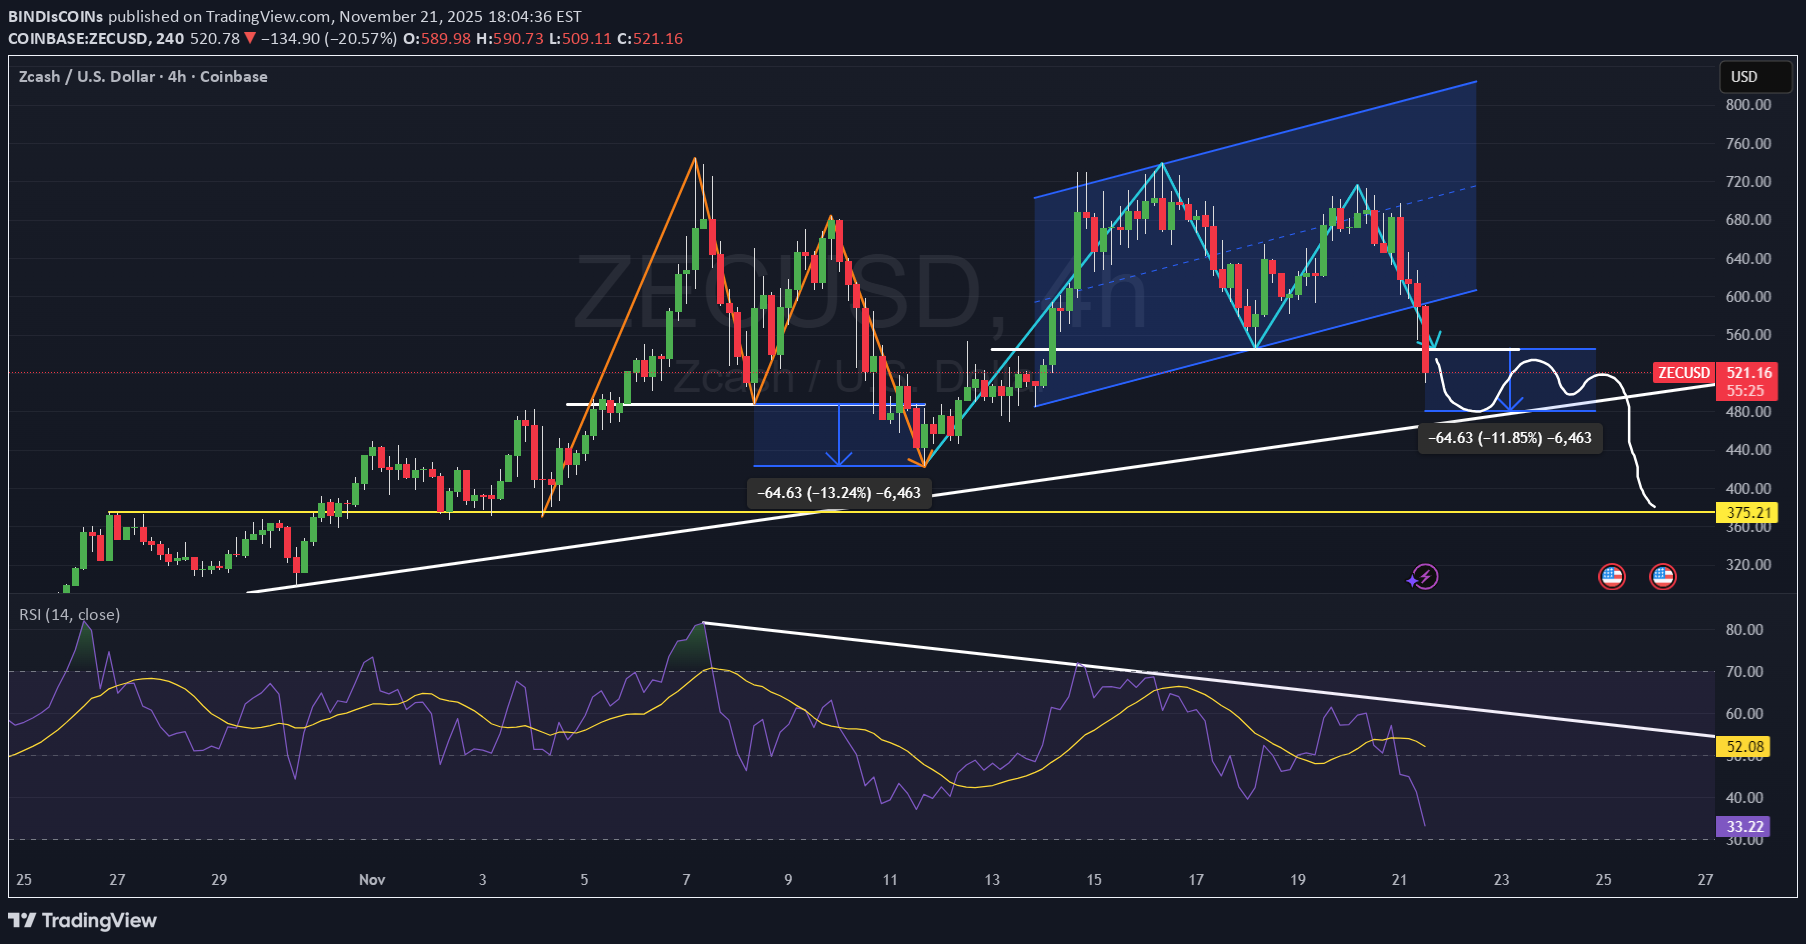
This 4H Chart shows a potential downward move to $375. Price has just broken the neckline of the second consecutive M pattern (Mtop), thus making this next downward move more extreme than the first. Please see the first M pattern in orange with a clear white neckline that was broken with a measured move down from the breakpoint to the next pivot low where price reversed, trended upwards to start forming the move up for the second M pattern to form. The second M pattern in light blue has now formed and broken below its neckline in white, with a duplicated measured move down added from first M pattern neckline. Notice how the second measured move down coexists with a strong upsloping trend line. There is also an upsloping parallel channel that has been broken. Also, negative divergence on RSI. Lastly, notice my projected path down in white.

Disclaimer
Any content and materials included in Sahmeto's website and official communication channels are a compilation of personal opinions and analyses and are not binding. They do not constitute any recommendation for buying, selling, entering or exiting the stock market and cryptocurrency market. Also, all news and analyses included in the website and channels are merely republished information from official and unofficial domestic and foreign sources, and it is obvious that users of the said content are responsible for following up and ensuring the authenticity and accuracy of the materials. Therefore, while disclaiming responsibility, it is declared that the responsibility for any decision-making, action, and potential profit and loss in the capital market and cryptocurrency market lies with the trader.